Budget Chart

Column Chart Ppt PowerPoint Presentation Outline Deck
This is a column chart ppt powerpoint presentation outline deck. This is a two stage process. The stages in this process are business, marketing, expenditure in, years, graph.

Column Chart Ppt PowerPoint Presentation Ideas Deck
This is a column chart ppt powerpoint presentation ideas deck. This is a two stage process. The stages in this process are business, marketing, dollars, in years, graph.

Stock Chart Ppt PowerPoint Presentation Show
This is a stock chart ppt powerpoint presentation show. This is a two stage process. The stages in this process are high, volume, low, business, marketing.

Area Chart Ppt PowerPoint Presentation Summary Backgrounds
This is a area chart ppt powerpoint presentation summary backgrounds. This is a two stage process. The stages in this process are percentage, financial, business, management.

Column Chart Ppt PowerPoint Presentation Professional Shapes
This is a column chart ppt powerpoint presentation professional shapes. This is a two stage process. The stages in this process are business, management, marketing.

Area Chart Ppt PowerPoint Presentation Styles Ideas
This is a area chart ppt powerpoint presentation styles ideas. This is a three stage process. The stages in this process are percentage, product, business.

Bubble Chart Ppt PowerPoint Presentation Background Designs
This is a bubble chart ppt powerpoint presentation background designs. This is a two stage process. The stages in this process are product, percentage, marketing, business.

Column Chart Ppt PowerPoint Presentation Pictures Aids
This is a column chart ppt powerpoint presentation pictures aids. This is a two stage process. The stages in this process are Percentage, Product, Marketing, Management.

Area Chart Ppt PowerPoint Presentation Show Graphics
This is a area chart ppt powerpoint presentation show graphics. This is a three stage process. The stages in this process are percentage, product, marketing, management, business.

Combo Chart Ppt PowerPoint Presentation Slides Slideshow
This is a combo chart ppt powerpoint presentation slides slideshow. This is a three stage process. The stages in this process are percentage, product, marketing, management, business.

Column Chart Ppt PowerPoint Presentation Model Slideshow
This is a column chart ppt powerpoint presentation model slideshow. This is a two stage process. The stages in this process are percentage, product, business, marketing.

Combo Chart Ppt PowerPoint Presentation Styles Topics
This is a combo chart ppt powerpoint presentation styles topics. This is a three stage process. The stages in this process are percentage, product, business, management, marketing.

Line Chart Ppt PowerPoint Presentation Layouts Information
This is a line chart ppt powerpoint presentation layouts information. This is a two stage process. The stages in this process are business, marketing, line chart, analysis, growth.

Area Chart Ppt PowerPoint Presentation Styles Designs
This is a area chart ppt powerpoint presentation styles designs. This is a two stage process. The stages in this process are area chart, product.

Area Chart Ppt PowerPoint Presentation Pictures Rules
This is a area chart ppt powerpoint presentation pictures rules. This is a two stage process. The stages in this process are area chart, business, marketing, strategy, success.
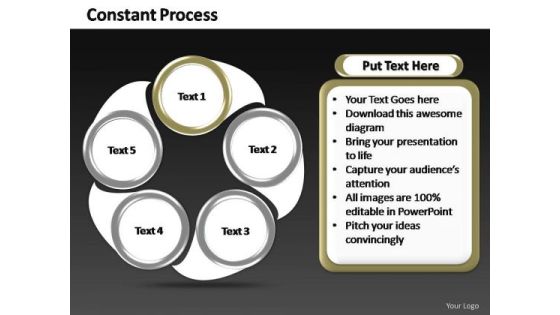
PowerPoint Slide Chart Constant Process Ppt Design
PowerPoint Slide Chart Constant Process PPT Design-PowerPoint Slide Designs Teamwork Round Moving PPT Slide Designs-Explore the various directions and layers existing in your in your plans and processes. Unravel the desired and essential elements of your overall strategy. Explain the relevance of the different layers and stages and directions in getting down to your core competence, ability and desired result.-PowerPoint Slide Chart Constant Process PPT Design
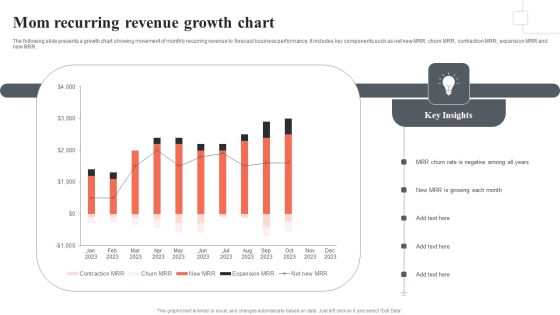
Mom Recurring Revenue Growth Chart Themes PDF
The following slide presents a growth chart showing movement of monthly recurring revenue to forecast business performance. It includes key components such as net new MRR, churn MRR, contraction MRR, expansion MRR and new MRR. Showcasing this set of slides titled Mom Recurring Revenue Growth Chart Themes PDF. The topics addressed in these templates are MRR Churn Rate, Negative, MRR Growing Each Month. All the content presented in this PPT design is completely editable. Download it and make adjustments in color, background, font etc. as per your unique business setting.
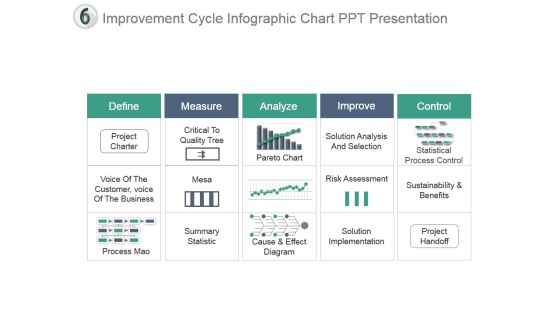
Improvement Cycle Infographic Chart Ppt Presentation
This is a improvement cycle infographic chart ppt presentation. This is a five stage process. The stages in this process are define, measure, analyze, improve, control, project charter, critical to quality tree, process mao, summary statistic, mesa, pareto chart, cause and effect diagram, solution analysis and selection, risk assessment, solution implementation, sustainability and benefits, project handoff, statistical process control, voice of the customer, voice of the business.

PowerPoint Presentation Process Flow Chart Circular Templates
We present our powerpoint presentation process flow chart Circular templates.Present our Business PowerPoint Templates because like the famed William Tell, they put aside all emotions and concentrate on the target. Download and present our Flow Charts PowerPoint Templates because it helps you to inform your team of your innovative ideas. Use our Process and Flows PowerPoint Templates because you can Signpost your preferred roadmap to your eager co- travellers and demonstrate clearly how you intend to navigate them towards the desired corporate goal. Download and present our Shapes PowerPoint Templates because brilliant ideas are your forte. Download our Success PowerPoint Templates because the choices you make today will determine the future growth of your enterprise.Use these PowerPoint slides for presentations relating to Arrows, Business, Central, Centralized, Chart, Circle, Circular, Circulation, Concept, Conceptual, Illustration, Organization, Pointing, Process, Radial, Resource, Strategy, Template, Graphic, Group, Illustration, Process, Progress. The prominent colors used in the PowerPoint template are Blue, Gray, White. People tell us our powerpoint presentation process flow chart Circular templates are Stunning. Professionals tell us our Circle PowerPoint templates and PPT Slides will generate and maintain the level of interest you desire. They will create the impression you want to imprint on your audience. Customers tell us our powerpoint presentation process flow chart Circular templates are No-nonsense. Use our Circular PowerPoint templates and PPT Slides are Beautiful. We assure you our powerpoint presentation process flow chart Circular templates will impress their bosses and teams. Professionals tell us our Concept PowerPoint templates and PPT Slides are Tasteful.
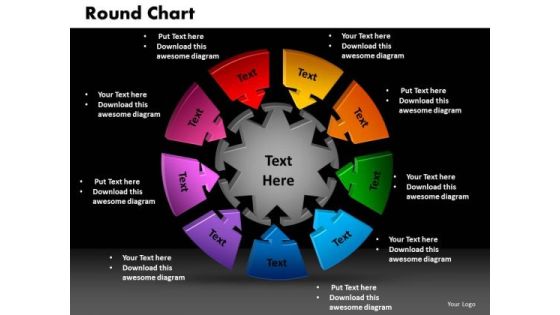
PowerPoint Template Round Chart Finance Ppt Slides
PowerPoint Template Round Chart Finance PPT Slides-Determine your targets and sequence them as per your priorities. Unravel each one for your audience while setting key timelines as you go along. Educate your listeners on the relevance and importance of each one as per your plan and how they all contribute as you strive to hit the Bullseye-PowerPoint Template Round Chart Finance PPT Slides-This ppt can be used for presentations relating to-3d, Answer, Arrow, Background, Business, Chance, Choice, Circular, Conceptual, Creative, Decision, Direction, Dollar, Entrance, Exit, Find, Game, Graphic, Help, Idea, Illustration, Inspiration, Intricacy, Isolated, Labyrinth, Marketing
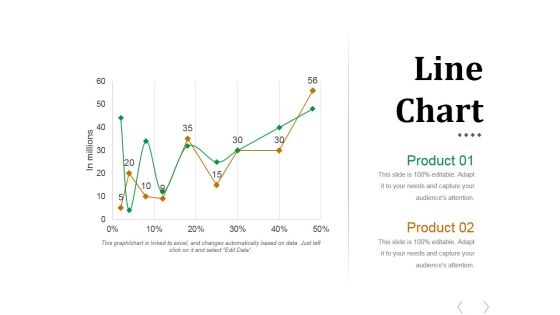
Line Chart Ppt PowerPoint Presentation Styles Outfit
This is a line chart ppt powerpoint presentation styles outfit. This is a two stage process. The stages in this process are business, finance, management, growth, planning.

Column Chart Ppt PowerPoint Presentation Professional Vector
This is a column chart ppt powerpoint presentation professional vector. This is a nine stage process. The stages in this process are business, marketing, graph, finance, growth.
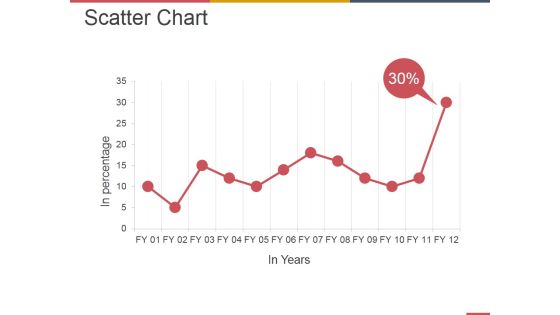
Scatter Chart Ppt PowerPoint Presentation File Example
This is a scatter chart ppt powerpoint presentation file example. This is a twelve stage process. The stages in this process are business, strategy, marketing, analysis, finance.

Scatter Chart Ppt PowerPoint Presentation Styles Show
This is a scatter chart ppt powerpoint presentation styles show. This is a nine stage process. The stages in this process are dollars, in percentage, finance, growth strategy.
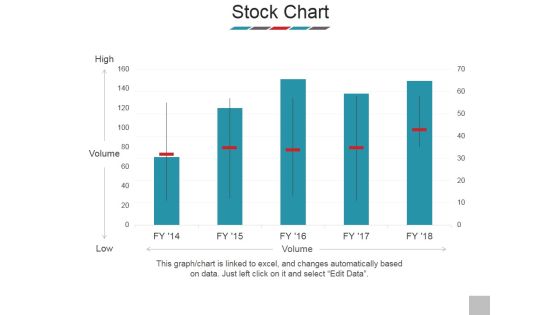
Stock Chart Ppt PowerPoint Presentation Show Templates
This is a stock chart ppt powerpoint presentation show templates. This is a five stage process. The stages in this process are high, volume, low, business, marketing.
Line Chart Ppt PowerPoint Presentation Icon Elements
This is a line chart ppt powerpoint presentation icon elements. This is a two stage process. The stages in this process are line graph, marketing, presentation, business, management.
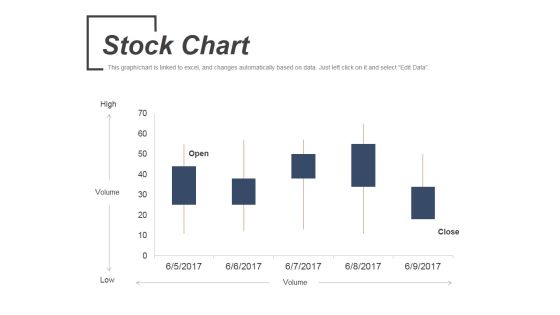
Stock Chart Ppt PowerPoint Presentation Ideas Topics
This is a stock chart ppt powerpoint presentation ideas topics. This is a five stage process. The stages in this process are volume, low, high, open, close.

Combo Chart Ppt PowerPoint Presentation Samples
This is a combo chart ppt powerpoint presentation samples. This is a four stage process. The stages in this process are business, marketing, strategy, success, growth.

PowerPoint Templates Process Chart Business Ppt Themes
PowerPoint Templates process chart Business PPT Themes-Create attractive presentations with this pre-designed Process Chart. This will be best suited for coordinated coherences, hierarchies and processes.-3d, arrow, art, business, chart, circle, concept, connection, cycle, development, diagram, direction, element, environment, finance, financial, flow, graphic, group, investment, isolated, market,, movement, organization, passive income, perspective, presentation, process chart, recycle, report, sign, step, success, symbol, teamwork-PowerPoint Templates process chart Business PPT Themes

PowerPoint Designs Process Chart Strategy Ppt Slide
PowerPoint Designs process Chart Strategy PPT Slide-This Process Chart can be used as data flow diagram to show the flow of the data as it moves from beginning process to end result.-3d, arrow, art, business, chart, circle, concept, connection, cycle, development, diagram, direction, element, environment, finance, financial, flow, graphic, group, investment, isolated, market,, movement, organization, passive income, perspective, presentation, process chart, recycle, report, sign, step, success, symbol, teamwork-PowerPoint Designs process Chart Strategy PPT Slide
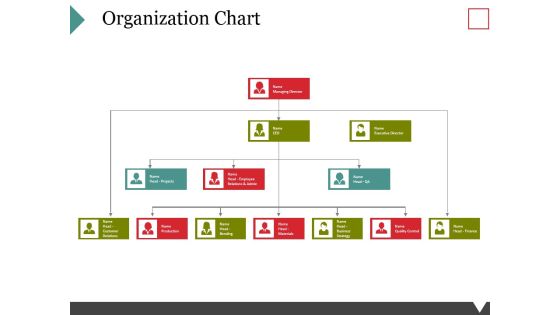
Organization Chart Ppt PowerPoint Presentation Layouts Slideshow
This is a organization chart ppt powerpoint presentation layouts slideshow. This is a three stage process. The stages in this process are managing director, executive director, ceo, production, quality control, head projects.
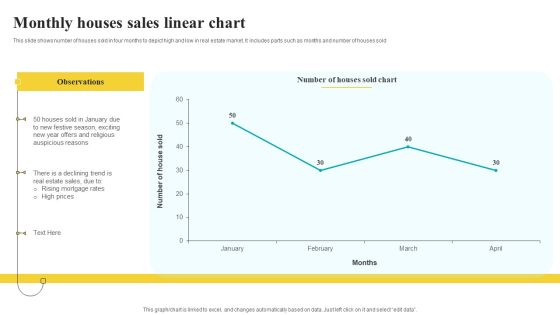
Monthly Houses Sales Linear Chart Pictures PDF
This slide shows number of houses sold in four months to depict high and low in real estate market. It includes parts such as months and number of houses sold Pitch your topic with ease and precision using this Monthly Houses Sales Linear Chart Pictures PDF. This layout presents information on Observations, Auspicious Reasons, Sales Linear Chart. It is also available for immediate download and adjustment. So, changes can be made in the color, design, graphics or any other component to create a unique layout.

Combo Chart Ppt PowerPoint Presentation Portfolio Infographics
This is a combo chart ppt powerpoint presentation portfolio infographics. This is a eight stage process. The stages in this process are market size, growth, years, finance, business.
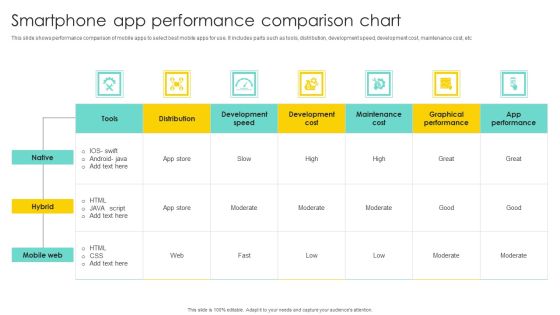
Smartphone App Performance Comparison Chart Rules PDF
Showcasing this set of slides titled Smartphone App Performance Comparison Chart Rules PDF. The topics addressed in these templates are Development Speed, Maintenance Cost, Graphical Performance. All the content presented in this PPT design is completely editable. Download it and make adjustments in color, background, font etc. as per your unique business setting.

Bar Chart Ppt PowerPoint Presentation Templates PDF
Presenting this set of slides with name bar chart ppt powerpoint presentation templates pdf. The topics discussed in these slide is bar chat. This is a completely editable PowerPoint presentation and is available for immediate download. Download now and impress your audience.
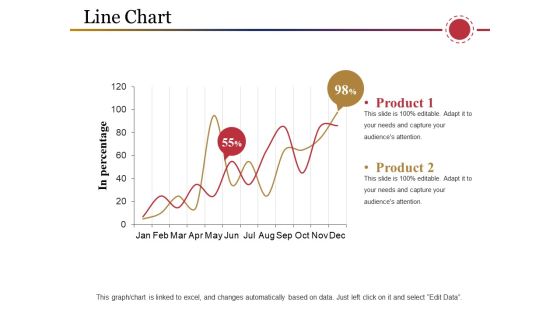
Line Chart Ppt PowerPoint Presentation Inspiration Samples
This is a line chart ppt powerpoint presentation inspiration samples. This is a two stage process. The stages in this process are product, in percentage, business, marketing, graph.
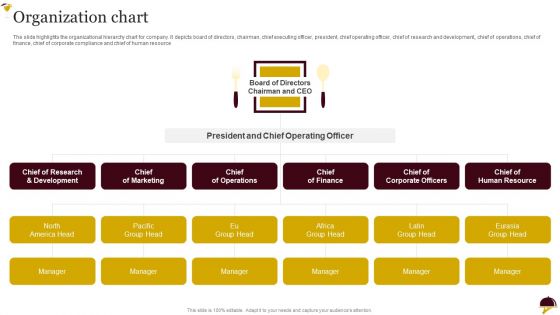
Food Company Overview Organization Chart Information PDF
The slide highlights the organizational hierarchy chart for company. It depicts board of directors, chairman, chief executing officer, president, chief operating officer, chief of research and development,, chief of operations, chief of finance, chief of corporate compliance and chief of human resource.This is a Food Company Overview Organization Chart Information PDF template with various stages. Focus and dispense information on six stages using this creative set, that comes with editable features. It contains large content boxes to add your information on topics like Corporate Officers, Chief Operations, Chief Marketing You can also showcase facts, figures, and other relevant content using this PPT layout. Grab it now.

Clustered Chart Ppt Powerpoint Presentation Inspiration Guidelines
Presenting this set of slides with name clustered chart ppt powerpoint presentation inspiration guidelines. The topics discussed in these slide is clustered bar . This is a completely editable PowerPoint presentation and is available for immediate download. Download now and impress your audience.

Agile Org Chart It Financial Mockup PDF
Deliver an awe inspiring pitch with this creative agile org chart it financial mockup pdf bundle. Topics like minimum, medium, maximum can be discussed with this completely editable template. It is available for immediate download depending on the needs and requirements of the user.

Facilities Management Functional Organizational Chart Formats PDF
This slide highlights the functional organizational chart of facilities management company which includes facilities operations, utilities operations, planning and design, custodial services and waste management operations department. Slidegeeks is one of the best resources for PowerPoint templates. You can download easily and regulate Facilities Management Functional Organizational Chart Formats PDF for your personal presentations from our wonderful collection. A few clicks is all it takes to discover and get the most relevant and appropriate templates. Use our Templates to add a unique zing and appeal to your presentation and meetings. All the slides are easy to edit and you can use them even for advertisement purposes.
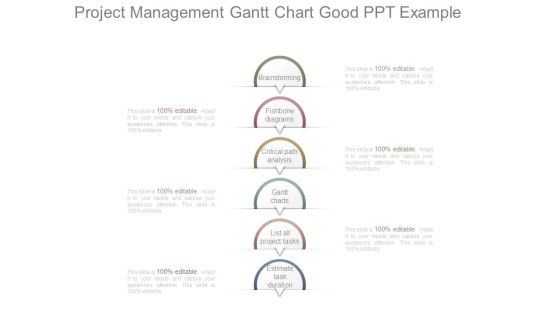
Project Management Gantt Chart Good Ppt Example
This is a project management gantt chart good ppt example. This is a six stage process. The stages in this process are brainstorming, fishbone diagrams, critical path analysis, gantt charts, list all project tasks, estimate task duration.

Bar Chart Ppt PowerPoint Presentation Diagram Lists
This is a bar chart ppt powerpoint presentation diagram lists. This is a two stage process. The stages in this process are business, marketing, financial years, sales in percentage, graph.

Business Market Research Services Chart Slides
This is a business market research services chart slides. This is a five stage process. The stages in this process are detailed demographic and expenditure reports, competitive analysis trends and benchmarks, industry and economic profile by region, sme performance reports by sector, information on businesses in canada and north america.

Bar Chart Ppt PowerPoint Presentation Portfolio Diagrams
This is a bar chart ppt powerpoint presentation portfolio diagrams. This is a three stage process. The stages in this process are sales in percentage, business, marketing, graph, finance.

Bar Chart Ppt PowerPoint Presentation Layouts Template
This is a bar chart ppt powerpoint presentation layouts template. This is a two stage process. The stages in this process are financial year, sales in percentage, business, marketing, finance.

Bar Chart Ppt PowerPoint Presentation Outline Guidelines
This is a bar chart ppt powerpoint presentation outline guidelines. This is a four stage process. The stages in this process are product, unit count, in years, graph, finance, business.
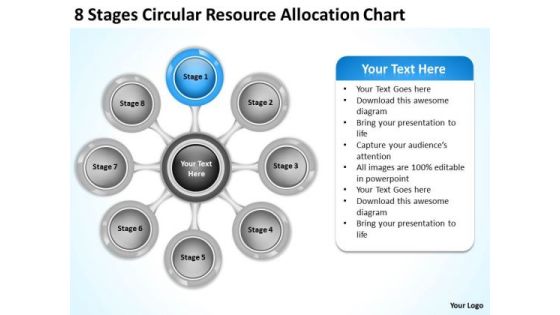
Business Strategy Implementation Resource Allocation Chart Internet
We present our business strategy implementation resource allocation chart internet.Use our Marketing PowerPoint Templates because You will get more than you ever bargained for. Use our Business PowerPoint Templates because Our PowerPoint Templates and Slides will let your words and thoughts hit bullseye everytime. Use our Circle Charts PowerPoint Templates because They will Put the wind in your sails. Skim smoothly over the choppy waters of the market. Download and present our Arrows PowerPoint Templates because Our PowerPoint Templates and Slides will bullet point your ideas. See them fall into place one by one. Present our Process and Flows PowerPoint Templates because Our PowerPoint Templates and Slides will definately Enhance the stature of your presentation. Adorn the beauty of your thoughts with their colourful backgrounds.Use these PowerPoint slides for presentations relating to 3d, Action, Analysis, Attitude, Brainstorming, Business, Chart, Classroom, Concept, Conceptual, Conference, Connection, Corporate, Design, Diagram, Direction, Element, Employee, Enhance, Financial, Formula, Future, Goal, Graphic, Guidelines, Idea, Link, Management, Market, Marketing, Mind, Mind Map, Organization, Organize, Plan, Process, Product, Relation, Render, Solutions, Strategy, Success, Successful, Tactic, Target, Text, Training, Unity. The prominent colors used in the PowerPoint template are Tan, Gray, Black.

Bar Chart Ppt PowerPoint Presentation File Model
This is a bar chart ppt powerpoint presentation file model. This is a two stage process. The stages in this process are business, strategy, marketing, analysis, finance, bar graph.

Bar Chart Ppt PowerPoint Presentation Summary Themes
This is a bar chart ppt powerpoint presentation summary themes. This is a three stage process. The stages in this process are financial years, sales in percentage, business, marketing, graph.

Bar Chart Ppt PowerPoint Presentation Icon Introduction
This is a bar chart ppt powerpoint presentation icon introduction. This is a seven stage process. The stages in this process are in years, in percentage, business, marketing, graph.

Bar Chart Ppt PowerPoint Presentation Layouts Pictures
This is a bar chart ppt powerpoint presentation layouts pictures. This is a three stage process. The stages in this process are bar graph, product, sales in percentage, business, marketing.

Bar Chart Ppt PowerPoint Presentation Outline Introduction
This is a bar chart ppt powerpoint presentation outline introduction. This is a one stage process. The stages in this process are sales in percentage, product, business, financial years, graph.

Bar Chart Ppt PowerPoint Presentation Styles Outfit
This is a bar chart ppt powerpoint presentation styles outfit. This is a Seven stage process. The stages in this process are sales in percentage, financial years, graph, business.

Bar Chart Ppt PowerPoint Presentation File Slide
This is a bar chart ppt powerpoint presentation file slide. This is a one stage process. The stages in this process are sales in percentage financial years, business, marketing, strategy, graph.

Bar Chart Ppt PowerPoint Presentation Model Sample
This is a bar chart ppt powerpoint presentation model sample. This is a two stage process. The stages in this process are sales in percentage, business, marketing, graph, percentage, year.

Area Chart Ppt PowerPoint Presentation Show Templates
This is a area chart ppt powerpoint presentation show templates. This is a two stage process. The stages in this process are product, in percentage, in years, finance, graph.

PowerPoint Layouts Chart Quadrants Ppt Templates
PowerPoint Layouts Chart Quadrants PPT Templates-The Circle of Life - a concept emmbedded in our minds and hence easy to comprehend. Life and Business is made up of processes comprising stages that flow from one to another. An excellent graphic to attract the attention of and understanding by your audience to improve earnings.

Area Chart Ppt PowerPoint Presentation Slides Rules
This is a area chart ppt powerpoint presentation slides rules. This is a two stage process. The stages in this process are sales in percentage, business, marketing, product, finance.

Line Chart Ppt PowerPoint Presentation Professional Ideas
This is a line chart ppt powerpoint presentation professional ideas. This is a two stage process. The stages in this process are in percentage, product, business, marketing, finance, percentage.

Area Chart Ppt PowerPoint Presentation Summary Objects
This is a area chart ppt powerpoint presentation summary objects. This is a two stage process. The stages in this process are product, sales in percentage, finance, business, marketing.
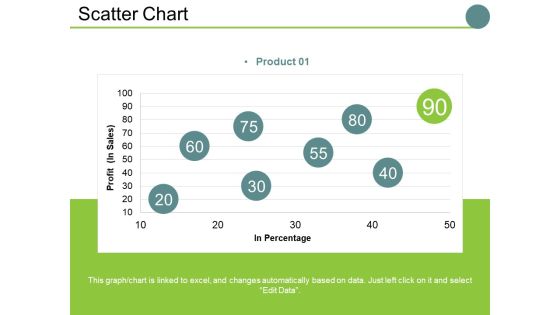
Scatter Chart Ppt PowerPoint Presentation Slides Examples
This is a scatter chart ppt powerpoint presentation slides examples. This is a one stage process. The stages in this process are profit , in percentage, business, marketing, finance, graph.

Area Chart Ppt PowerPoint Presentation Professional Brochure
This is a area chart ppt powerpoint presentation professional brochure. This is a two stage process. The stages in this process are sales in percentage, business, marketing, finance, graph.

Area Chart Ppt PowerPoint Presentation Summary Show
This is a area chart ppt powerpoint presentation summary show. This is a two stage process. The stages in this process are sales in percentage, financial year, business, marketing, finance.

Area Chart Ppt PowerPoint Presentation File Visuals
This is a area chart ppt powerpoint presentation file visuals. This is a two stage process. The stages in this process are business, sales in percentage, marketing, graph, strategy, finance.

Line Chart Ppt PowerPoint Presentation Professional Portfolio
This is a line chart ppt powerpoint presentation professional portfolio. This is a two stage process. The stages in this process are business, marketing, profit, percentage, graph, strategy, finance.
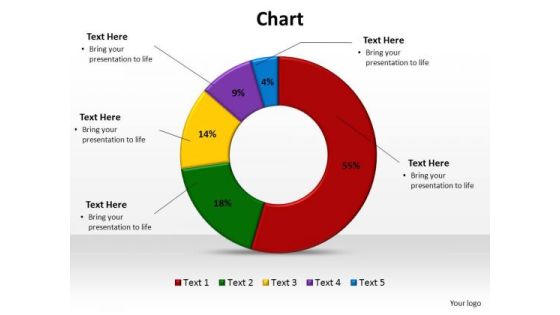
PowerPoint Layouts Image Chart Ppt Design
PowerPoint Layouts Image Chart PPT Design-The Circle of Life - a concept emmbedded in our minds and hence easy to comprehend. Life and Business is made up of processes comprising stages that flow from one to another. An excellent graphic to attract the attention of and understanding by your audience to improve earnings.
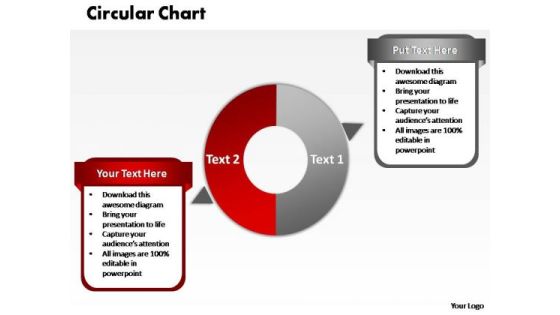
PowerPoint Slide Image Circular Chart Ppt Presentation
PowerPoint Slide Image Circular Chart PPT Presentation-The Circle of Life - a concept emmbedded in our minds and hence easy to comprehend. Life and Business is made up of processes comprising stages that flow from one to another. An excellent graphic to attract the attention of and understanding by your audience to improve earnings.

Column Chart Ppt PowerPoint Presentation Icon Guide
This is a column chart ppt powerpoint presentation icon guide. This is a two stage process. The stages in this process are business, year, sales in percentage, marketing, graph.

Area Chart Ppt PowerPoint Presentation Icon Aids
This is a area chart ppt powerpoint presentation icon aids. This is a three stage process. The stages in this process are financial years, sales in percentage, business, marketing, graph.

Company Product Sales Forecast Chart Topics PDF
Deliver and pitch your topic in the best possible manner with this company product sales forecast chart topics pdf. Use them to share invaluable insights on company product sales forecast chart and impress your audience. This template can be altered and modified as per your expectations. So, grab it now.

Area Chart Ppt Powerpoint Presentation File Show
This is a area chart ppt powerpoint presentation file show. This is a two stage process. The stages in this process are sales in percentage, financial year, product, financial, business.

Area Chart Ppt PowerPoint Presentation Layouts Maker
This is a area chart ppt powerpoint presentation layouts maker. This is a two stage process. The stages in this process are financial year, sales in percentage, graph, business, marketing.

Column Chart Ppt PowerPoint Presentation Slides Smartart
This is a column chart ppt powerpoint presentation slides smartart. This is a two stage process. The stages in this process are sales in percentage, financial year in, business, growth, strategy.

Combo Chart Ppt PowerPoint Presentation Guide
This is a combo chart ppt powerpoint presentation guide. This is a three stage process. The stages in this process are market size, growth rate, business, growth, graph, strategy.
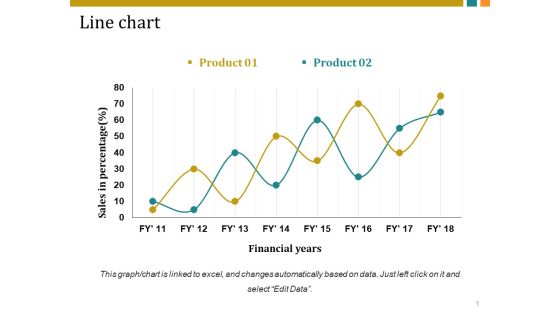
Line Chart Ppt PowerPoint Presentation Inspiration Vector
This is a line chart ppt powerpoint presentation inspiration vector. This is a two stage process. The stages in this process are sales in percentage, financial years, business, marketing, growth.

area chart ppt powerpoint presentation professional elements
This is a area chart ppt powerpoint presentation professional elements. This is a two stage process. The stages in this process are financial year sales in percentage, business, marketing, graph.

Area Chart Ppt PowerPoint Presentation Summary Information
This is a area chart ppt powerpoint presentation summary information. This is a two stage process. The stages in this process are business, sales in percentage, percentage, marketing, graph.

Area Chart Ppt PowerPoint Presentation Pictures Vector
This is a area chart ppt powerpoint presentation pictures vector. This is a two stage process. The stages in this process are sales in percentage, business, marketing, graph, percentage.

Line Chart Ppt PowerPoint Presentation Outline Ideas
This is a line chart ppt powerpoint presentation outline ideas. This is a two stage process. The stages in this process are business, marketing, financial years, sales in percentage, strategy.

Column Chart Ppt PowerPoint Presentation Show Structure
This is a column chart ppt powerpoint presentation show structure. This is a two stage process. The stages in this process are business, financial year in, sales in percentage, marketing, graph.

Area Chart Ppt PowerPoint Presentation Model Demonstration
This is a area chart ppt powerpoint presentation model demonstration. This is a two stage process. The stages in this process are business, marketing, financial year, in percentage, graph.

Control Chart Ppt PowerPoint Presentation Infographics Slide
This is a control chart ppt powerpoint presentation infographics slide. This is a two stage process. The stages in this process are normal variation due to chance, abnormal variation due to assignable sources, average range or quality.
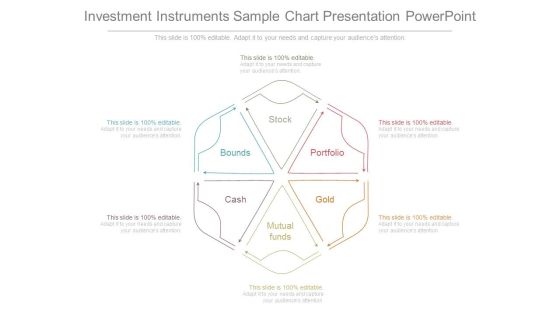
Investment Instruments Sample Chart Presentation Powerpoint
This is a investment instruments sample chart presentation powerpoint. This is a six stage process. The stages in this process are stock, portfolio, gold, mutual funds, cash, bounds.

Project Flow Chart Template Powerpoint Slide Background
This is a project flow chart template powerpoint slide background. This is a five stage process. The stages in this process are project flow chart, plan, control, develop, implement, project management, post construction follow up.
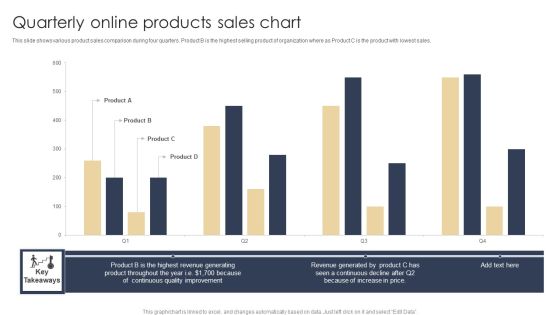
Quarterly Online Products Sales Chart Graphics PDF
This slide shows various product sales comparison during four quarters. Product B is the highest selling product of organization where as Product C is the product with lowest sales. Showcasing this set of slides titled Quarterly Online Products Sales Chart Graphics PDF. The topics addressed in these templates are Revenue Generated, Increase In Price, Quality. All the content presented in this PPT design is completely editable. Download it and make adjustments in color, background, font etc. as per your unique business setting.

Economic Order Quantity Chart Ppt Example File
This is a economic order quantity chart ppt example file. This is a four stage process. The stages in this process are inventory cost, ordering, carrying, eoq model.

Cost Benefit Assessment Arrow Chart Presentation Outline
This is a cost benefit assessment arrow chart presentation outline. This is a two stage process. The stages in this process are compare, arrows, finance, money, strategy.

Line Chart Ppt PowerPoint Presentation Professional Smartart
This is a line chart ppt powerpoint presentation professional smartart. This is a two stage process. The stages in this process are in percentage, in years, product, finance, business.

Combo Chart Ppt PowerPoint Presentation Styles Good
This is a combo chart ppt powerpoint presentation styles good. This is a eight stage process. The stages in this process are market size, growth rate, product, growth, strategy, graph, finance.

Combo Chart Ppt PowerPoint Presentation Gallery Sample
This is a combo chart ppt powerpoint presentation gallery sample. This is a three stage process. The stages in this process are market size, product, growth rate, bar, graph.
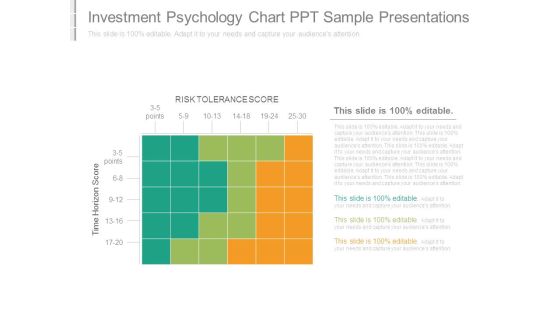
Investment Psychology Chart Ppt Sample Presentations
This is a investment psychology chart ppt sample presentations. This is a three stage process. The stages in this process are risk tolerance score, time horizon score.
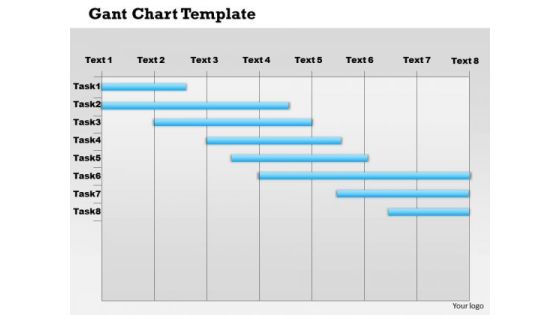
Business Framework Gantt Chart PowerPoint Presentation
A Gantt chart is a type of bar chart, that illustrates a project schedule. Gantt charts illustrate the start and finish dates of the terminal elements and summary elements of a project. Terminal elements and summary elements comprise the work breakdown structure of the project. Use this image slide to depict project management in your presentations.

Area Chart Ppt PowerPoint Presentation Slides Deck
This is a area chart ppt powerpoint presentation slides deck. This is a two stage process. The stages in this process are financial, sales in percentage, business, marketing, management.
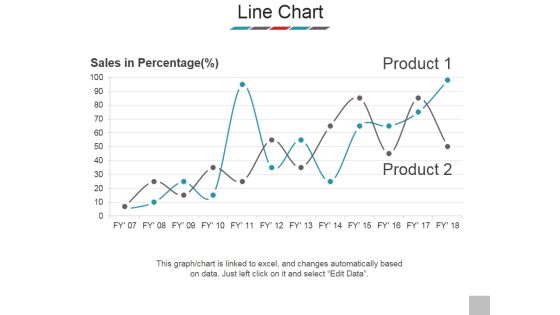
Line Chart Ppt PowerPoint Presentation Outline Samples
This is a line chart ppt powerpoint presentation outline samples. This is a two stage process. The stages in this process are sales in percentage, product, business, marketing, success.

Bar Chart Ppt PowerPoint Presentation Layouts Visuals
This is a bar chart ppt powerpoint presentation layouts visuals. This is a two stage process. The stages in this process are business, strategy, marketing, planning, chart and graph.
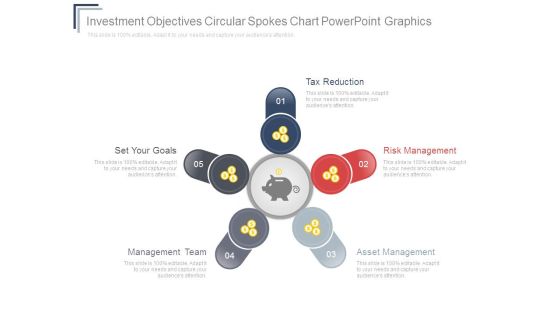
Investment Objectives Circular Spokes Chart Powerpoint Graphics
This is a investment objectives circular spokes chart powerpoint graphics. This is a five stage process. The stages in this process are tax reduction, set your goals, management team, asset management, risk management.

Bar Chart Ppt PowerPoint Presentation Icon Diagrams
This is a bar chart ppt powerpoint presentation icon diagrams. This is a two stage process. The stages in this process are bar chart, finance, analysis, business, marketing, strategy.

Combo Chart Ppt PowerPoint Presentation Portfolio Themes
This is a combo chart ppt powerpoint presentation portfolio themes. This is a three stage process. The stages in this process are market size, product, management, finance, chart, marketing.

Bubble Chart Ppt PowerPoint Presentation Icon Slides
This is a bubble chart ppt powerpoint presentation icon slides. This is a three stage process. The stages in this process are product, finance, business, marketing, bubble chart .

Area Chart Ppt PowerPoint Presentation Slides Example
This is a area chart ppt powerpoint presentation slides example. This is a two stage process. The stages in this process are sales in percentage, product, area chart, business, finance.

Bar Chart Ppt PowerPoint Presentation Inspiration Demonstration
This is a bar chart ppt powerpoint presentation inspiration demonstration. This is a two stage process. The stages in this process are bar chart, financial years, sales in percentage, product, finance.

Scatter Bubble Chart Ppt PowerPoint Presentation Backgrounds
This is a scatter bubble chart ppt powerpoint presentation backgrounds. This is a one stage process. The stages in this process are bubble chart, finance, marketing, analysis, strategy, business.

Combo Chart Ppt PowerPoint Presentation Ideas Outfit
This is a combo chart ppt powerpoint presentation ideas outfit. This is a four stage process. The stages in this process are combo chart, finance, analysis, marketing, strategy, business.

Area Chart Ppt PowerPoint Presentation Model Influencers
This is a area chart ppt powerpoint presentation model influencers. This is a two stage process. The stages in this process are sales in percentage, chart, business, marketing, finance.
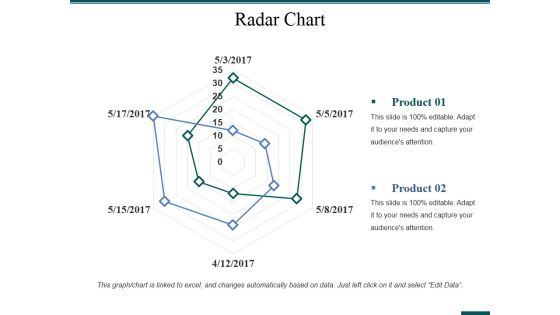
Radar Chart Ppt PowerPoint Presentation Layouts Gallery
This is a radar chart ppt powerpoint presentation layouts gallery. This is a two stage process. The stages in this process are business, analysis, strategy, marketing, radar chart, finance.
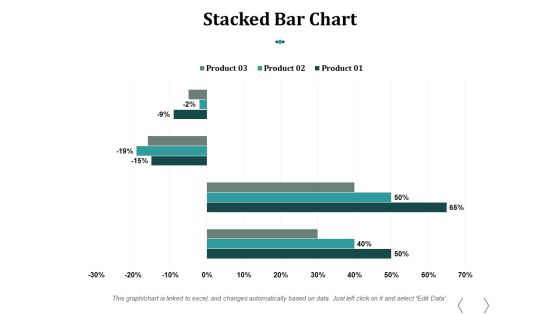
Stacked Bar Chart Ppt PowerPoint Presentation Influencers
This is a stacked bar chart ppt powerpoint presentation influencers. This is a three stage process. The stages in this process are stacked bar chart, product, percentage, finance, business.

Area Chart Ppt PowerPoint Presentation Inspiration Display
This is a area chart ppt powerpoint presentation inspiration display. This is a two stage process. The stages in this process are area chart, finance, growth, success, strategy, business.
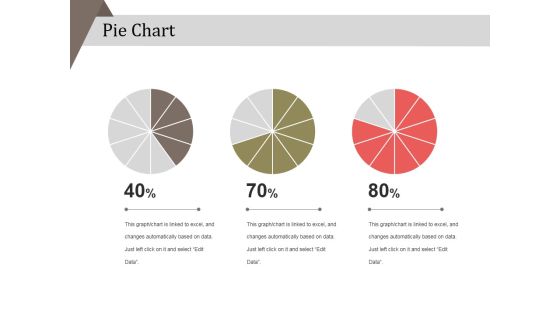
Pie Chart Ppt PowerPoint Presentation Layouts Example
This is a pie chart ppt powerpoint presentation layouts example. This is a three stage process. The stages in this process are business, strategy, analysis, pie chart, finance, marketing.

Chart For Financial Percentage Analysis Powerpoint Slides
This PowerPoint template has been designed with financial chart with dollar icon. This PPT slide may be used to display dollar value analysis chart. Download this slide to build unique presentation.

Line Chart Ppt PowerPoint Presentation Gallery Rules
This is a line chart ppt powerpoint presentation gallery rules. This is a two stage process. The stages in this process are financial years, product, sales in percentage, line chart, growth.

Bar Chart Ppt PowerPoint Presentation Model Picture
This is a bar chart ppt powerpoint presentation model picture. This is a two stage process. The stages in this process are product, sales in percentage, financial years, bar chart.

Line Chart Ppt PowerPoint Presentation Infographics Infographics
This is a line chart ppt powerpoint presentation infographics infographics. This is a two stage process. The stages in this process are product, sales in percentage, financial year, line chart, finance.

Scatter Chart Ppt PowerPoint Presentation Model Influencers
This is a scatter chart ppt powerpoint presentation model influencers. This is a one stage process. The stages in this process are scatter chart, analysis, finance, marketing, business, growth.

Pie Chart Ppt PowerPoint Presentation Infographics Show
This is a pie chart ppt powerpoint presentation infographics show. This is a three stage process. The stages in this process are process, percentage, business, marketing, success, pie chart.
Project Management Resource Allocation Chart Ppt Icon
This is a project management resource allocation chart ppt icon. This is a five stage process. The stages in this process are team, table, business, management, format, diagram.

Pie Chart Finance Ppt Powerpoint Presentation Introduction
This is a pie chart finance ppt powerpoint presentation introduction. This is a three stage process. The stages in this process are finance, marketing, analysis, investment, strategy.
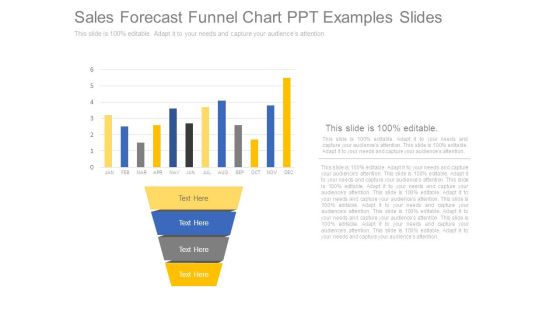
Sales Forecast Funnel Chart Ppt Examples Slides
This is a sales forecast funnel chart ppt examples slides. This is a four stage process. The stages in this process are jan, feb, mar, apr, may, jun, jul, aug, sep, oct, nov, dec.

Company Product Sales Forecast Chart Icons PDF
This slide shows the Product sales forecast table with Product names along with price per unit and total units sold for the current as well as the projected period till the year 2023. Deliver an awe inspiring pitch with this creative company product sales forecast chart icons pdf bundle. Topics like company product sales forecast chart can be discussed with this completely editable template. It is available for immediate download depending on the needs and requirements of the user.

Company Product Sales Forecast Chart Download PDF
This slide shows the Product sales forecast table with Product names along with price per unit and total units sold for the current as well as the projected period till the year 2023. Deliver an awe inspiring pitch with this creative company product sales forecast chart download pdf bundle. Topics like company product sales forecast chart can be discussed with this completely editable template. It is available for immediate download depending on the needs and requirements of the user.

Resource Capacity Planning Percentage Chart Ppt Slides
This is a resource capacity planning percentage chart ppt slides. This is a four stage process. The stages in this process are business, finance, marketing.
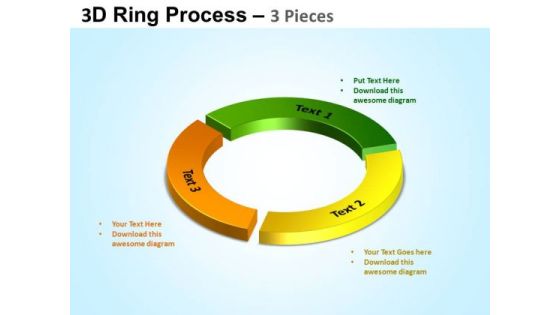
PowerPoint Themes Chart Ring Process Ppt Theme
PowerPoint Themes Chart ring process PPT Theme-The Circle of Life - a concept emmbedded in our minds and hence easy to comprehend. Life and Business is made up of processes comprising stages that flow from one to another. An excellent graphic to attract the attention of and understanding by your audience to improve earnings.-These amazing PowerPoint pre-designed slides and PowerPoint templates have been carefully created by our team of experts to help you impress your audience. Our stunning collection of Powerpoint slides are 100% editable and can easily fit in any PowerPoint presentations. By using these animations and graphics in PowerPoint and you can easily make professional presentations. Any text can be entered at any point in the PowerPoint template or slide. Just DOWNLOAD our awesome PowerPoint templates and you are ready to go.
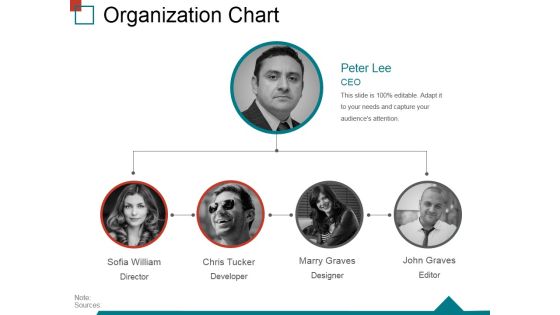
Organization Chart Ppt PowerPoint Presentation Inspiration Guide
This is a organization chart ppt powerpoint presentation inspiration guide. This is a four stage process. The stages in this process are director, developer, designer, editor.
Marketing Plan Procedural Flow Chart Icons PDF
This slide showcases the marketing process flow to provide stand-alone value for customers and prospects with the long-term objective of proving the worth of the product. It also includes campaign goals, analyzing, forecasting efforts, target market, comparing results, etc. Presenting Marketing Plan Procedural Flow Chart Icons PDF to dispense important information. This template comprises one stages. It also presents valuable insights into the topics including Analyze Markets, Realistic Goal, Update Needed. This is a completely customizable PowerPoint theme that can be put to use immediately. So, download it and address the topic impactfully.
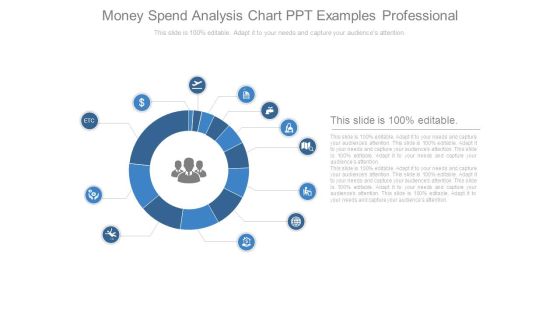
Money Spend Analysis Chart Ppt Examples Professional
This is a money spend analysis chart ppt examples professional. This is a twelve stage process. The stages in this process are marketing, business, icon, process, management.

Money Expenditure Analysis Chart Ppt Background Graphics
This is a money expenditure analysis chart ppt background graphics. This is a twelve stage process. The stages in this process are icons, strategy, business, marketing, presentation.
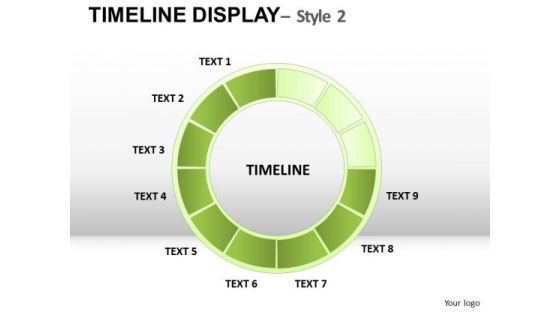
Circle Timeline Project Management Chart Ppt Slides
Circle Timeline Project Management chart PPT SlidesThese high quality powerpoint pre-designed slides and powerpoint templates have been carefully created by our professional team to help you impress your audience. All slides have been created and are 100% editable in powerpoint. Each and every property of any graphic - color, size, orientation, shading, outline etc. can be modified to help you build an effective powerpoint presentation. Any text can be entered at any point in the powerpoint template or slide. Simply DOWNLOAD, TYPE and PRESENT!

Cost Benefit Analysis Infographic Chart Powerpoint Themes
This is a cost benefit analysis infographic chart powerpoint themes. This is a two stage process. The stages in this process are balance, icons, finance, strategy, business.

Hierarchy Chart Ppt PowerPoint Presentation Infographics Themes
This is a hierarchy chart ppt powerpoint presentation infographics themes. This is a three stage process. The stages in this process are manager, engineer, marketing, editor.
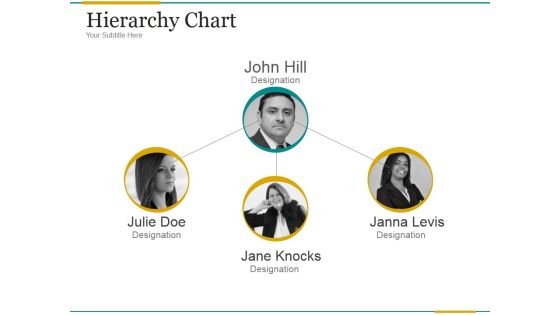
Hierarchy Chart Ppt PowerPoint Presentation Visuals
This is a hierarchy chart ppt powerpoint presentation visuals. This is a three stage process. The stages in this process are designation, business, marketing, human, success.
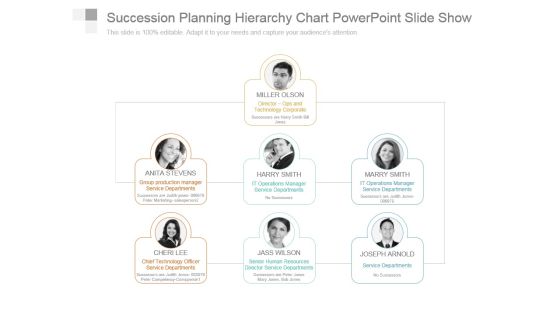
Succession Planning Hierarchy Chart Powerpoint Slide Show
This is a succession planning hierarchy chart powerpoint slide show. This is a three stage process. The stages in this process are miller olson director ops and technology corporate, anita stevens group production manager service departments, harry smith it operations manager service departments, marry smith it operations manager service departments, cheri lee chief technology officer service departments, jass wilson senior human resources director service departments, joseph arnold service departments.

Area Chart Ppt PowerPoint Presentation Gallery Diagrams
This is a area chart ppt powerpoint presentation gallery diagrams. This is a two stage process. The stages in this process are finance, marketing, management, investment, analysis.

Area Chart Ppt PowerPoint Presentation Summary Icon
This is a area chart ppt powerpoint presentation summary icon. This is a two stage process. The stages in this process are finance, marketing, management, investment, analysis.

Clustered Chart Ppt PowerPoint Presentation Inspiration Templates
This is a clustered chart ppt powerpoint presentation inspiration templates. This is a three stage process. The stages in this process are finance, marketing, management, investment, analysis.

Area Chart Ppt PowerPoint Presentation Summary Model
This is a area chart ppt powerpoint presentation summary model. This is a two stage process. The stages in this process are analysis, finance, marketing, management, investment.

Column Chart Ppt PowerPoint Presentation Layouts Rules
This is a column chart ppt powerpoint presentation layouts rules. This is a two stage process. The stages in this process are analysis, finance, marketing, management, investment.
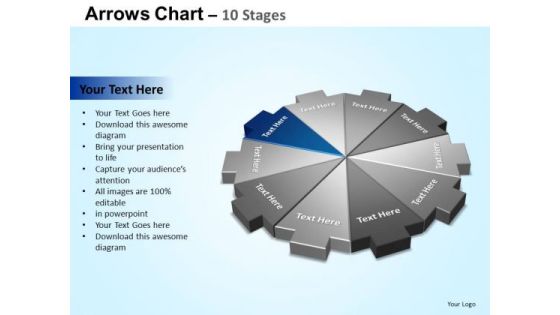
PowerPoint Process Company Arrows Chart Ppt Backgrounds
PowerPoint Process Company Arrows Chart PPT Backgrounds Power Point templates--These amazing PowerPoint pre-designed slides and PowerPoint templates have been carefully created by our team of experts to help you impress your audience. Our stunning collection of Powerpoint slides are 100% editable and can easily fit in any PowerPoint presentations. By using these animations and graphics in PowerPoint and you can easily make professional presentations. Any text can be entered at any point in the PowerPoint template or slide. Just DOWNLOAD our awesome PowerPoint templates and you are ready to go.

PowerPoint Process Company Arrows Chart Ppt Design
PowerPoint Process Company Arrows Chart PPT Design Power Point templates--These amazing PowerPoint pre-designed slides and PowerPoint templates have been carefully created by our team of experts to help you impress your audience. Our stunning collection of Powerpoint slides are 100% editable and can easily fit in any PowerPoint presentations. By using these animations and graphics in PowerPoint and you can easily make professional presentations. Any text can be entered at any point in the PowerPoint template or slide. Just DOWNLOAD our awesome PowerPoint templates and you are ready to go.

PowerPoint Designs Sales Process Chart Ppt Presentation
PowerPoint Designs Sales process chart PPT Presentation-These amazing PowerPoint pre-designed slides and PowerPoint templates have been carefully created by our team of experts to help you impress your audience. Our stunning collection of Powerpoint slides are 100% editable and can easily fit in any PowerPoint presentations. By using these animations and graphics in PowerPoint and you can easily make professional presentations. Any text can be entered at any point in the PowerPoint template or slide. Just DOWNLOAD our awesome PowerPoint templates and you are ready to go.

Column Chart Ppt PowerPoint Presentation Slides Format
This is a column chart ppt powerpoint presentation slides format. This is a two stage process. The stages in this process are finance, marketing, management, investment, analysis.
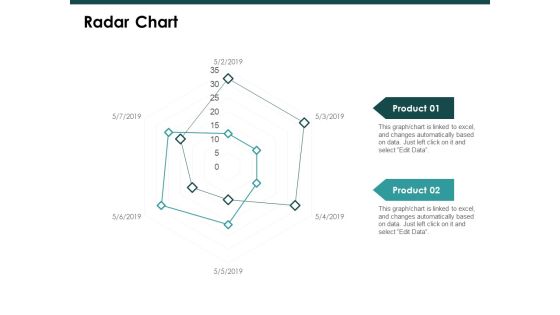
Radar Chart Graph Ppt PowerPoint Presentation Slide
This is a radar chart graph ppt powerpoint presentation slide. This is a two stage process. The stages in this process are finance, marketing, management, investment, analysis.
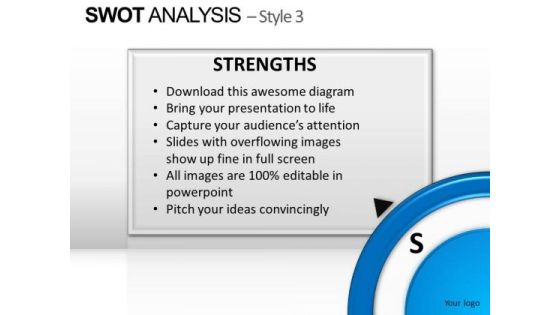
PowerPoint Backgrounds Chart Swot Analysis Ppt Layout
PowerPoint Backgrounds Chart SWOT Analysis PPT Layout.pptx-These high quality powerpoint pre-designed slides and powerpoint templates have been carefully created by our professional team to help you impress your audience. All slides have been created and are 100% editable in powerpoint. Each and every property of any graphic - color, size, orientation, shading, outline etc. can be modified to help you build an effective powerpoint presentation. Any text can be entered at any point in the powerpoint template or slide. Simply DOWNLOAD, TYPE and PRESENT!
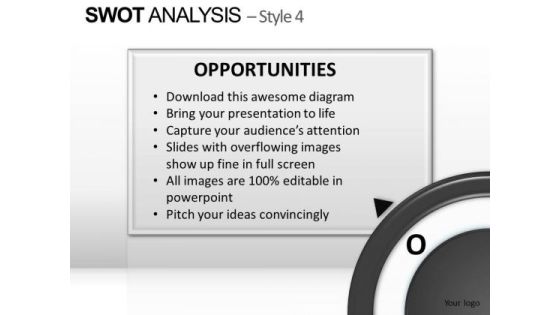
PowerPoint Layout Chart Swot Analysis Ppt Design
PowerPoint Layout Chart SWOT Analysis PPT Design.pptx-These high quality powerpoint pre-designed slides and powerpoint templates have been carefully created by our professional team to help you impress your audience. All slides have been created and are 100% editable in powerpoint. Each and every property of any graphic - color, size, orientation, shading, outline etc. can be modified to help you build an effective powerpoint presentation. Any text can be entered at any point in the powerpoint template or slide. Simply DOWNLOAD, TYPE and PRESENT!

Innovation Finance Networks Chart Ppt Sample
This is a innovation finance networks chart ppt sample. This is a four stage process. The stages in this process are equality, crowdsourcing, construction, medical device.

Column Chart Ppt PowerPoint Presentation Portfolio Inspiration
This is a column chart ppt powerpoint presentation portfolio inspiration. This is a two stage process. The stages in this process are finance, marketing, management, investment, analysis.

Cost Structure Analysis Chart Ppt Slides Download
This is a cost structure analysis chart ppt slides download. This is a three stage process. The stages in this process are cost analysis, benefit, cost tracking.
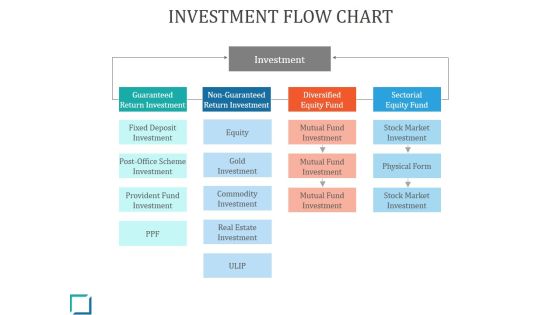
Investment Flow Chart Ppt PowerPoint Presentation Themes
This is a investment flow chart ppt powerpoint presentation themes. This is a five stage process. The stages in this process are investment, equity, gold investment, physical form, provident fund investment.

Website Development Procedural Flow Chart Download PDF
This slide showcases website development process flow and demonstrates steps to be taken from start to finish to complete a typical web design project. It also includes various services, technologies, contacting sources, portfolios, products, etc. Persuade your audience using this Website Development Procedural Flow Chart Download PDF. This PPT design covers one stages, thus making it a great tool to use. It also caters to a variety of topics including Research, Client Training, Website Launch. Download this PPT design now to present a convincing pitch that not only emphasizes the topic but also showcases your presentation skills.

Financial Investments Pie Chart Design Powerpoint Show
This is a financial investments pie chart design powerpoint show. This is a eight stage process. The stages in this process are stocks, real estate, mutual funds, precious metal, bonds, art, collectibles, antiques.
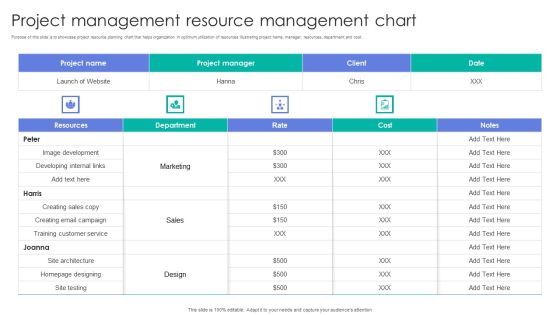
Project Management Resource Management Chart Slides PDF
Purpose of this slide is to showcase project resource planning chart that helps organization in optimum utilization of resources illustrating project name, manager, resources, department and cost. Purpose of this slide is to showcase project resource planning chart that helps organization in optimum utilization of resources illustrating project name, manager, resources, department and cost. Pitch your topic with ease and precision using this Project Management Resource Management Chart Slides PDF. This layout presents information on Training Customer Service, Developing Internal Links, Sales. It is also available for immediate download and adjustment. So, changes can be made in the color, design, graphics or any other component to create a unique layout.

Project Construction Schedule Chart Powerpoint Slide Backgrounds
This is a project construction schedule chart powerpoint slide backgrounds. This is a five stage process. The stages in this process are approach, inventory, analysis, construction, concepts.
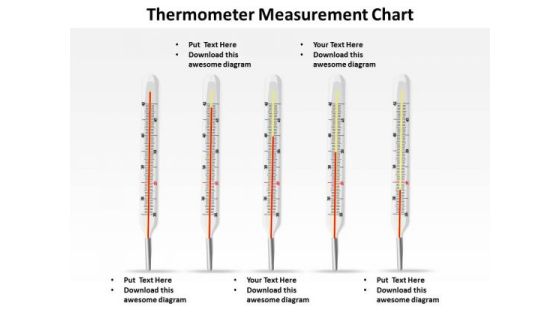
Sales Diagram Thermometer Measurement Chart Marketing Diagram
Your Grasp Of Economics Is Well Known. Help Your Audience Comprehend Issues With Our Sales Diagram Thermometer Measurement Chart Marketing Diagram Powerpoint Templates.
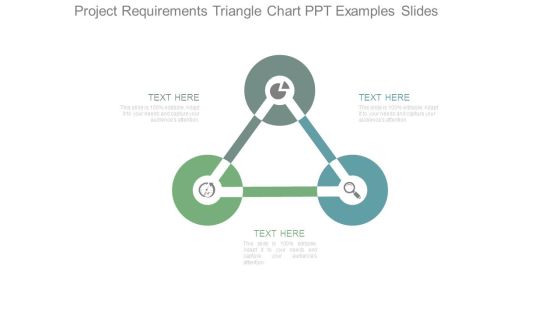
Project Requirements Triangle Chart Ppt Examples Slides
This is a project requirements triangle chart ppt examples slides. This is a three stage process. The stages in this process are triangle, business, marketing, management, icons, diagram.

Project Description Infographic Chart Powerpoint Templates
This is a project description infographic chart powerpoint templates. This is a three stage process. The stages in this process are icons, strategy, business, marketing, triangle.
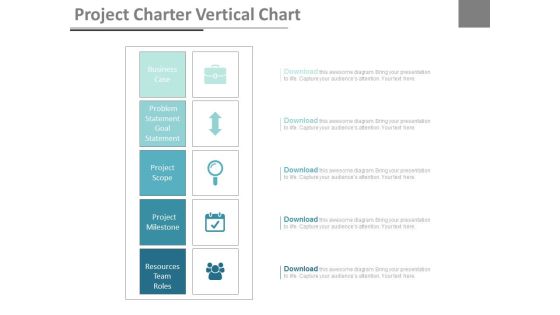
Project Charter Vertical Chart Ppt Slides
This is a project charter vertical chart ppt slides. This is a five stage process. The stages in this process are marketing, business, success.\n\n

Bar Chart Ppt PowerPoint Presentation Slides Shapes
This is a bar chart ppt powerpoint presentation slides shapes. This is a seven stage process. The stages in this process are bar graph, finance, marketing, strategy, analysis.

Business Economic Cycle Chart Ppt Templates
This is a business economic cycle chart ppt templates. This is a four stage process. The stages in this process are economic prosperity, falling prices, economic depression, rising prices.

Pareto Chart Ppt PowerPoint Presentation Ideas
This is a pareto chart ppt powerpoint presentation ideas. This is a four stage process. The stages in this process are bar graph, finance, marketing, strategy, analysis, business.

Economic Development Administration Organization Chart Ppt Slides
This is a economic development administration organization chart ppt slides. This is a five stage process. The stages in this process are economic development, business assistance center, business development, enterprise zone, district organizing.
Operating Expenses Analysis Pie Chart Ppt Icon
This is a operating expenses analysis pie chart ppt icon. This is a seven stage process. The stages in this process are finance, success, business, marketing, percentage.
Line Chart Ppt PowerPoint Presentation Icon Deck
This is a line chart ppt powerpoint presentation icon deck. This is a two stage process. The stages in this process are business, management, growth, product, finance.
Pie Chart Ppt PowerPoint Presentation Layouts Icons
This is a pie chart ppt powerpoint presentation layouts icons. This is a three stage process. The stages in this process are business, finance, analysis, marketing, strategy.
Radar Chart Ppt PowerPoint Presentation Icon Guide
This is a radar chart ppt powerpoint presentation icon guide. This is a three stage process. The stages in this process are business, finance, management, strategy, planning.

Mutual Fund Flow Chart Ppt Presentation
This is a mutual fund flow chart ppt presentation. This is a four stage process. The stages in this process are passed back to, generates, pool their money with, invest in, returns, securities, fund manager, investors.
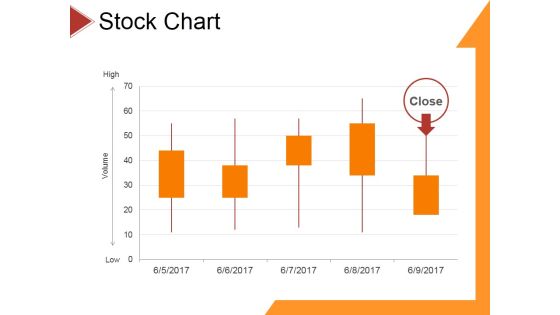
Stock Chart Ppt PowerPoint Presentation File Ideas
This is a stock chart ppt powerpoint presentation file ideas. This is a five stage process. The stages in this process are business, strategy, analysis, pretention, finance.

Column Chart Ppt PowerPoint Presentation Show Shapes
This is a column chart ppt powerpoint presentation show shapes. This is a two stage process. The stages in this process are sales, product, business, management, finance.
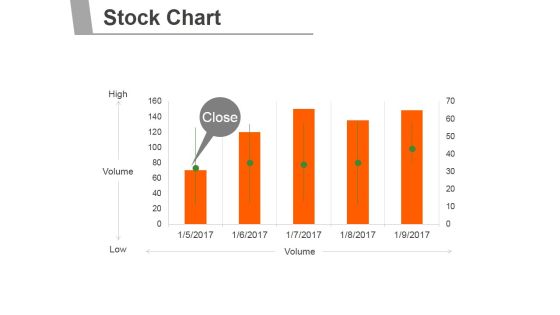
Stock Chart Ppt PowerPoint Presentation Design Templates
This is a stock chart ppt powerpoint presentation design templates. This is a five stage process. The stages in this process are business, marketing, finance, planning, management.

Donut Chart Ppt PowerPoint Presentation Summary
This is a donut chart ppt powerpoint presentation summary. This is a six stage process. The stages in this process are business, marketing, finance, process, planning.
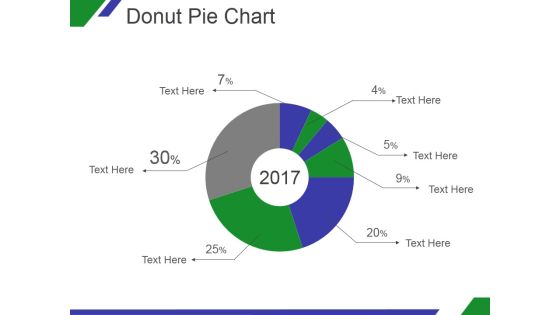
Donut Pie Chart Ppt PowerPoint Presentation Styles
This is a donut pie chart ppt powerpoint presentation styles. This is a seven stage process. The stages in this process are year, donut, finance, planning.

Pie Chart Ppt PowerPoint Presentation Infographics Aids
This is a pie chart ppt powerpoint presentation infographics aids. This is a three stage process. The stages in this process are business, finance, management, strategy, planning.

Line Chart Ppt PowerPoint Presentation Portfolio Inspiration
This is a line chart ppt powerpoint presentation portfolio inspiration. This is a two stage process. The stages in this process are business, marketing, strategy, planning, finance.
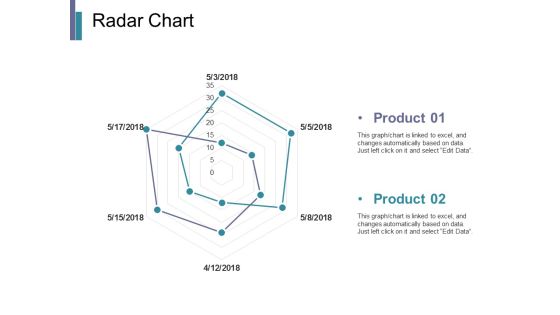
Radar Chart Ppt PowerPoint Presentation Infographics Pictures
This is a radar chart ppt powerpoint presentation infographics pictures. This is a two stage process. The stages in this process are business, marketing, strategy, planning, finance.

Bubble Chart Ppt PowerPoint Presentation Portfolio Show
This is a bubble chart ppt powerpoint presentation portfolio show. This is a two stage process. The stages in this process are business, marketing, strategy, planning, finance.

Hiring Planning Process Chart Powerpoint Slide Show
This is a hiring planning process chart powerpoint slide show. This is a five stage process. The stages in this process are finance, support, product, marketing, sales, engineering.

Line Chart Ppt PowerPoint Presentation Summary Portfolio
This is a line chart ppt powerpoint presentation summary portfolio. This is a eight stage process. The stages in this process are finance, planning, management, business, process, strategy.
Donut Chart Ppt Powerpoint Presentation Layouts Icons
This is a donut chart ppt powerpoint presentation layouts icons. This is a six stage process. The stages in this process are finance, marketing, management, donut circle.
Scatter Chart Ppt PowerPoint Presentation Icon Visuals
This is a scatter chart ppt powerpoint presentation icon visuals. This is a nine stage process. The stages in this process are business, growth, finance, success, marketing.
Scatter Chart Ppt PowerPoint Presentation Icon Mockup
This is a scatter chart ppt powerpoint presentation icon mockup. This is a nine stage process. The stages in this process are product, in percentage, dollars, percentage, finance.
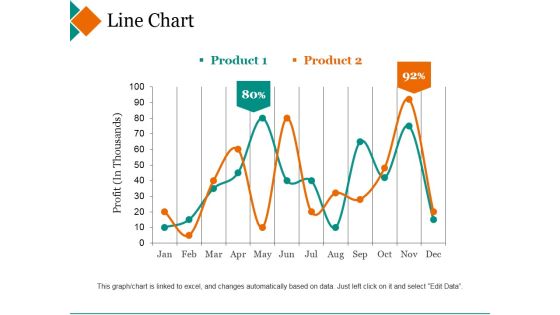
Line Chart Ppt PowerPoint Presentation Inspiration Deck
This is a line chart ppt powerpoint presentation inspiration deck. This is a two stage process. The stages in this process are product, profit, percentage, finance, line graph.

Radar Chart Ppt PowerPoint Presentation Infographics Portfolio
This is a radar chart ppt powerpoint presentation infographics portfolio. This is a two stage process. The stages in this process are product, finance, shapes, business, marketing.
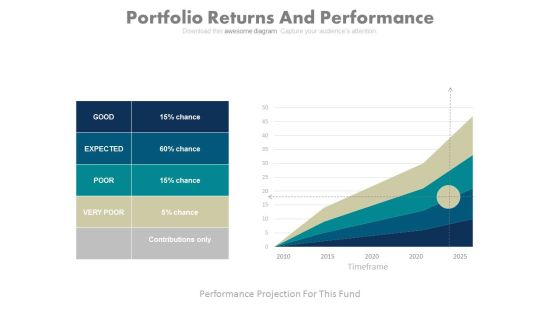
Portfolio Returns And Performance Chart Ppt Slides
This is a portfolio returns and performance chart ppt slides. This is a five stage process. The stages in this process are business, finance, marketing.

 Home
Home