Barometer Kpi
Employee Talent Management Procedure Tracking Dashboard With Kpis Download PDF
This slide represents dashboard of the human resource department for tracking the performance and management of organizations workforce. It includes details related to monthly new hires, total active employees, suite people metrics along with key performance indicators. Showcasing this set of slides titled Employee Talent Management Procedure Tracking Dashboard With Kpis Download PDF. The topics addressed in these templates are Total Active Employees, Employees, Suite People Metrics. All the content presented in this PPT design is completely editable. Download it and make adjustments in color, background, font etc. as per your unique business setting.
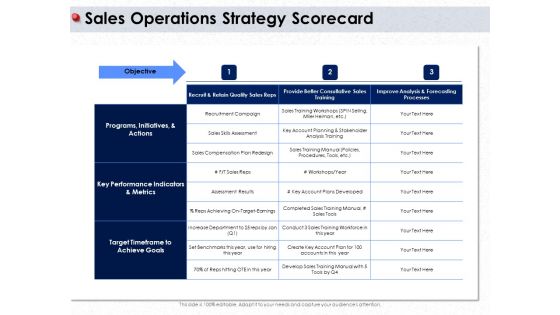
Ways To Design Impactful Trading Solution Sales Operations Strategy Scorecard Ppt PowerPoint Presentation Show Slide Portrait PDF
Presenting this set of slides with name ways to design impactful trading solution sales operations strategy scorecard ppt powerpoint presentation show slide portrait pdf. The topics discussed in these slides are programs, initiatives, and actions, key performance indicators and metrics, target timeframe to achieve goals, sales compensation plan redesign, sales skills assessment. This is a completely editable PowerPoint presentation and is available for immediate download. Download now and impress your audience.

User Onboarding Process Development Key Objectives Set By The Company Download PDF
This slide provides the major objectives set by the company to measure the teams performance. Key KPIs key performance Indicators covered in the slide are number of customers, customer churn rate, customer retention rate etc. Deliver and pitch your topic in the best possible manner with this User Onboarding Process Development Key Objectives Set By The Company Download PDF. Use them to share invaluable insights on customer churn rate, customer retention rate, target and impress your audience. This template can be altered and modified as per your expectations. So, grab it now.
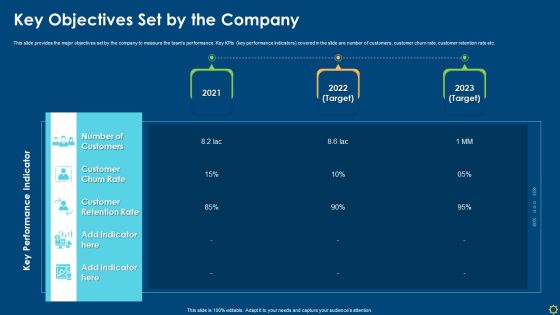
Improving Organizational Process Client Induction Procedure Key Objectives Set By The Company Mockup PDF
This slide provides the major objectives set by the company to measure the teams performance. Key KPIs key performance Indicators covered in the slide are number of customers, customer churn rate, customer retention rate etc. Deliver an awe inspiring pitch with this creative improving organizational process client induction procedure key objectives set by the company mockup pdf bundle. Topics like customer retention rate, customer churn rate, target can be discussed with this completely editable template. It is available for immediate download depending on the needs and requirements of the user.
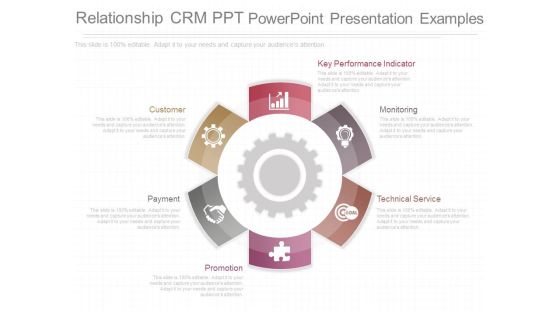
Relationship Crm Ppt Powerpoint Presentation Examples
This is a relationship crm ppt powerpoint presentation examples. This is a six stage process. The stages in this process are customer, payment, promotion, technical service, monitoring, key performance indicator.

Capital Markets Dashboard Ppt Powerpoint Slide Background
This is a capital markets dashboard ppt powerpoint slide background. This is a three stage process. The stages in this process are weekly sales, product inventory, key performance indicators.
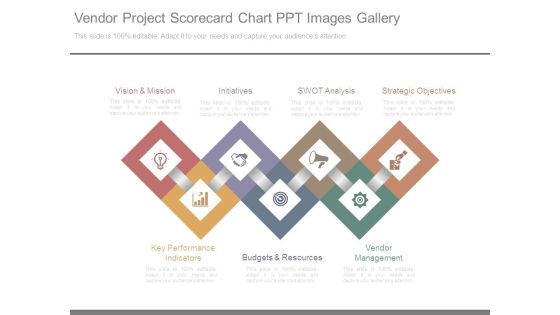
Vendor Project Scorecard Chart Ppt Images Gallery
This is a vendor project scorecard chart ppt images gallery. This is a seven stage process. The stages in this process are vision and mission, initiatives, swot analysis, strategic objectives, vendor management, budgets and resources, key performance indicators.
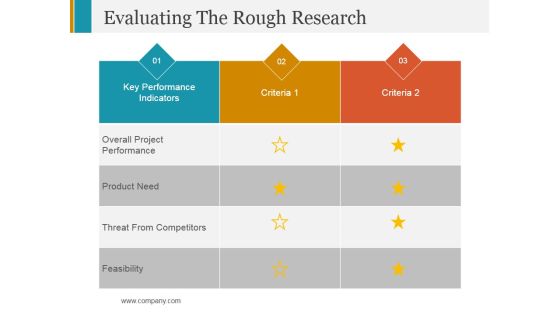
Evaluating The Rough Research Ppt PowerPoint Presentation Ideas Clipart Images
This is a evaluating the rough research ppt powerpoint presentation ideas clipart images. This is a two stage process. The stages in this process are key performance indicators, criteria, feasibility.

Customer Satisfaction Template 1 Ppt PowerPoint Presentation Infographics Outfit
This is a customer satisfaction template 1 ppt powerpoint presentation infographics outfit. This is a three stage process. The stages in this process are key performance indicators, overall satisfaction with service, satisfaction with value for money.

Customer Satisfaction Template 1 Ppt PowerPoint Presentation Ideas Tips
This is a customer satisfaction template 1 ppt powerpoint presentation ideas tips. This is a three stage process. The stages in this process are key performance indicators, overall satisfaction with service, satisfaction with value for money.

Customer Satisfaction Template 1 Ppt PowerPoint Presentation Pictures Gridlines
This is a customer satisfaction template 1 ppt powerpoint presentation pictures gridlines. This is a three stage process. The stages in this process are key performance indicators, business, management, strategy, dashboard.
Impact Of Customer Churn On Organization Performance Icons PDF
Mentioned slide outlines the impact of a higher attrition rate on the companys financial performance. It contains information about major financial key performance indicators KPIs such as monthly recurring revenue MRR, customer lifetime value CLV, and customer acquisition cost CAC. If you are looking for a format to display your unique thoughts, then the professionally designed Impact Of Customer Churn On Organization Performance Icons PDF is the one for you. You can use it as a Google Slides template or a PowerPoint template. Incorporate impressive visuals, symbols, images, and other charts. Modify or reorganize the text boxes as you desire. Experiment with shade schemes and font pairings. Alter, share or cooperate with other people on your work. Download Impact Of Customer Churn On Organization Performance Icons PDF and find out how to give a successful presentation. Present a perfect display to your team and make your presentation unforgettable.

Evaluating Projected Vs Actual Sales Performance Microsoft PDF
The following slide depicts the evaluation of existing sales performance to set future standards and determine opportunities for improvement. It mainly includes key performance indicators KPIs such as pipeline, forecast, attainment, gap etc. Get a simple yet stunning designed Evaluating Projected Vs Actual Sales Performance Microsoft PDF. It is the best one to establish the tone in your meetings. It is an excellent way to make your presentations highly effective. So, download this PPT today from Slidegeeks and see the positive impacts. Our easy to edit Evaluating Projected Vs Actual Sales Performance Microsoft PDF can be your go to option for all upcoming conferences and meetings. So, what are you waiting for Grab this template today.

Staff Retention Plan Employee Retention Dashboard Ppt Portfolio Show PDF
The following slide displays the Human Resource Dashboard, as it highlights the key performance indicators for HR department, these metrics can be Employee count by department, employee details etc. Deliver an awe inspiring pitch with this creative staff retention plan employee retention dashboard ppt portfolio show pdf bundle. Topics like employee retention dashboard can be discussed with this completely editable template. It is available for immediate download depending on the needs and requirements of the user.
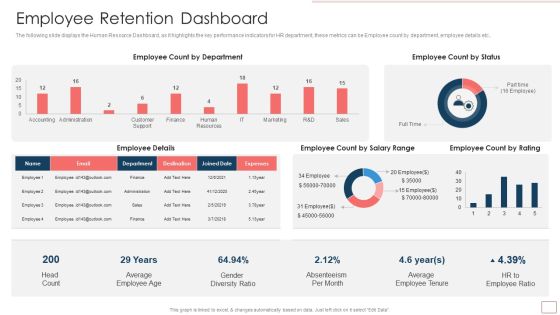
Strategic Human Resource Retention Management Employee Retention Dashboard Structure PDF
The following slide displays the Human Resource Dashboard, as it highlights the key performance indicators for HR department, these metrics can be Employee count by department, employee details etc.Deliver an awe inspiring pitch with this creative Strategic Human Resource Retention Management Employee Retention Dashboard Structure PDF bundle. Topics like Count By Department, Employee Count, Average Employee can be discussed with this completely editable template. It is available for immediate download depending on the needs and requirements of the user.
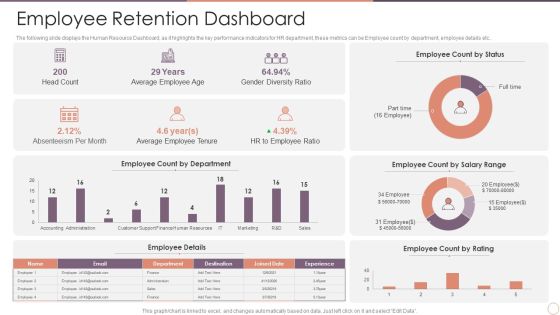
Managing Employee Turnover Employee Retention Dashboard Information PDF
The following slide displays the Human Resource Dashboard, as it highlights the key performance indicators for HR department, these metrics can be Employee count by department, employee details etc.Deliver and pitch your topic in the best possible manner with this Managing Employee Turnover Employee Retention Dashboard Information PDF. Use them to share invaluable insights on Employee Count, Gender Diversity, Average Employee and impress your audience. This template can be altered and modified as per your expectations. So, grab it now.

Various Kpis To Measure Effectiveness Of Risk Management Course Download PDF
The following slide exhibits multiple key performance indicator kpis metrics which can assist the real estate company to measure the effectiveness of online risk management course. The KPIs are risks identified, monitored, mitigated and cost incurred.Deliver and pitch your topic in the best possible manner with this . Use them to share invaluable insights on Risks Identified, Risks Monitored, Management Course and impress your audience. This template can be altered and modified as per your expectations. So, Vari it now.
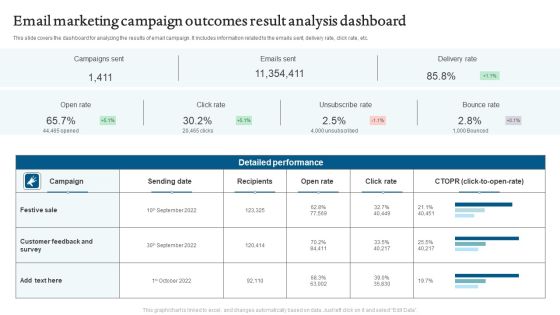
Email Marketing Campaign Outcomes Result Analysis Dashboard Mockup PDF
This slide covers the dashboard for analyzing the email campaign metrics. It includes information related to engagement a key performance indicator KPIs. Pitch your topic with ease and precision using this Email Marketing Campaign Outcomes Result Analysis Dashboard Mockup PDF. This layout presents information on Campaigns Sent, Emails Sent, Delivery Rate. It is also available for immediate download and adjustment. So, changes can be made in the color, design, graphics or any other component to create a unique layout.

IT Value Story Significant To Corporate Leadership Financial Fundamental Metrics Diagrams PDF
These indicators assist IT leaders in stewarding technology expenditures and investments, and they are essential to managing the IT company. These measures aid in the management of the departments financial health and may indicate levers for cost reduction, improved resource allocation, and enhanced accountability. Deliver and pitch your topic in the best possible manner with this it value story significant to corporate leadership financial fundamental metrics diagrams pdf. Use them to share invaluable insights on organizations, budget, metric, cost and impress your audience. This template can be altered and modified as per your expectations. So, grab it now.

Evaluating Projected Vs Actual Sales Performance Ppt Ideas Template PDF
The following slide depicts the evaluation of existing sales performance to set future standards and determine opportunities for improvement. It mainly includes key performance indicators KPIs such as pipeline, forecast, attainment, gap etc. The Evaluating Projected Vs Actual Sales Performance Ppt Ideas Template PDF is a compilation of the most recent design trends as a series of slides. It is suitable for any subject or industry presentation, containing attractive visuals and photo spots for businesses to clearly express their messages. This template contains a variety of slides for the user to input data, such as structures to contrast two elements, bullet points, and slides for written information. Slidegeeks is prepared to create an impression.
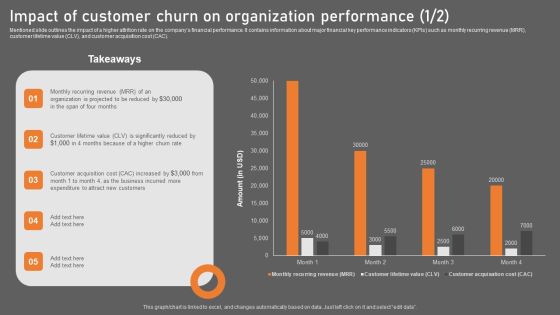
Impact Of Customer Churn On Organization Performance Background PDF
Mentioned slide outlines the impact of a higher attrition rate on the companys financial performance. It contains information about major financial key performance indicators KPIs such as monthly recurring revenue MRR, customer lifetime value CLV, and customer acquisition cost CAC. Take your projects to the next level with our ultimate collection of Impact Of Customer Churn On Organization Performance Background PDF. Slidegeeks has designed a range of layouts that are perfect for representing task or activity duration, keeping track of all your deadlines at a glance. Tailor these designs to your exact needs and give them a truly corporate look with your own brand colors they will make your projects stand out from the rest.

Search Engine Marketing Estimated Campaign Performance Result Summary Designs PDF
The following slide depicts the forecasted campaign outcomes to assess potential earnings and spending. It includes key performance indicators such as monthly budget, cost per click, website traffic, conversion rate, average conversion value etc. Do you know about Slidesgeeks Search Engine Marketing Estimated Campaign Performance Result Summary Designs PDF These are perfect for delivering any kind od presentation. Using it, create PowerPoint presentations that communicate your ideas and engage audiences. Save time and effort by using our pre-designed presentation templates that are perfect for a wide range of topic. Our vast selection of designs covers a range of styles, from creative to business, and are all highly customizable and easy to edit. Download as a PowerPoint template or use them as Google Slides themes.

Manufacturing Operations Management Process Manufacturing Performance Analysis Inspiration PDF
This slide represents manufacturing performance analysis with key strategies to improve production indicators. It includes production rate, product quality, downtime, scrap rate, etc. Retrieve professionally designed Manufacturing Operations Management Process Manufacturing Performance Analysis Inspiration PDF to effectively convey your message and captivate your listeners. Save time by selecting pre made slideshows that are appropriate for various topics, from business to educational purposes. These themes come in many different styles, from creative to corporate, and all of them are easily adjustable and can be edited quickly. Access them as PowerPoint templates or as Google Slides themes. You do not have to go on a hunt for the perfect presentation because Slidegeeks got you covered from everywhere.

Estimated Campaign Performance Result Summary Ppt Slide PDF
The following slide depicts the forecasted campaign outcomes to assess potential earnings and spending. It includes key performance indicators such as monthly budget, cost per click, website traffic, conversion rate, average conversion value etc. Coming up with a presentation necessitates that the majority of the effort goes into the content and the message you intend to convey. The visuals of a PowerPoint presentation can only be effective if it supplements and supports the story that is being told. Keeping this in mind our experts created Estimated Campaign Performance Result Summary Ppt Slide PDF to reduce the time that goes into designing the presentation. This way, you can concentrate on the message while our designers take care of providing you with the right template for the situation.

Automation Project Status Dashboard Of Consulting Firm Report Background PDF
This slide showcases project status dashboard that provides a concise visual of key indicators progress and allow to compare actual performance with pre-built objectives. Key metrics covered are cost performance, time v or s project phase, timeline v or s resource capacity. Showcasing this set of slides titled Automation Project Status Dashboard Of Consulting Firm Report Background PDF. The topics addressed in these templates are Project Phase, Planned Value, Cost Performance Index. All the content presented in this PPT design is completely editable. Download it and make adjustments in color, background, font etc. as per your unique business setting.
Online Risk Management Dashboard For Tracking Threats And Attacks Icons PDF
The purpose of this slide is to represent dashboard to monitor risks and cyber threats for efficient risk management. It includes various types of key performance indicators such as types of risks, severities, sources and risk meter. Showcasing this set of slides titled Online Risk Management Dashboard For Tracking Threats And Attacks Icons PDF. The topics addressed in these templates are Attack, Indication Severities, Sources. All the content presented in this PPT design is completely editable. Download it and make adjustments in color, background, font etc. as per your unique business setting.

How To Evaluate And Develop The Organizational Value Of IT Service Financial Fundamental Metrics Slides PDF
These indicators assist IT leaders in stewarding technology expenditures and investments, and they are essential to managing the IT company. These measures aid in the management of the departments financial health and may indicate levers for cost reduction, improved resource allocation, and enhanced accountability. Deliver and pitch your topic in the best possible manner with this how to evaluate and develop the organizational value of it service financial fundamental metrics slides pdf. Use them to share invaluable insights on organizations, budget, business, efficiency and impress your audience. This template can be altered and modified as per your expectations. So, grab it now.
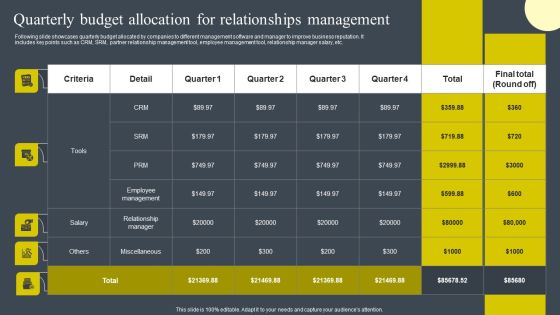
Quarterly Budget Allocation For Relationships Management Clipart PDF
Mentioned slide demonstrates impact of customer management solutions on business key performance indicators. It includes key performance indicators such as customer retention, loyal customer base, customer abandonment rate, customer satisfaction, etc. There are so many reasons you need a Quarterly Budget Allocation For Relationships Management Clipart PDF. The first reason is you can not spend time making everything from scratch, Thus, Slidegeeks has made presentation templates for you too. You can easily download these templates from our website easily.

Financial Fundamental Metrics Infrastructure Unit Costs Vs Target Benchmarks Ppt Professional Example PDF
These indicators assist IT leaders in stewarding technology expenditures and investments, and they are essential to managing the IT company. These measures aid in the management of the departments financial health and may indicate levers for cost reduction, improved resource allocation, and enhanced accountability. Deliver and pitch your topic in the best possible manner with this financial fundamental metrics infrastructure unit costs vs target benchmarks ppt professional example pdf. Use them to share invaluable insights on outsourcing, organizations, budget and impress your audience. This template can be altered and modified as per your expectations. So, grab it now.

Communicate Company Value To Your Stakeholders Financial Fundamental Metrics Graphics PDF
These indicators assist IT leaders in stewarding technology expenditures and investments, and they are essential to managing the IT company. These measures aid in the management of the departments financial health and may indicate levers for cost reduction, improved resource allocation, and enhanced accountability. Deliver and pitch your topic in the best possible manner with this communicate company value to your stakeholders financial fundamental metrics graphics pdf. Use them to share invaluable insights on organizations, budget, protect and impress your audience. This template can be altered and modified as per your expectations. So, grab it now.

Leading And Lagging Safety Indicators With Status Slides PDF
This slide enable to track the progress of safety goals in order to improve overall performance along with the progress status of each metrics. It incorporates metrics like incident rate,number of lost work days, cost of loss, safety audit score and safety training. Pitch your topic with ease and precision using this Leading And Lagging Safety Indicators With Status Slides PDF. This layout presents information on Safety Indicators, Metrics, Expected, Lagging Indicators. It is also available for immediate download and adjustment. So, changes can be made in the color, design, graphics or any other component to create a unique layout.

Agile Software Development Lifecycle IT Agile Metrics To Measure Project Development Progress Contd Topics PDF
This slide provides information on the agile metrics namely work item age graph that can be used by the organization to measure its project development progress.Deliver an awe inspiring pitch with this creative agile software development lifecycle it agile metrics to measure project development progress contd topics pdf bundle. Topics like unfinished tasks, passes between, indicating the time that can be discussed with this completely editable template. It is available for immediate download depending on the needs and requirements of the user.

Construction Sector Project Risk Management Using Leading Metrics To Improve Safety Management Sample PDF
This slide covers the indicators of safety performance, such as total recordable incident rates, and days away and restricted or transferred rates, which are well established in the construction industry. This is a construction sector project risk management using leading metrics to improve safety management sample pdf template with various stages. Focus and dispense information on two stages using this creative set, that comes with editable features. It contains large content boxes to add your information on topics like developing leading indicators, safety database. You can also showcase facts, figures, and other relevant content using this PPT layout. Grab it now.

Key Metrics For Building Quality Inspection Ppt PowerPoint Presentation File Outline PDF
This slide showcases key indicators of construction firm that assists in achieving short term objectives and build long term company health. Key indicators covered are number of defects, rework costs, time taken to fix defects, total site inspections and customer satisfaction. Persuade your audience using this Key Metrics For Building Quality Inspection Ppt PowerPoint Presentation File Outline PDF. This PPT design covers five stages, thus making it a great tool to use. It also caters to a variety of topics including Extremely Satisfying, Satisfying, Unsatisfying. Download this PPT design now to present a convincing pitch that not only emphasizes the topic but also showcases your presentation skills.

Employee Health And Safety Performance Measurements Comparison Of Actual And Targets In Workplace Mockup PDF
This slide contains the information of the key performance indicators for checking performance on safety. It also includes the target that has to be achieved with the actual outcome and their status. Persuade your audience using this Employee Health And Safety Performance Measurements Comparison Of Actual And Targets In Workplace Mockup PDF This PPT design covers five stages, thus making it a great tool to use. It also caters to a variety of topics including Performance Measures, Reduction Equipment Breakdowns, Employees Trained Download this PPT design now to present a convincing pitch that not only emphasizes the topic but also showcases your presentation skills.

Optimizing Human Capital Alignment Assessing Workforce Performance Evaluation Kpis Download PDF
This slide provides glimpse about multiple key performance indicators that will help our company to evaluate workforce performance. It includes performance standards, description, ratings, etc. Take your projects to the next level with our ultimate collection of Optimizing Human Capital Alignment Assessing Workforce Performance Evaluation Kpis Download PDF. Slidegeeks has designed a range of layouts that are perfect for representing task or activity duration, keeping track of all your deadlines at a glance. Tailor these designs to your exact needs and give them a truly corporate look with your own brand colors theyll make your projects stand out from the rest.

Developing Excellence In Logistics Operations Kpis To Track Transportation Management System Performance Clipart PDF
This slide focuses on key performance indicators to track transportation management system performance which includes freight cost for each unit shipped, outbound and inbound freight costs, etc.Deliver and pitch your topic in the best possible manner with this Developing Excellence In Logistics Operations Kpis To Track Transportation Management System Performance Clipart PDF Use them to share invaluable insights on Inbound Freight, Transportation Time, Freight Billing and impress your audience. This template can be altered and modified as per your expectations. So, grab it now.
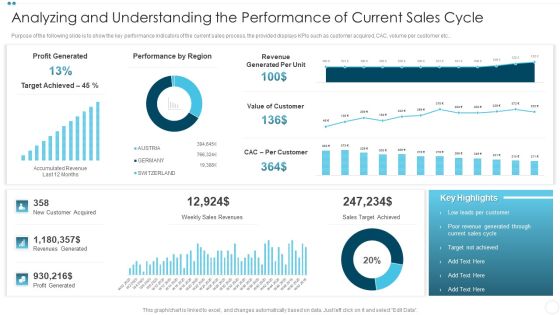
Analyzing And Understanding The Performance Of Current Sales Cycle Background PDF
Purpose of the following slide is to show the key performance indicators of the current sales process, the provided displays KPIs such as customer acquired, CAC, volume per customer etc.Deliver and pitch your topic in the best possible manner with this Analyzing And Understanding The Performance Of Current Sales Cycle Background PDF Use them to share invaluable insights on Profit Generated, Performance By Region, Customer Acquired and impress your audience. This template can be altered and modified as per your expectations. So, grab it now.

Kpis To Measure Performance Of Internal Marketing Strategy Ppt PowerPoint Presentation File Visual Aids PDF
This slide signifies the key performance indicator to track performance of internal marketing approach. It covers information about KPIs, target and actual standards and strategies implemented.Pitch your topic with ease and precision using this Kpis To Measure Performance Of Internal Marketing Strategy Ppt PowerPoint Presentation File Visual Aids PDF. This layout presents information on Employee Engagement, Brand Positioning, Share Voice. It is also available for immediate download and adjustment. So, changes can be made in the color, design, graphics or any other component to create a unique layout.

Cloud Performance Tracking Dashboard Cloud Computing Complexities And Solutions Structure PDF
This slide covers the Key performance indicators for tracking performance of the cloud such as violations break down, sources, rules and severity. Are you searching for a xxxxxxxxxxxxxxxxxxxxxx that is uncluttered, straightforward, and original Its easy to edit, and you can change the colors to suit your personal or business branding. For a presentation that expresses how much effort you ve put in, this template is ideal With all of its features, including tables, diagrams, statistics, and lists, its perfect for a business plan presentation. Make your ideas more appealing with these professional slides. Download Cloud Performance Tracking Dashboard Cloud Computing Complexities And Solutions Structure PDF from Slidegeeks today.

Dashboard To Measure Information Technology Project Plan And Strategy Performance Designs PDF
The following slide displays a dashboard to measure and track various IT key performance indicators. Various KPIs included are strategic process performance status, project budget, employee workload, tasks due, etc. Showcasing this set of slides titled Dashboard To Measure Information Technology Project Plan And Strategy Performance Designs PDF. The topics addressed in these templates are Strategy Designing, Implementation, Overall Progress. All the content presented in this PPT design is completely editable. Download it and make adjustments in color, background, font etc. as per your unique business setting.
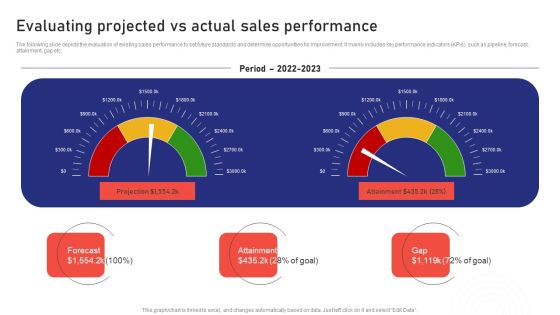
Sales Risk Assessment For Profit Maximization Evaluating Projected Vs Actual Sales Performance Portrait PDF
The following slide depicts the evaluation of existing sales performance to set future standards and determine opportunities for improvement. It mainly includes key performance indicators KPIs such as pipeline, forecast, attainment, gap etc. There are so many reasons you need a Sales Risk Assessment For Profit Maximization Evaluating Projected Vs Actual Sales Performance Portrait PDF. The first reason is you can not spend time making everything from scratch, Thus, Slidegeeks has made presentation templates for you too. You can easily download these templates from our website easily.

Strategies To Enhance Call Center Management Evaluate Performance By Monitoring Call Rules PDF
This slide highlights call center key performance indicators which can be used to evaluate organization and employee performance which includes service level, response time, abandonment rate, Quality monitoring scores, customer satisfaction and first call resolution. Find a pre-designed and impeccable Strategies To Enhance Call Center Management Evaluate Performance By Monitoring Call Rules PDF. The templates can ace your presentation without additional effort. You can download these easy-to-edit presentation templates to make your presentation stand out from others. So, what are you waiting for Download the template from Slidegeeks today and give a unique touch to your presentation.
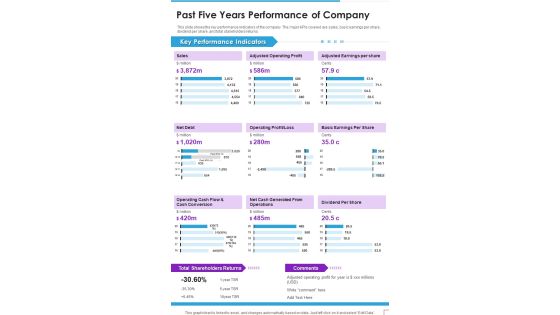
Past Five Years Performance Of Company Template 346 One Pager Documents
This slide shows the key performance indicators of the company. The major KPIs covered are sales, basic earnings per share, dividend per share, and total stakeholders returns. Presenting you a fantastic Past Five Years Performance Of Company Template 346 One Pager Documents. This piece is crafted on hours of research and professional design efforts to ensure you have the best resource. It is completely editable and its design allow you to rehash its elements to suit your needs. Get this Past Five Years Performance Of Company Template 346 One Pager Documents A4 One-pager now.

Implementing On Site Seo Strategy To Expand Customer Reach Measuring Our Seo Performance Professional PDF
The following slide provides various key performance indicators of the SEO strategy, these can be number of users, social networks and new vs returning. From laying roadmaps to briefing everything in detail, our templates are perfect for you. You can set the stage with your presentation slides. All you have to do is download these easy to edit and customizable templates. Implementing On Site Seo Strategy To Expand Customer Reach Measuring Our Seo Performance Professional PDF will help you deliver an outstanding performance that everyone would remember and praise you for. Do download this presentation today.
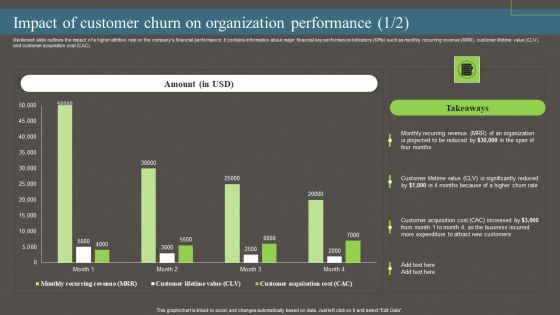
Impact Of Customer Churn On Organization Performance Ppt PowerPoint Presentation File Pictures PDF
Mentioned slide outlines the impact of a higher attrition rate on the companys financial performance. It contains information about major financial key performance indicators KPIs such as monthly recurring revenue MRR, customer lifetime value CLV, and customer acquisition cost CAC. The best PPT templates are a great way to save time, energy, and resources. Slidegeeks have 100 percent editable powerpoint slides making them incredibly versatile. With these quality presentation templates, you can create a captivating and memorable presentation by combining visually appealing slides and effectively communicating your message. Download Impact Of Customer Churn On Organization Performance Ppt PowerPoint Presentation File Pictures PDF from Slidegeeks and deliver a wonderful presentation.

Impact Of Product Corporate Diversification In Improving Business Performance Infographics PDF
This slide shows impact of product corporate diversification on business performance with various key performance indicators. It includes quality, productivity, profitability, market share, brand recognition etc. Showcasing this set of slides titled Impact Of Product Corporate Diversification In Improving Business Performance Infographics PDF. The topics addressed in these templates are Product Transportation Costs, Product Quality, Market Segments. All the content presented in this PPT design is completely editable. Download it and make adjustments in color, background, font etc. as per your unique business setting.

Executing Sales Risk Reduction Plan Evaluating Projected Vs Actual Sales Performance Portrait PDF
The following slide depicts the evaluation of existing sales performance to set future standards and determine opportunities for improvement. It mainly includes key performance indicators KPIs such as pipeline, forecast, attainment, gap etc. There are so many reasons you need a Executing Sales Risk Reduction Plan Evaluating Projected Vs Actual Sales Performance Portrait PDF. The first reason is you can not spend time making everything from scratch, Thus, Slidegeeks has made presentation templates for you too. You can easily download these templates from our website easily.
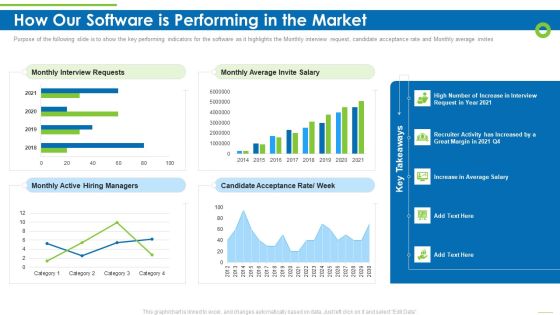
Enterprise Recruitment Industries Investor Fund Raising How Our Software Is Performing In The Market Download PDF
Purpose of the following slide is to show the key performing indicators for the software as it highlights the Monthly interview request, candidate acceptance rate and Monthly average invites Deliver and pitch your topic in the best possible manner with this enterprise recruitment industries investor fund raising how our software is performing in the market download pdf. Use them to share invaluable insights on monthly interview requests, monthly average invite salary, candidate acceptance and impress your audience. This template can be altered and modified as per your expectations. So, grab it now.

BANT Sales Lead Qualification Model Analyzing And Understanding The Performance Icons PDF
Purpose of the following slide is to show the key performance indicators of the current sales process, the provided displays KPIs such as customer acquired, CAC, volume per customer etc. Deliver and pitch your topic in the best possible manner with this BANT Sales Lead Qualification Model Analyzing And Understanding The Performance Icons PDF. Use them to share invaluable insights on New Customer, Weekly Sales, Revenues Sales and impress your audience. This template can be altered and modified as per your expectations. So, grab it now.

Banking Operations Model Revamp Plan Weak Banking Operational Performance Quarterly Download PDF
This slide highlights the current state of banking operations and services which includes key performance indicator of one branch which includes new account opened, total account closed, teller transactions, loan disbursal and credit cards issued. Deliver an awe inspiring pitch with this creative Banking Operations Model Revamp Plan Weak Banking Operational Performance Quarterly Download PDF bundle. Topics like Average, Total Loans Disbursal can be discussed with this completely editable template. It is available for immediate download depending on the needs and requirements of the user.

Workforce Performance Strategy Kpis To Measure Employee Efficiency Ppt Layouts Microsoft PDF
The purpose of this slide is to measure the efficiency of team members on the basis of key performance indicators. This includes team efficiency, work quality, learning ability, teamwork, and adherence to timelines. Presenting Workforce Performance Strategy Kpis To Measure Employee Efficiency Ppt Layouts Microsoft PDF to dispense important information. This template comprises five stages. It also presents valuable insights into the topics including Work Efficiency, Learning Ability, Teamwork. This is a completely customizable PowerPoint theme that can be put to use immediately. So, download it and address the topic impactfully.

Initiating Kpis And Deadline Achievement Benchmarka Building Efficient Workplace Performance Download PDF
This slide showcases introducing key performance indicators KPIs and deadline achievement benchmark. It provides information about team, goal, data collection source, reporting, assessment, target, customer satisfaction, efficiency, etc.Present like a pro with Initiating Kpis And Deadline Achievement Benchmarka Building Efficient Workplace Performance Download PDF Create beautiful presentations together with your team, using our easy-to-use presentation slides. Share your ideas in real-time and make changes on the fly by downloading our templates. So whether you are in the office, on the go, or in a remote location, you can stay in sync with your team and present your ideas with confidence. With Slidegeeks presentation got a whole lot easier. Grab these presentations today.
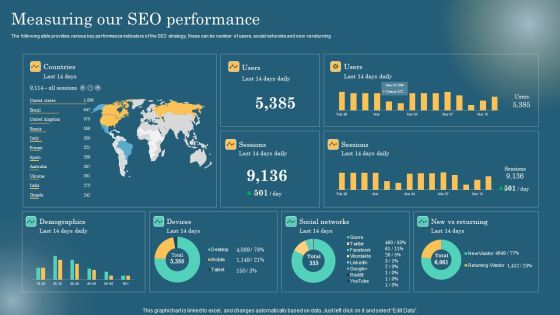
Measuring Our SEO Performance Maximizing Online Visibility Using Off Site SEO Techniques Guidelines PDF
The following slide provides various key performance indicators of the SEO strategy, these can be number of users, social networks and new vs returning. The best PPT templates are a great way to save time, energy, and resources. Slidegeeks have 100 percent editable powerpoint slides making them incredibly versatile. With these quality presentation templates, you can create a captivating and memorable presentation by combining visually appealing slides and effectively communicating your message. Download Measuring Our SEO Performance Maximizing Online Visibility Using Off Site SEO Techniques Guidelines PDF from Slidegeeks and deliver a wonderful presentation.
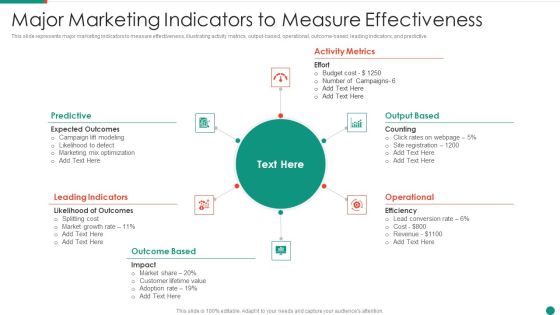
Major Marketing Indicators To Measure Effectiveness Mockup PDF
This slide represents major marketing indicators to measure effectiveness, illustrating activity metrics, output-based, operational, outcome-based, leading indicators, and predictive.Presenting Major Marketing Indicators To Measure Effectiveness Mockup PDF to dispense important information. This template comprises six stages. It also presents valuable insights into the topics including Leading Indicators, Outcome Based, Activity Metrics This is a completely customizable PowerPoint theme that can be put to use immediately. So, download it and address the topic impactfully.

Kpis To Evaluate Applicant Selection Process Ppt PowerPoint Presentation File Introduction PDF
This slide shows key performance indicators to evaluate the efficiency of applicant selection process. It includes various metrics such as hiring, sourcing channel efficiency, number of qualified candidates, etc. Showcasing this set of slides titled Kpis To Evaluate Applicant Selection Process Ppt PowerPoint Presentation File Introduction PDF. The topics addressed in these templates are Metrics, Expected, Actual, Variance. All the content presented in this PPT design is completely editable. Download it and make adjustments in color, background, font etc. as per your unique business setting.

Demand Generation Kpis Used For Organizations Tactics Planning Ppt Inspiration Summary PDF
This slide covers the details related to the key performance indicators of demand creation used in strategic planning. The purpose of this template is to define demand generation KPIs. It includes metrics such MQLs marketing qualified leads, SOLs sales qualified leads, etc. Showcasing this set of slides titled Demand Generation Kpis Used For Organizations Tactics Planning Ppt Inspiration Summary PDF. The topics addressed in these templates are Metric, Activities, Outcomes. All the content presented in this PPT design is completely editable. Download it and make adjustments in color, background, font etc. as per your unique business setting.

Dashboard For Monitoring Social Media Platforms Marketing Document Slides PDF
This slide provides marketing report for various social media platforms aimed at displaying data insights in one place using relevant key performance indicators. It covers four platforms with key insights on marketing performance measured by metrics. Showcasing this set of slides titled Dashboard For Monitoring Social Media Platforms Marketing Document Slides PDF. The topics addressed in these templates are Impressions, Engagement, Target. All the content presented in this PPT design is completely editable. Download it and make adjustments in color, background, font etc. as per your unique business setting.

Kpis To Track Before Raising Capital Portrait PDF
This slide presents various key performance metrics which a company should track in order to raise capital for equity. The major key performance indicators are revenue growth, gross margin, customer acquisition costs, net promoter score and burn rate. Pitch your topic with ease and precision using this Kpis To Track Before Raising Capital Portrait PDF. This layout presents information on Net Promoter Score, Customer Acquisition Costs, Gross Margin. It is also available for immediate download and adjustment. So, changes can be made in the color, design, graphics or any other component to create a unique layout.

Agile Group For Product Development Metrics Used To Measure Product Team Performance Download PDF
This slide represents metrics used to measure product team performance that covers product stickiness and usage, feature adoption and retention, net promoter score, product delivery predictability, etc. Deliver and pitch your topic in the best possible manner with this agile group for product development metrics used to measure product team performance download pdf. Use them to share invaluable insights on leading indicators, product delivery predictability, product stickiness and impress your audience. This template can be altered and modified as per your expectations. So, grab it now.

 Home
Home