Barometer Kpi

Customer Metrics Dashboard For Retention Management Rate Information PDF
This slide represents dashboard exhibiting customer retention management key performance indicators. It covers NPS, loyal customer rate, customer churn, revenue churn etc. Showcasing this set of slides titled customer metrics dashboard for retention management rate information pdf. The topics addressed in these templates are customer, premium users. All the content presented in this PPT design is completely editable. Download it and make adjustments in color, background, font etc. as per your unique business setting.
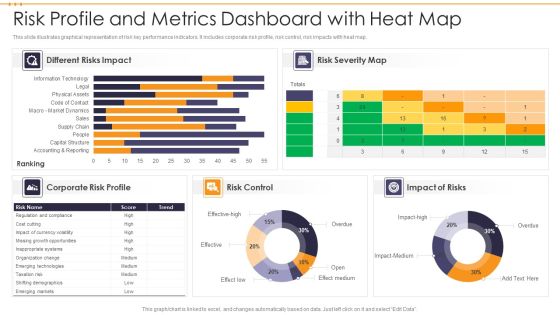
Risk Profile And Metrics Dashboard With Heat Map Brochure PDF
This slide illustrates graphical representation of risk key performance indicators. It includes corporate risk profile, risk control, risk impacts with heat map. Showcasing this set of slides titled Risk Profile And Metrics Dashboard With Heat Map Brochure PDF. The topics addressed in these templates are Risk Control, Impact Of Risks, Risk Severity Map. All the content presented in this PPT design is completely editable. Download it and make adjustments in color, background, font etc. as per your unique business setting.

Corporate Earnings And Risk Metrics Dashboard Guidelines PDF
This slide illustrates graphical representation of risk key performance indicators. It includes financial risks, operational risk and risk expenditure etc. Pitch your topic with ease and precision using this Corporate Earnings And Risk Metrics Dashboard Guidelines PDF. This layout presents information on Financial Risk, Operational Risk Expenditure. It is also available for immediate download and adjustment. So, changes can be made in the color, design, graphics or any other component to create a unique layout.
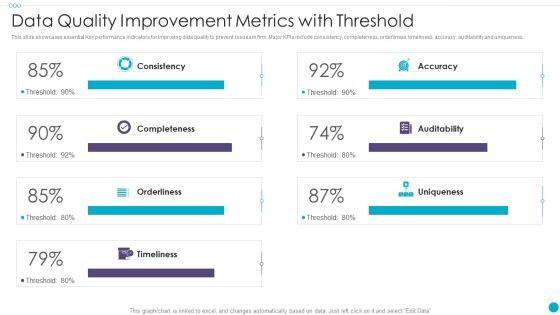
Data Quality Improvement Metrics With Threshold Formats PDF
This slide showcases essential Key performance indicators for improving data quality to prevent issues in firm. Major KPIs include consistency, completeness, orderliness, timeliness, accuracy, auditability and uniqueness. Pitch your topic with ease and precision using this Data Quality Improvement Metrics With Threshold Formats PDF This layout presents information on Auditability, Completeness, Consistency It is also available for immediate download and adjustment. So, changes can be made in the color, design, graphics or any other component to create a unique layout.
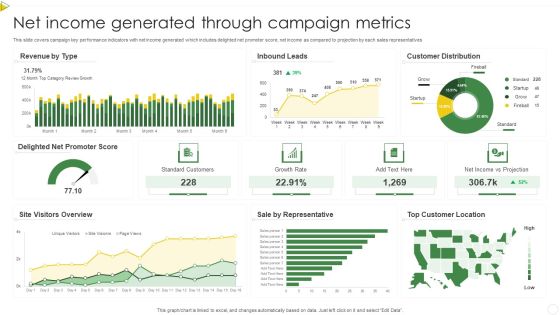
Net Income Generated Through Campaign Metrics Summary PDF
This slide covers campaign key performance indicators with net income generated which includes delighted net promoter score, net income as compared to projection by each sales representatives. Pitch your topic with ease and precision using this Net Income Generated Through Campaign Metrics Summary PDF. This layout presents information on Standard Customers, Growth Rate, Net Income. It is also available for immediate download and adjustment. So, changes can be made in the color, design, graphics or any other component to create a unique layout.
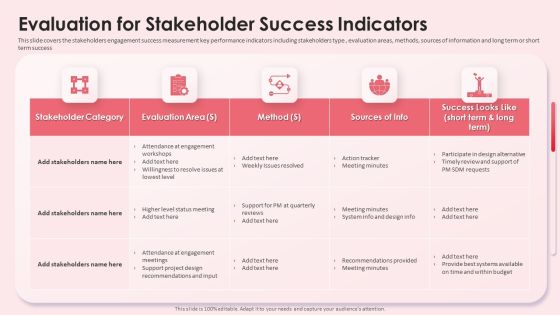
Evaluation For Stakeholder Success Indicators Impact Shareholder Decisions With Stakeholder Administration Clipart PDF
This slide covers the stakeholders engagement success measurement key performance indicators including stakeholders type , evaluation areas, methods, sources of information and long term or short term success. If you are looking for a format to display your unique thoughts, then the professionally designed Evaluation For Stakeholder Success Indicators Impact Shareholder Decisions With Stakeholder Administration Clipart PDF is the one for you. You can use it as a Google Slides template or a PowerPoint template. Incorporate impressive visuals, symbols, images, and other charts. Modify or reorganize the text boxes as you desire. Experiment with shade schemes and font pairings. Alter, share or cooperate with other people on your work. Download Evaluation For Stakeholder Success Indicators Impact Shareholder Decisions With Stakeholder Administration Clipart PDF and find out how to give a successful presentation. Present a perfect display to your team and make your presentation unforgettable.

Benefits Of Effective Stakeholder Relationship Evaluation For Stakeholder Success Indicators Background PDF
This slide covers the stakeholders engagement success measurement key performance indicators including stakeholders type , evaluation areas, methods, sources of information and long term or short term success. Here you can discover an assortment of the finest PowerPoint and Google Slides templates. With these templates, you can create presentations for a variety of purposes while simultaneously providing your audience with an eye-catching visual experience. Download Benefits Of Effective Stakeholder Relationship Evaluation For Stakeholder Success Indicators Background PDF to deliver an impeccable presentation. These templates will make your job of preparing presentations much quicker, yet still, maintain a high level of quality. Slidegeeks has experienced researchers who prepare these templates and write high-quality content for you. Later on, you can personalize the content by editing the Benefits Of Effective Stakeholder Relationship Evaluation For Stakeholder Success Indicators Background PDF.

Data Analytics Metrics For Internal Audit Ppt Model Outfit PDF
This slide covers the KPIs key performance indicators of data analytics for conducting internal audit. It includes information related to the reporting, planning and audit execution. Presenting Data Analytics Metrics For Internal Audit Ppt Model Outfit PDF to dispense important information. This template comprises three stages. It also presents valuable insights into the topics including Planning, Audit Execution, Reporting. This is a completely customizable PowerPoint theme that can be put to use immediately. So, download it and address the topic impactfully.

Tiktok Digital Marketing Campaign Vet Potential Tiktok Influencers Key Metrics Download PDF
This slide represents the analysis of key performance indicators of the selected potential TikTok influencer by the marketers for their influencer marketing campaign. It includes details related to key metrics such as engagement rate, followers count etc. Do you have to make sure that everyone on your team knows about any specific topic I yes, then you should give Tiktok Digital Marketing Campaign Vet Potential Tiktok Influencers Key Metrics Download PDF a try. Our experts have put a lot of knowledge and effort into creating this impeccable Tiktok Digital Marketing Campaign Vet Potential Tiktok Influencers Key Metrics Download PDF. You can use this template for your upcoming presentations, as the slides are perfect to represent even the tiniest detail. You can download these templates from the Slidegeeks website and these are easy to edit. So grab these today

Step 8 Event Management Performance Evaluation Metrics Ppt Layouts Inspiration PDF
This slide showcases the key metrics that are tracked to measure event success. The indicators covered are registration trends, post survey responses, cost per attendee, NPS and conversion rate. Do you have an important presentation coming up Are you looking for something that will make your presentation stand out from the rest Look no further than Step 8 Event Management Performance Evaluation Metrics Ppt Layouts Inspiration PDF. With our professional designs, you can trust that your presentation will pop and make delivering it a smooth process. And with Slidegeeks, you can trust that your presentation will be unique and memorable. So why wait Grab Step 8 Event Management Performance Evaluation Metrics Ppt Layouts Inspiration PDF today and make your presentation stand out from the rest.
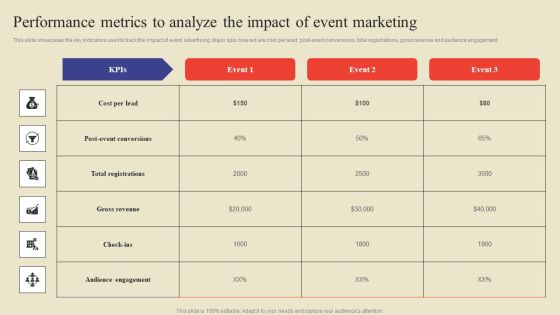
Performance Metrics To Analyze The Impact Of Event Marketing Ppt Professional Structure PDF
This slide showcases the key indicators used to track the impact of event advertising. Major kpis covered are cost per lead, post-event conversions, total registrations, gross revenue and audience engagement. This Performance Metrics To Analyze The Impact Of Event Marketing Ppt Professional Structure PDF from Slidegeeks makes it easy to present information on your topic with precision. It provides customization options, so you can make changes to the colors, design, graphics, or any other component to create a unique layout. It is also available for immediate download, so you can begin using it right away. Slidegeeks has done good research to ensure that you have everything you need to make your presentation stand out. Make a name out there for a brilliant performance.

Metrics To Evaluate Real Time Marketing Campaign Performance Ppt Inspiration Portfolio PDF
The following slide showcases some key performance indicators KPIs to assess real time marketing campaign results for performance review. It includes elements such as engagement, awareness, led generation, reach, impressions, click through rate, open rate etc. Get a simple yet stunning designed Metrics To Evaluate Real Time Marketing Campaign Performance Ppt Inspiration Portfolio PDF. It is the best one to establish the tone in your meetings. It is an excellent way to make your presentations highly effective. So, download this PPT today from Slidegeeks and see the positive impacts. Our easy-to-edit Metrics To Evaluate Real Time Marketing Campaign Performance Ppt Inspiration Portfolio PDF can be your go-to option for all upcoming conferences and meetings. So, what are you waiting for Grab this template today.

Comprehensive Guide For Launch Performance Metrics To Analyze The Impact Of Event Diagrams PDF
This slide showcases the key indicators used to track the impact of event advertising. Major KPIs covered are cost per lead, post-event conversions, total registrations, gross revenue and audience engagement. Welcome to our selection of the Comprehensive Guide For Launch Performance Metrics To Analyze The Impact Of Event Diagrams PDF. These are designed to help you showcase your creativity and bring your sphere to life. Planning and Innovation are essential for any business that is just starting out. This collection contains the designs that you need for your everyday presentations. All of our PowerPoints are 100 percent editable, so you can customize them to suit your needs. This multi-purpose template can be used in various situations. Grab these presentation templates today.
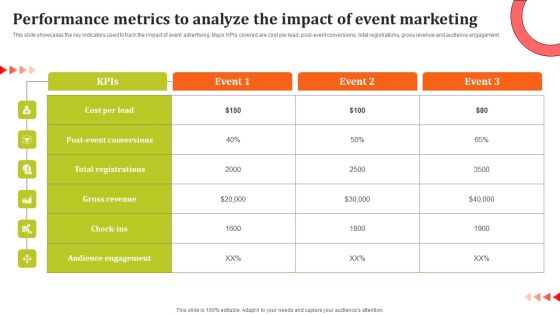
Performance Metrics To Analyze The Impact Of Event Marketing Ppt Model Layouts PDF
This slide showcases the key indicators used to track the impact of event advertising. Major KPIs covered are cost per lead, post-event conversions, total registrations, gross revenue and audience engagement. This modern and well arranged Performance Metrics To Analyze The Impact Of Event Marketing Ppt Model Layouts PDF provides lots of creative possibilities. It is very simple to customize and edit with the Powerpoint Software. Just drag and drop your pictures into the shapes. All facets of this template can be edited with Powerpoint no extra software is necessary. Add your own material, put your images in the places assigned for them, adjust the colors, and then you can show your slides to the world, with an animated slide included.

Key Metrics To Measure Success Of Instagram Marketing Campaign Designs PDF
The following slide outlines various key performance indicators KPIs through which marketers can evaluate success of Instagram reels, stories, and other strategies. The metrics are brand reach, impressions, post engagement rate, story views, reels engagement, etc. Find highly impressive Key Metrics To Measure Success Of Instagram Marketing Campaign Designs PDF on Slidegeeks to deliver a meaningful presentation. You can save an ample amount of time using these presentation templates. No need to worry to prepare everything from scratch because Slidegeeks experts have already done a huge research and work for you. You need to download Key Metrics To Measure Success Of Instagram Marketing Campaign Designs PDF for your upcoming presentation. All the presentation templates are 100 percent editable and you can change the color and personalize the content accordingly. Download now

Increasing Consumer Engagement With Database Key Metrics To Measure Success Sample PDF
The purpose of this slide is to delineate key performance indicators KPIs through which marketers can evaluate success of email marketing campaign results and make data-driven decisions. The metrics are open rate, click-through rate CTR, conversion rate, spam complaint rate, forward rate, delivery rate, etc. Do you have to make sure that everyone on your team knows about any specific topic I yes, then you should give Increasing Consumer Engagement With Database Key Metrics To Measure Success Sample PDF a try. Our experts have put a lot of knowledge and effort into creating this impeccable Increasing Consumer Engagement With Database Key Metrics To Measure Success Sample PDF. You can use this template for your upcoming presentations, as the slides are perfect to represent even the tiniest detail. You can download these templates from the Slidegeeks website and these are easy to edit. So grab these today.
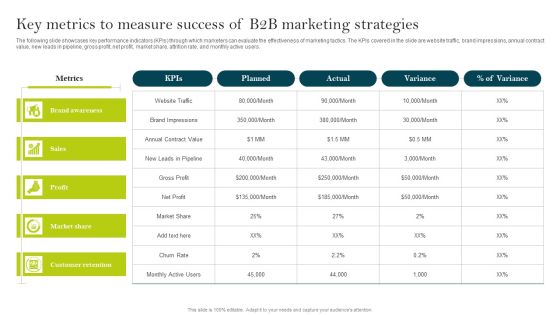
Key Metrics To Measure Success Of B2B Marketing Strategies Ppt PowerPoint Presentation File Styles PDF
The following slide showcases key performance indicators KPIs through which marketers can evaluate the effectiveness of marketing tactics. The KPIs covered in the slide are website traffic, brand impressions, annual contract value, new leads in pipeline, gross profit, net profit, market share, attrition rate, and monthly active users. Slidegeeks has constructed Key Metrics To Measure Success Of B2B Marketing Strategies Ppt PowerPoint Presentation File Styles PDF after conducting extensive research and examination. These presentation templates are constantly being generated and modified based on user preferences and critiques from editors. Here, you will find the most attractive templates for a range of purposes while taking into account ratings and remarks from users regarding the content. This is an excellent jumping off point to explore our content and will give new users an insight into our top notch PowerPoint Templates.
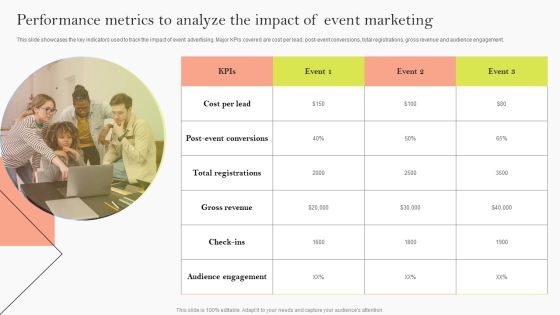
Performance Metrics To Analyze The Impact Of Event Marketing Ppt Model Good PDF
This slide showcases the key indicators used to track the impact of event advertising. Major KPIs covered are cost per lead, post-event conversions, total registrations, gross revenue and audience engagement. This modern and well arranged Performance Metrics To Analyze The Impact Of Event Marketing Ppt Model Good PDF provides lots of creative possibilities. It is very simple to customize and edit with the Powerpoint Software. Just drag and drop your pictures into the shapes. All facets of this template can be edited with Powerpoint no extra software is necessary. Add your own material, put your images in the places assigned for them, adjust the colors, and then you can show your slides to the world, with an animated slide included.
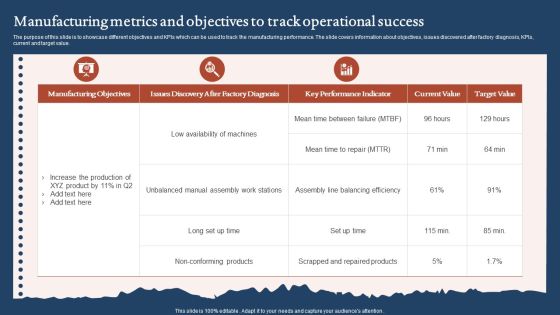
Manufacturing Metrics And Objectives To Track Operational Success Formats PDF
The purpose of this slide is to showcase different objectives and KPIs which can be used to track the manufacturing performance. The slide covers information about objectives, issues discovered after factory diagnosis, KPIs, current and target value. Showcasing this set of slides titled Manufacturing Metrics And Objectives To Track Operational Success Formats PDF. The topics addressed in these templates are Manufacturing Objectives, Key Performance Indicator, Target Value. All the content presented in this PPT design is completely editable. Download it and make adjustments in color, background, font etc. as per your unique business setting.

Metrics To Manage Company Cash Flow Ppt Model Gridlines PDF
This slide showcases key metrics used by organizations to manage cashflow. The key performance indicators included are days, receivable, inventory and payable outstanding. Pitch your topic with ease and precision using this Metrics To Manage Company Cash Flow Ppt Model Gridlines PDF. This layout presents information on Days Receivable Outstanding, Days Inventory Outstanding, Days Payable Outstanding. It is also available for immediate download and adjustment. So, changes can be made in the color, design, graphics or any other component to create a unique layout.
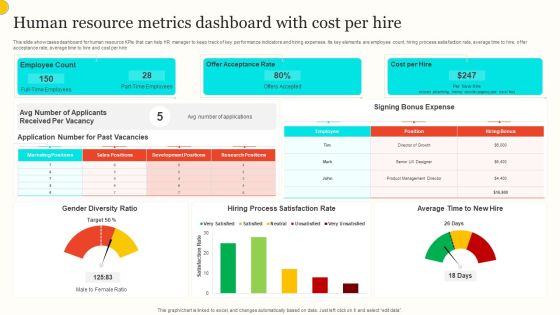
Human Resource Metrics Dashboard With Cost Per Hire Portrait PDF
This slide showcases dashboard for human resource KPIs that can help HR manager to keep track of key performance indicators and hiring expenses. Its key elements are employee count, hiring process satisfaction rate, average time to hire, offer acceptance rate, average time to hire and cost per hire. Showcasing this set of slides titled Human Resource Metrics Dashboard With Cost Per Hire Portrait PDF. The topics addressed in these templates are Employee Count, Offer Acceptance Rate, Cost Per Hire. All the content presented in this PPT design is completely editable. Download it and make adjustments in color, background, font etc. as per your unique business setting.
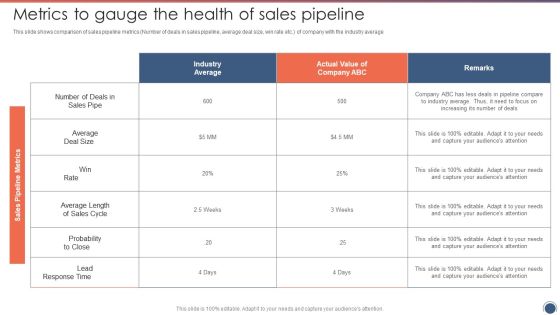
Metrics To Gauge The Health Of Sales Pipeline Sales Funnel Management Strategies To Increase Sales Elements PDF
This slide shows comparison of sales pipeline metrics Number of deals in sales pipeline, average deal size, win rate etc.of company with the industry average.Deliver an awe inspiring pitch with this creative Metrics To Gauge The Health Of Sales Pipeline Sales Funnel Management Strategies To Increase Sales Elements PDF bundle. Topics like Probability Close, Average Length, Average Deal can be discussed with this completely editable template. It is available for immediate download depending on the needs and requirements of the user.

Case Competition Reduction In Existing Customer Of Telecommunication Company Table Of Content Indicators Ppt Model Example File PDF
Deliver an awe inspiring pitch with this creative case competition reduction in existing customer of telecommunication company table of content indicators ppt model example file pdf bundle. Topics like expansion strategy, technological strategy, promotional strategy, key performance indicators, strategy implementation timeline can be discussed with this completely editable template. It is available for immediate download depending on the needs and requirements of the user.

Commodity Adoption Metrics For Technique Development Microsoft PDF
This slide highlights various key performance indicators to identify product adoption rate for user acquisition strategy development. It includes key metrics such as net promoter score, client retention rate, active user percentage, customer lifetime value and churn rate. Presenting Commodity Adoption Metrics For Technique Development Microsoft PDF to dispense important information. This template comprises four stages. It also presents valuable insights into the topics including Build Customer, Onboarding Process, Analysis. This is a completely customizable PowerPoint theme that can be put to use immediately. So, download it and address the topic impactfully.

Sales Management Pipeline For Effective Lead Generation Metrics To Gauge The Health Of Sales Pipeline Information PDF
This slide shows comparison of sales pipeline metrics Number of deals in sales pipeline, average deal size, win rate etc. of company with the industry average. Deliver and pitch your topic in the best possible manner with this Sales Management Pipeline For Effective Lead Generation Metrics To Gauge The Health Of Sales Pipeline Information PDF. Use them to share invaluable insights on Average, Probability, Industry Average and impress your audience. This template can be altered and modified as per your expectations. So, grab it now.

Education Dashboard With Fees Collection And Expense Metrics Demonstration PDF
This slide covers education key performance indicators tracking dashboard. It also include metrics such as total students, teachers, parents, total earrings, social media followers, event calendar, fees collection, and expenses. Showcasing this set of slides titled Education Dashboard With Fees Collection And Expense Metrics Demonstration PDF. The topics addressed in these templates are Event Calender, Annual Holidays, Fees Collection, Expenses. All the content presented in this PPT design is completely editable. Download it and make adjustments in color, background, font etc. as per your unique business setting.

Customer Service Metrics Sources With Improvement Strategies Rules PDF
This slide showcases comparison of customer service metrics from different sources that can help to leverage strategies to improve them in future. Its key performance indicators are average response time, net promoter score, average response time and customer satisfaction score. Showcasing this set of slides titled Customer Service Metrics Sources With Improvement Strategies Rules PDF. The topics addressed in these templates are Average, Strategies, Customer Satisfaction Score. All the content presented in this PPT design is completely editable. Download it and make adjustments in color, background, font etc. as per your unique business setting.
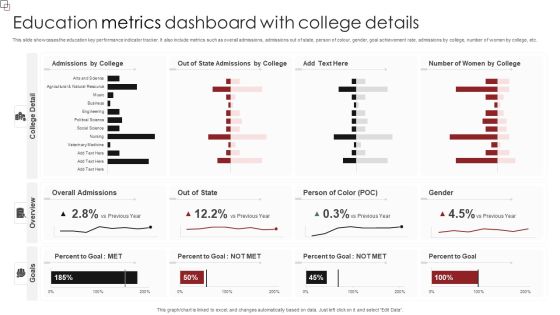
Education Metrics Dashboard With College Details Formats PDF
This slide showcases the education key performance indicator tracker. It also include metrics such as overall admissions, admissions out of state, person of colour, gender, goal achievement rate, admissions by college, number of women by college, etc. Pitch your topic with ease and precision using this Education Metrics Dashboard With College Details Formats PDF. This layout presents information on Overall Admissions, Person Of Color, Percent To Goal. It is also available for immediate download and adjustment. So, changes can be made in the color, design, graphics or any other component to create a unique layout.

Metrics To Measure Content Advertising Success Demonstration PDF
This slide represents key performance indicators used by marketers to measure effectiveness of content marketing strategy. It covers website traffic, direct sales, lead quality etc. The Metrics To Measure Content Advertising Success Demonstration PDF is a compilation of the most recent design trends as a series of slides. It is suitable for any subject or industry presentation, containing attractive visuals and photo spots for businesses to clearly express their messages. This template contains a variety of slides for the user to input data, such as structures to contrast two elements, bullet points, and slides for written information. Slidegeeks is prepared to create an impression.
Tracking Channel Campaign Metrics To Measure Web Traffic Sample PDF
This slide covers measuring campaign key performance indicators through tracking channel web traffic which includes total visit, cost per click, engagement rate and total impressions. Pitch your topic with ease and precision using this Tracking Channel Campaign Metrics To Measure Web Traffic Sample PDF. This layout presents information on Revenue By Channel, Website Demographics, Product Sales Trend. It is also available for immediate download and adjustment. So, changes can be made in the color, design, graphics or any other component to create a unique layout.
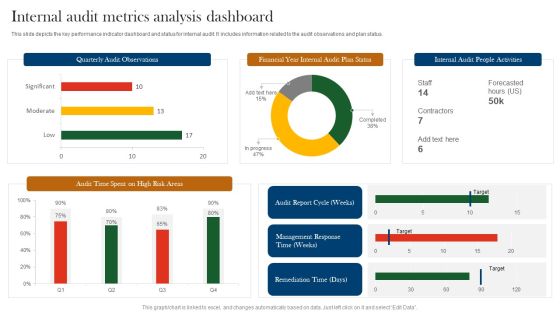
Internal Audit Metrics Analysis Dashboard Ppt Ideas Clipart Images PDF
This slide depicts the key performance indicator dashboard and status for internal audit. It includes information related to the audit observations and plan status. Pitch your topic with ease and precision using this Internal Audit Metrics Analysis Dashboard Ppt Ideas Clipart Images PDF. This layout presents information on Quarterly Audit Observations, Financial Year Internal, Audit Plan Status. It is also available for immediate download and adjustment. So, changes can be made in the color, design, graphics or any other component to create a unique layout.
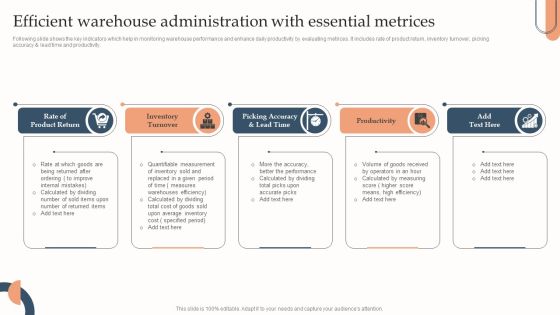
Efficient Warehouse Administration With Essential Metrices Slides PDF
Following slide shows the key indicators which help in monitoring warehouse performance and enhance daily productivity by evaluating metrices. It includes rate of product return, inventory turnover, picking accuracy lead time and productivity.Presenting Efficient Warehouse Administration With Essential Metrices Slides PDF to dispense important information. This template comprises five stages. It also presents valuable insights into the topics including Inventory Turnover, Productivity, Average Inventory. This is a completely customizable PowerPoint theme that can be put to use immediately. So, download it and address the topic impactfully.

Metrics To Consider For Strategic Resource Evaluation Graphics PDF
The following slide depicts three must-have key performance indicators for strategic sourcing and why they are important. The metrics covered are product quality, procurement average cycle time and supplier reliability. Presenting Metrics To Consider For Strategic Resource Evaluation Graphics PDF to dispense important information. This template comprises three stages. It also presents valuable insights into the topics including Product Quality, Procurement Average Cycle Time, Supplier Reliability. This is a completely customizable PowerPoint theme that can be put to use immediately. So, download it and address the topic impactfully.

Saas Metrics Dashboard Indicating Net Monthly Recurring Revenue Information PDF
Showcasing this set of slides titled Saas Metrics Dashboard Indicating Net Monthly Recurring Revenue Information PDF The topics addressed in these templates are Saas Metrics Dashboard Indicating Net Monthly Recurring Revenue All the content presented in this PPT design is completely editable. Download it and make adjustments in color, background, font etc. as per your unique business setting.

Company Performance Of Construction Company With Key Insights Portrait PDF
This slide showcases the construction companys performance on various areas. It include cost, time, quality and safety management, cash flow indicator etc. Pitch your topic with ease and precision using this company performance of construction company with key insights portrait pdf. This layout presents information on performance, management. It is also available for immediate download and adjustment. So, changes can be made in the color, design, graphics or any other component to create a unique layout.
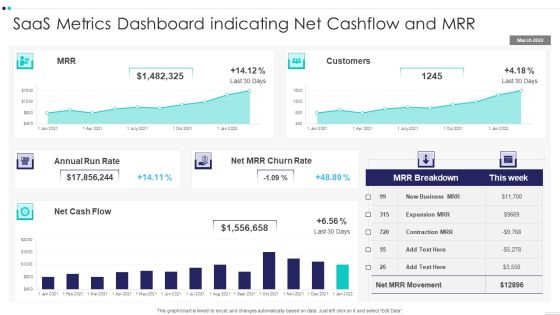
Saas Metrics Dashboard Indicating Net Cashflow And MRR Demonstration PDF
Pitch your topic with ease and precision using this Saas Metrics Dashboard Indicating Net Cashflow And MRR Demonstration PDF This layout presents information on Saas Metrics Dashboard Indicating Net Cashflow And MRR It is also available for immediate download and adjustment. So, changes can be made in the color, design, graphics or any other component to create a unique layout.
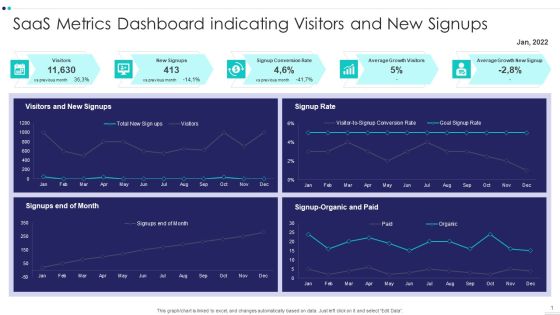
Saas Metrics Dashboard Indicating Visitors And New Signups Elements PDF
Pitch your topic with ease and precision using this Saas Metrics Dashboard Indicating Visitors And New Signups Elements PDF This layout presents information on Saas Metrics Dashboard Indicating Visitors And New Signups It is also available for immediate download and adjustment. So, changes can be made in the color, design, graphics or any other component to create a unique layout.

Texting Platforms Dashboard Indicating SMS Marketing Metrics Designs PDF
This slide showcase messaging platforms dashboard indicating sms marketing metrics which can be referred by businesses to check the activity of their current texting campaign. It contains information about consumers, plan, send, campaigns, growth, reports, outgoing and incoming.Pitch your topic with ease and precision using this texting platforms dashboard indicating sms marketing metrics designs pdf This layout presents information on texting platforms dashboard indicating sms marketing metrics It is also available for immediate download and adjustment. So, changes can be made in the color, design, graphics or any other component to create a unique layout.

Mitigating Sales Risks With Strategic Action Planning Key Metrics To Assess Effectiveness Of Sales Risk Analysis Rules PDF
The following slide highlights some key performance indicators to measure the effectiveness of sales risk evaluation on revenue performance. It includes elements such as opportunities, win rate, average time to win, sales velocity along with key insights etc. Create an editable Mitigating Sales Risks With Strategic Action Planning Key Metrics To Assess Effectiveness Of Sales Risk Analysis Rules PDF that communicates your idea and engages your audience. Whether youre presenting a business or an educational presentation, pre designed presentation templates help save time. Mitigating Sales Risks With Strategic Action Planning Key Metrics To Assess Effectiveness Of Sales Risk Analysis Rules PDF is highly customizable and very easy to edit, covering many different styles from creative to business presentations. Slidegeeks has creative team members who have crafted amazing templates. So, go and get them without any delay.
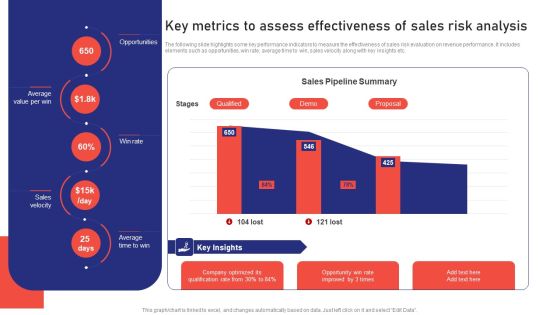
Sales Risk Assessment For Profit Maximization Key Metrics To Assess Effectiveness Of Sales Risk Analysis Ideas PDF
The following slide highlights some key performance indicators to measure the effectiveness of sales risk evaluation on revenue performance. It includes elements such as opportunities, win rate, average time to win, sales velocity along with key insights etc. Get a simple yet stunning designed Sales Risk Assessment For Profit Maximization Key Metrics To Assess Effectiveness Of Sales Risk Analysis Ideas PDF. It is the best one to establish the tone in your meetings. It is an excellent way to make your presentations highly effective. So, download this PPT today from Slidegeeks and see the positive impacts. Our easy to edit Sales Risk Assessment For Profit Maximization Key Metrics To Assess Effectiveness Of Sales Risk Analysis Ideas PDF can be your go to option for all upcoming conferences and meetings. So, what are you waiting for Grab this template today.

Enterprise Sustainability Performance Metrics Financial Performance Indicator Dashboard Themes PDF
This slide shows financial performance indicator dashboard covering net profit and net sales, profitability indicator ratios, cogs and net profit by region or channel.Deliver an awe inspiring pitch with this creative Enterprise Sustainability Performance Metrics Financial Performance Indicator Dashboard Themes PDF bundle. Topics like Profitability Indicator, Sold Breakdown, Target Actual can be discussed with this completely editable template. It is available for immediate download depending on the needs and requirements of the user.
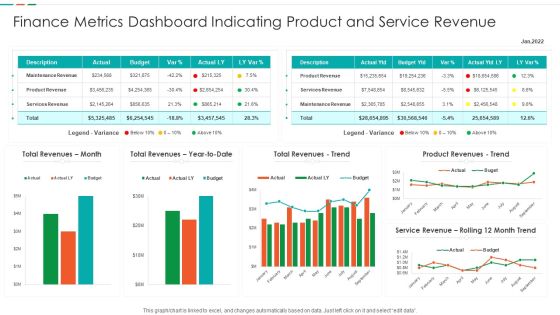
Finance Metrics Dashboard Indicating Product And Service Revenue Designs PDF
This graph or chart is linked to excel, and changes automatically based on data. Just left click on it and select edit data. Showcasing this set of slides titled Finance Metrics Dashboard Indicating Product And Service Revenue Designs PDF. The topics addressed in these templates are Maintenance Revenue Product, Revenue Product Revenues, Service Revenue Rolling. All the content presented in this PPT design is completely editable. Download it and make adjustments in color, background, font etc. as per your unique business setting.
Icon For Risk Metrics Performance Indicators Dashboard Designs PDF
Persuade your audience using this Icon For Risk Metrics Performance Indicators Dashboard Designs PDF. This PPT design covers four stages, thus making it a great tool to use. It also caters to a variety of topics including Icon For Risk Metrics Performance Indicators Dashboard. Download this PPT design now to present a convincing pitch that not only emphasizes the topic but also showcases your presentation skills.
Market Summary Icon With Key Indicators And Metrics Icons PDF
Persuade your audience using this Market Summary Icon With Key Indicators And Metrics Icons PDF. This PPT design covers three stages, thus making it a great tool to use. It also caters to a variety of topics including Market Summary Icon With Key Indicators And Metrics. Download this PPT design now to present a convincing pitch that not only emphasizes the topic but also showcases your presentation skills.

Finance Metrics Dashboard Indicating Portfolio Performance Microsoft PDF
This graph or chart is linked to excel, and changes automatically based on data. Just left click on it and select edit data. Pitch your topic with ease and precision using this Finance Metrics Dashboard Indicating Portfolio Performance Microsoft PDF. This layout presents information on Portfolio Performance Portfolio, Asset Management Manager, Top 10 Assets. It is also available for immediate download and adjustment. So, changes can be made in the color, design, graphics or any other component to create a unique layout.

Finance Metrics Dashboard Indicating Short Term Assets Download PDF
This graph or chart is linked to excel, and changes automatically based on data. Just left click on it and select edit data. Pitch your topic with ease and precision using this Finance Metrics Dashboard Indicating Short Term Assets Download PDF. This layout presents information on Short Term Assets, Global Financial Performance, Revenue YTD 2022. It is also available for immediate download and adjustment. So, changes can be made in the color, design, graphics or any other component to create a unique layout.

Comprehensive Guide To Build Marketing Success Metrics To Measure Influencer Marketing Sample PDF
The following slide showcases different key performance indicators KPIs through which digital marketers can evaluate influencer marketing campaign performance. The key performance indicators outlined in slide are audience reach, impressions, followers growth, click-through rate CTR, revenue, and conversion rate. This modern and well-arranged Comprehensive Guide To Build Marketing Success Metrics To Measure Influencer Marketing Sample PDF provides lots of creative possibilities. It is very simple to customize and edit with the Powerpoint Software. Just drag and drop your pictures into the shapes. All facets of this template can be edited with Powerpoint, no extra software is necessary. Add your own material, put your images in the places assigned for them, adjust the colors, and then you can show your slides to the world, with an animated slide included.

Application Project Portfolio Scorecard Scoring Metrics Information PDF
The slide showcases a project portfolio scorecard which help visualize and manage all of the projects in a portfolio, review portfolios progress and costs, make notes on the risks, and perform a cost-benefit analysis. includes a section for details about each project in the portfolio and categories include priority, status, planned versus actual costs, hours, and quality index rating. Showcasing this set of slides titled Application Project Portfolio Scorecard Scoring Metrics Information PDF. The topics addressed in these templates are Project Management Overview, Projects Key Performance Indicators, Additional Comments. All the content presented in this PPT design is completely editable. Download it and make adjustments in color, background, font etc. as per your unique business setting.

Key Performance Management Of Digital Marketing Pyramid Designs PDF
This slide represents the pyramid showing the kpis of digital marketing team. It includes loyalty, sales, online advertising and traffic key performance indicators for the digital marketing team. Presenting Key Performance Management Of Digital Marketing Pyramid Designs PDF to dispense important information. This template comprises three stages. It also presents valuable insights into the topics including Key Performance Management, Digital Marketing Pyramid. This is a completely customizable PowerPoint theme that can be put to use immediately. So, download it and address the topic impactfully.

Safety Team Performance Management Dashboard With Key Kpis Rules PDF
This slide shows a dashboard representing performance measurement of the safety team of the organization on the basis of key performance indicators. It includes details related to safety team performance ranking, average result area scores etc. Pitch your topic with ease and precision using this Safety Team Performance Management Dashboard With Key Kpis Rules PDF. This layout presents information on Improve Corrective Actions, Safety Manager Objective, Conduct Risk Assessment. It is also available for immediate download and adjustment. So, changes can be made in the color, design, graphics or any other component to create a unique layout.
Executive Dashboards For Tracking Key Performance Icons PDF
This slide represents the dashboard for the CEO to track the companys performance. It includes key performance indicators such as no. of deals, open deals, revenue, expected revenue and win percentage. Showcasing this set of slides titled Executive Dashboards For Tracking Key Performance Icons PDF. The topics addressed in these templates are Pen Deals, Revenue, Expected Revenue. All the content presented in this PPT design is completely editable. Download it and make adjustments in color, background, font etc. as per your unique business setting.

Corporate Risk Metrics Dashboard And Control Dashboard With Expenditure Inspiration PDF
This slide illustrates corporate risk key performance indicators. It includes graphs of inherent risks, overdue risks, risk control data. Showcasing this set of slides titled Corporate Risk Metrics Dashboard And Control Dashboard With Expenditure Inspiration PDF. The topics addressed in these templates are Expenditure, Risk Management, Organization Risk. All the content presented in this PPT design is completely editable. Download it and make adjustments in color, background, font etc. as per your unique business setting.

Kaizen Process Report With Improvement Metrics Ppt PowerPoint Presentation File Icons PDF
This slide focuses on the kaizen event report which covers process owner, key performance indicators, summary, problem description, improvement metrics, goals, daily milestones, team members and other considerations, etc. Pitch your topic with ease and precision using this Kaizen Process Report With Improvement Metrics Ppt PowerPoint Presentation File Icons PDF. This layout presents information on Key Performance Indoctrinator, Improvement Goal, Improvement Metric. It is also available for immediate download and adjustment. So, changes can be made in the color, design, graphics or any other component to create a unique layout.

Key Tools To Enhance Owned Media Effectiveness Summary PDF
Following slide brings forth the major key performing indicators that can be used by digital marketers to measure the effectiveness of earned media strategies. Key elements consists of dimension, description, tools and key performing indicators metrics Showcasing this set of slides titled Key Tools To Enhance Owned Media Effectiveness Summary PDF. The topics addressed in these templates are Dimension, Description, Tools . All the content presented in this PPT design is completely editable. Download it and make adjustments in color, background, font etc. as per your unique business setting.

Internal Audit Metrics Dashboard And Status Ppt Layouts Graphic Images PDF
This slide covers the key performance indicator dashboard and status for internal audit. It includes information related to the audit status and risk rating. Pitch your topic with ease and precision using this Internal Audit Metrics Dashboard And Status Ppt Layouts Graphic Images PDF. This layout presents information on Audit Status, Risk Rating, Auditable Entry. It is also available for immediate download and adjustment. So, changes can be made in the color, design, graphics or any other component to create a unique layout.

Business Goals Employee Performance Measurement Strategy Matrix Summary PDF
This slide exhibits measurement strategy matrix to assure achievement of business goals and objectives. It includes various elements such as objectives, goals, KPIs, metrics and analysis segments. Presenting Business Goals Employee Performance Measurement Strategy Matrix Summary PDF to dispense important information. This template comprises five stages. It also presents valuable insights into the topics including Key Performance Indicators, Aim And Goals, Business Objective. This is a completely customizable PowerPoint theme that can be put to use immediately. So, download it and address the topic impactfully.
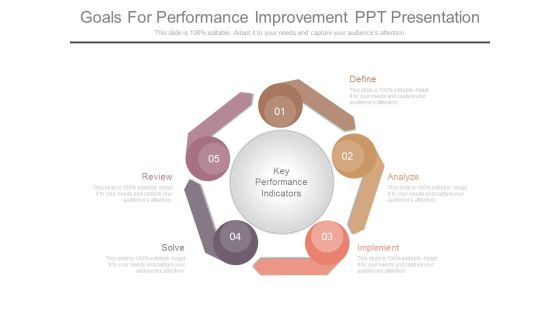
Goals For Performance Improvement Ppt Presentation
This is a goals for performance improvement ppt presentation. This is a five stage process. The stages in this process are key performance indicators, define, analyze, implement, solve, review.
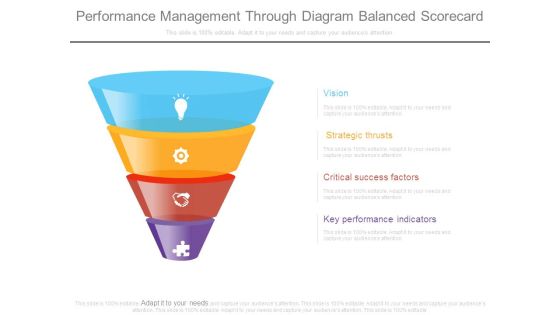
Performance Management Through Diagram Balanced Scorecard
This is a performance management through diagram balanced scorecard. This is a four stage process. The stages in this process are vision, strategic thrusts, critical success factors, key performance indicators.

Internal Promotion Strategy To Enhance Brand Awareness Internal Marketing Metrics To Track Annual Brochure PDF
This slide shows various key performance indicators to evaluate yearly performance of internal marketing. It includes comparison of actual and expected performance. If your project calls for a presentation, then Slidegeeks is your go to partner because we have professionally designed, easy to edit templates that are perfect for any presentation. After downloading, you can easily edit Internal Promotion Strategy To Enhance Brand Awareness Internal Marketing Metrics To Track Annual Brochure PDF and make the changes accordingly. You can rearrange slides or fill them with different images. Check out all the handy templates
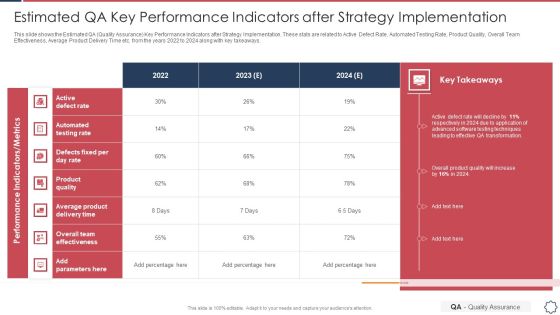
Quality Assurance Transformation Strategies To Improve Business Performance Efficiency Estimated QA Key Performance Topics PDF
This slide shows the Estimated QA Quality Assurance Key Performance Indicators after Strategy Implementation. These stats are related to Active Defect Rate, Automated Testing Rate, Product Quality, Overall Team Effectiveness, Average Product Delivery Time etc. from the years 2022 to 2024 along with key takeaways. Deliver and pitch your topic in the best possible manner with this quality assurance transformation strategies to improve business performance efficiency estimated qa key performance topics pdf. Use them to share invaluable insights on automated testing rate, average product delivery time, active defect rate and impress your audience. This template can be altered and modified as per your expectations. So, grab it now.

 Home
Home