Bar Graphics
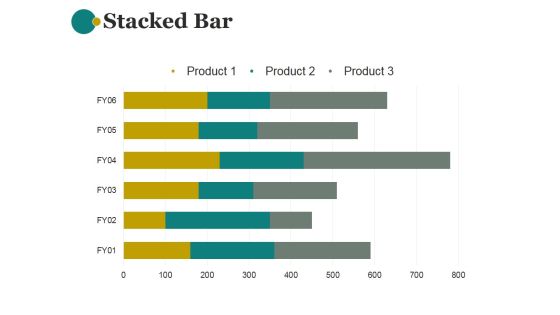
Stacked Bar Template 2 Ppt PowerPoint Presentation Rules
This is a stacked bar template 2 ppt powerpoint presentation rules. This is a three stage process. The stages in this process are product, planning ,business, management, strategy.
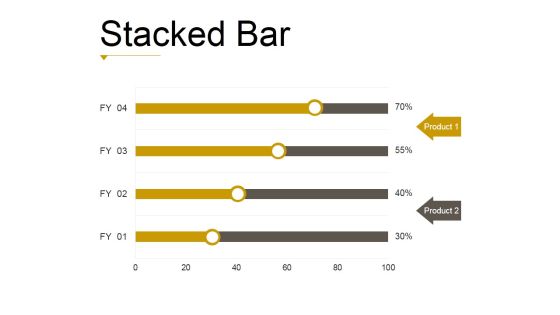
Stacked Bar Template 1 Ppt PowerPoint Presentation Gallery
This is a stacked bar template 1 ppt powerpoint presentation gallery. This is a four stage process. The stages in this process are business, strategy, analysis, marketing, finance.

Stacked Bar Template 2 Ppt PowerPoint Presentation Deck
This is a stacked bar template 2 ppt powerpoint presentation deck. This is a two stage process. The stages in this process are business, strategy, analysis, marketing, finance.

Bar Graph Ppt PowerPoint Presentation Outline Slide Download
This is a bar graph ppt powerpoint presentation outline slide download. This is a four stage process. The stages in this process are business, marketing, finance, timeline, growth.
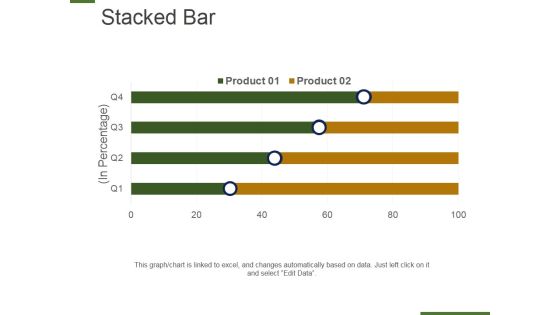
Stacked Bar Template 1 Ppt PowerPoint Presentation Show Smartart
This is a stacked bar template 1 ppt powerpoint presentation show smartart. This is a four stage process. The stages in this planning, management, strategy, marketing, business.
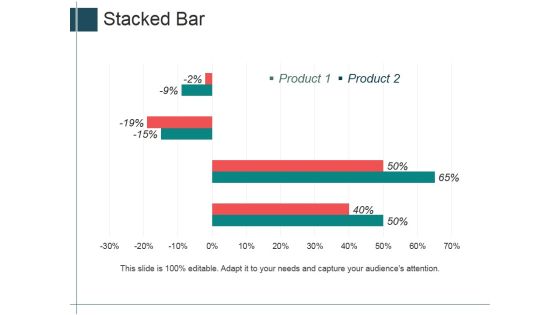
Stacked Bar Ppt PowerPoint Presentation Styles Designs Download
This is a stacked bar ppt powerpoint presentation styles designs download. This is a four stage process. The stages in this process are product, finance, percentage, business.

Clustered Bar Ppt Powerpoint Presentation Infographic Template Shapes
This is a clustered bar ppt powerpoint presentation infographic template shapes. This is a five stage process. The stages in this process are product, marketing, management.

Bar Chart Ppt PowerPoint Presentation Icon Infographic Template
This is a bar chart ppt powerpoint presentation icon infographic template. This is a nine stage process. The stages in this process are product, marketing, management, business, success.

Bar Chart Ppt PowerPoint Presentation Infographic Template Example
This is a bar chart ppt powerpoint presentation infographic template example. This is a seven stage process. The stages in this process are business, finance, marketing, percentage.

Stacked Bar Ppt PowerPoint Presentation Pictures Example Topics
This is a stacked bar ppt powerpoint presentation pictures example topics. This is a two stage process. The stages in this process are product, finance, business, marketing.

Bar Graph Ppt PowerPoint Presentation Styles File Formats
This is a bar graph ppt powerpoint presentation styles file formats. This is a four stage process. The stages in this process are percentage, business, marketing, finance, strategy.

Bar Graph Ppt PowerPoint Presentation Portfolio Example Topics
This is a bar graph ppt powerpoint presentation portfolio example topics. This is a four stage process. The stages in this process are business, marketing, management, success, planning.

Bar Diagram Ppt PowerPoint Presentation Ideas Infographic Template
This is a bar diagram ppt powerpoint presentation ideas infographic template. This is a four stage process. The stages in this process are business, finance, marketing, strategy, analysis.

Bar Chart Ppt PowerPoint Presentation Show Example File
This is a bar chart ppt powerpoint presentation show example file. This is a two stage process. The stages in this process are product, business, marketing, graph, percentage.
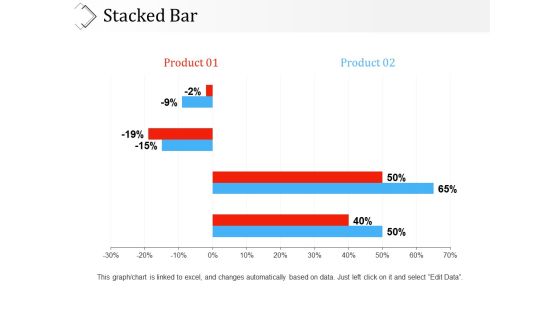
Stacked Bar Ppt PowerPoint Presentation Infographic Template Clipart
This is a stacked bar ppt powerpoint presentation infographic template clipart. This is a two stage process. The stages in this process are product, percentage, business, marketing, graph.
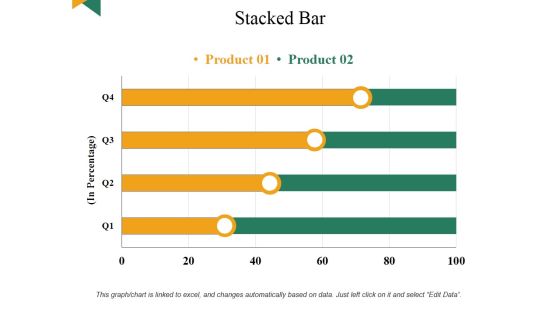
Stacked Bar Ppt PowerPoint Presentation Infographics Design Templates
This is a stacked bar ppt powerpoint presentation infographics design templates. This is a four stage process. The stages in this process are business, marketing, finance, analysis, planning.

Clustered Bar Ppt PowerPoint Presentation Infographic Template Grid
This is a clustered bar ppt powerpoint presentation infographic template grid. This is a two stage process. The stages in this process are finance, analysis, marketing, business, strategy.

Clustered Bar Ppt PowerPoint Presentation Infographics Example File
This is a clustered bar ppt powerpoint presentation infographics example file. This is a five stage process. The stages in this process are business, marketing, strategy, planning, finance.

Clustered Bar Ppt PowerPoint Presentation File Format Ideas
This is a clustered bar ppt powerpoint presentation file format ideas. This is a two stage process. The stages in this process are finance, marketing, strategy, planning, management.

Bar Chart Ppt PowerPoint Presentation Ideas Format Ideas
This is a bar chart ppt powerpoint presentation ideas format ideas. This is a four stage process. The stages in this process are finance, marketing, strategy, planning, management.

Bar Graph Finance Ppt PowerPoint Presentation Icon Good
This is a bar graph finance ppt powerpoint presentation icon good. This is a two stage process. The stages in this process are analysis, finance, marketing, management, investment.
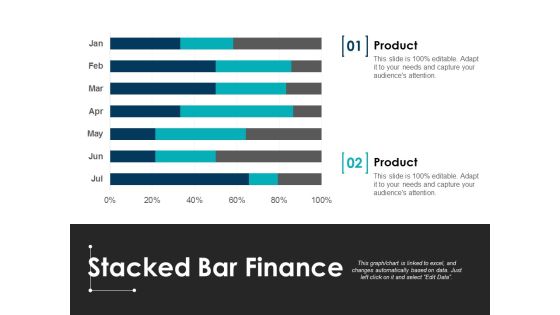
Stacked Bar Finance Ppt PowerPoint Presentation Styles Layout
This is a stacked bar finance ppt powerpoint presentation styles layout. This is a two stage process. The stages in this process are finance, marketing, management, investment, analysis.

Bar Graph Finance Ppt PowerPoint Presentation Pictures Elements
This is a bar graph finance ppt powerpoint presentation pictures elements. This is a three stage process. The stages in this process are finance, marketing, management, investment, analysis.
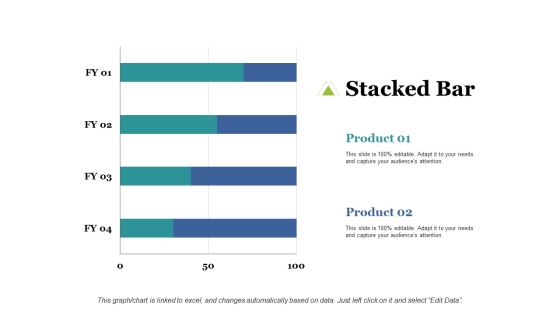
Stacked Bar Ppt PowerPoint Presentation Pictures Design Templates
This is a stacked bar ppt powerpoint presentation pictures design templates. This is a two stage process. The stages in this process are finance, marketing, management, investment, analysis.
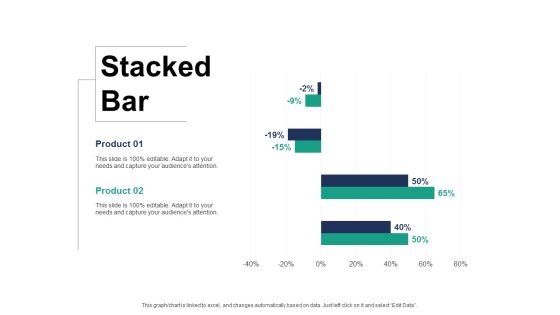
Stacked Bar Finance Ppt PowerPoint Presentation Infographics Grid
This is a stacked bar finance ppt powerpoint presentation infographics grid. This is a two stage process. The stages in this process are finance, marketing, management, investment, analysis.

Bar Chart Financial Ppt PowerPoint Presentation Pictures Files
This is a bar chart financial ppt powerpoint presentation pictures files. This is a five stage process. The stages in this process are finance, marketing, management, investment, analysis.
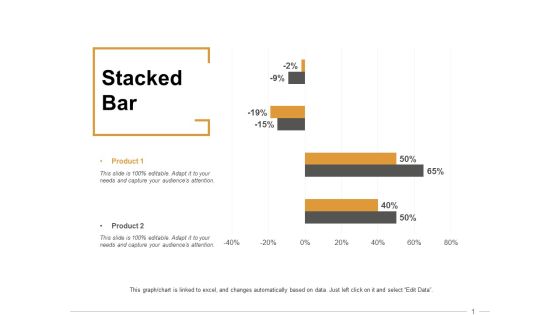
Stacked Bar Finance Ppt PowerPoint Presentation Infographics Outfit
This is a stacked bar finance ppt powerpoint presentation infographics outfit. This is a two stage process. The stages in this process are finance, marketing, management, investment, analysis.

Bar Chart Marketing Ppt PowerPoint Presentation Outline Deck
This is a bar chart marketing ppt powerpoint presentation outline deck. This is a two stage process. The stages in this process are business, management, marketing, financial, sales.

Clustered Bar Ppt PowerPoint Presentation Summary Infographic Template
This is a clustered bar ppt powerpoint presentation summary infographic template. This is a three stage process. The stages in this process are finance, marketing, management, investment, analysis.

Clustered Bar Chart Ppt PowerPoint Presentation Layouts Infographics
This is a clustered bar chart ppt powerpoint presentation layouts infographics. This is a three stage process. The stages in this process are finance, marketing, management, investment, analysis.

Stacked Bar Product Ppt PowerPoint Presentation Infographics Layout
This is a stacked bar product ppt powerpoint presentation infographics layout. This is a three stage process. The stages in this process are business, management, marketing, sales, financial.

Stacked Bar Finance Ppt PowerPoint Presentation Portfolio Influencers
This is a stacked bar finance ppt powerpoint presentation portfolio influencers. This is a two stage process. The stages in this process are finance, marketing, management, investment, analysis.

Clustered Bar Chart Ppt PowerPoint Presentation Professional Good
This is a clustered bar chart ppt powerpoint presentation professional good. This is a three stage process. The stages in this process are finance, marketing, management, investment, analysis.

Clustered Bar Chart Ppt PowerPoint Presentation Summary Templates
This is a clustered bar chart ppt powerpoint presentation summary templates. This is a three stage process. The stages in this process are finance, marketing, management, investment, analysis.

Clustered Bar Product Ppt PowerPoint Presentation Inspiration Templates
This is a clustered bar product ppt powerpoint presentation inspiration templates. This is a three stage process. The stages in this process are business, management, strategy, marketing, sales.

Clustered Bar Product Ppt PowerPoint Presentation Slides Examples
This is a clustered bar product ppt powerpoint presentation slides examples. This is a two stage process. The stages in this process are business, management, strategy, marketing, sales.

Bar Chart Slide Ppt PowerPoint Presentation Summary Example File
This is a bar chart slide ppt powerpoint presentation summary example file. This is a three stage process. The stages in this process are percentage, marketing, management, product.

Clustered Bar Finance Ppt PowerPoint Presentation Infographics Example
This is a clustered bar finance ppt powerpoint presentation infographics example. This is a three stage process. The stages in this process are finance, marketing, management, investment, analysis.
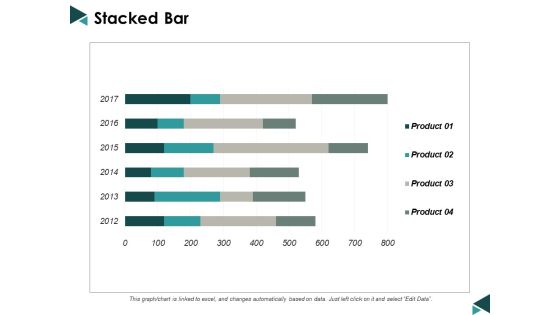
Stacked Bar Finance Ppt Powerpoint Presentation Infographics Example
This is a stacked bar finance ppt powerpoint presentation infographics example. This is a four stage process. The stages in this process are finance, marketing, management, investment, analysis.

stacked bar finance ppt powerpoint presentation file layouts
This is a stacked bar finance ppt powerpoint presentation file layouts. This is a three stage process. The stages in this process are finance, marketing, management, investment, analysis.

bar graph finance ppt powerpoint presentation portfolio summary
This is a bar graph finance ppt powerpoint presentation portfolio summary. This is a three stage process. The stages in this process are finance, marketing, management, investment, analysis.

Bar Chart Finance Ppt PowerPoint Presentation Portfolio Model
This is a bar chart finance ppt powerpoint presentation portfolio model. This is a two stage process. The stages in this process are finance, marketing, management, investment, analysis.

Stacked Bar Chart Ppt PowerPoint Presentation Gallery Outfit
This is a stacked bar chart ppt powerpoint presentation gallery outfit. This is a three stage process. The stages in this process are finance, marketing, management, investment, analysis.

Stacked Bar Finance Ppt PowerPoint Presentation Ideas Good
This is a stacked bar finance ppt powerpoint presentation ideas good. This is a three stage process. The stages in this process are finance, analysis, business, investment, marketing.

Bar Graph Chart Ppt PowerPoint Presentation Portfolio Templates
This is a bar graph chart ppt powerpoint presentation portfolio templates. This is a two stage process. The stages in this process are financial, minimum, medium, maximum.

Stacked Bar Investment Ppt PowerPoint Presentation File Picture
This is a stacked bar investment ppt powerpoint presentation file picture. This is a four stage process. The stages in this process are finance, analysis, business, investment, marketing.

Bar Graph Finance Ppt PowerPoint Presentation Summary Ideas
This is a bar graph finance ppt powerpoint presentation summary ideas. This is a three stage process. The stages in this process are finance, analysis, business, investment, marketing.

Clustered Bar Contribution Ppt PowerPoint Presentation Slides Example
This is a clustered bar contribution ppt powerpoint presentation slides example. This is a three stage process. The stages in this process are finance, business, management, strategy, analysis.

Bar Graph Product Ppt PowerPoint Presentation Layouts Ideas
This is a bar graph product ppt powerpoint presentation layouts ideas. This is a three stage process. The stages in this process are business, management, marketing, product, percentage.

Bar Chart Product Ppt PowerPoint Presentation Summary Diagrams
This is a bar chart product ppt powerpoint presentation summary diagrams. This is a three stage process. The stages in this process are business, management, marketing, percentage, product.
Stacked Bar Finance Icon Ppt PowerPoint Presentation Portfolio Tips
This is a stacked bar finance icon ppt powerpoint presentation portfolio tips. This is a three stage process. The stages in this process are finance, strategy, analysis, marketing.

Clustered Bar Product Ppt PowerPoint Presentation Inspiration Elements
This is a clustered bar product ppt powerpoint presentation inspiration elements. This is a three stage process. The stages in this process are percentage, product, business, management, marketing.

Clustered Bar Finance Ppt PowerPoint Presentation Model Grid
This is a clustered bar finance ppt powerpoint presentation model grid. This is a three stage process. The stages in this process are finance, marketing, management, investment.

Clustered Bar Financial Ppt PowerPoint Presentation Model Format
This is a clustered bar financial ppt powerpoint presentation model format. This is a three stage process. The stages in this process are business, management, marketing, percentage, product.

clustered bar marketing ppt powerpoint presentation outline example
This is a clustered bar marketing ppt powerpoint presentation outline example. This is a two stage process. The stages in this process are finance, marketing, management, investment, analysis.
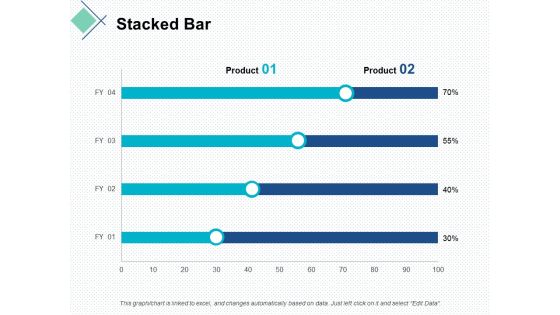
Stacked Bar Finance Ppt Powerpoint Presentation Portfolio Deck
This is a stacked bar finance ppt powerpoint presentation portfolio deck. This is a two stage process. The stages in this process are finance, marketing, management, investment, analysis.

Bar Graph Finance Ppt Powerpoint Presentation Layouts Mockup
This is a bar graph finance ppt powerpoint presentation layouts mockup. This is a three stage process. The stages in this process are finance, marketing, management, investment, analysis.

Stacked Bar Product Ppt PowerPoint Presentation Pictures Layout
This is a stacked bar product ppt powerpoint presentation pictures layout. This is a two stage process. The stages in this process are finance, marketing, management, investment, analysis.

Cluster Bar Investment Ppt PowerPoint Presentation Portfolio Elements
This is a cluster bar investment ppt powerpoint presentation portfolio elements. This is a three stage process. The stages in this process are finance, analysis, business, investment, marketing.

Clustered Bar Investment Ppt PowerPoint Presentation File Templates
This is a clustered bar investment ppt powerpoint presentation file templates. This is a three stage process. The stages in this process are finance, analysis, business, investment, marketing.

Clustered Bar Planning Ppt PowerPoint Presentation Layouts Demonstration
This is a clustered bar planning ppt powerpoint presentation layouts demonstration. This is a three stage process. The stages in this process are finance, analysis, business, investment, marketing.
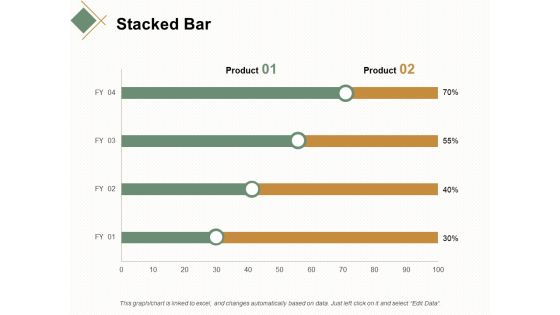
Stacked Bar Financial Management Ppt Powerpoint Presentation Outline Vector
This is a stacked bar financial management ppt powerpoint presentation outline vector. This is a two stage process. The stages in this process are finance, management, marketing.

Bar Graph Finance Ppt Powerpoint Presentation File Ideas
This is a bar graph finance ppt powerpoint presentation file ideas. This is a four stage process. The stages in this process are finance, marketing, management, investment, analysis.

Clustered Bar Management Ppt Powerpoint Presentation Inspiration Templates
This is a clustered bar management ppt powerpoint presentation inspiration templates. This is a three stage process. The stages in this process are finance, marketing, management, investment, analysis.

Bar Graph Finance Ppt PowerPoint Presentation Styles Slide
This is a bar graph finance ppt powerpoint presentation styles slide. This is a three stage process. The stages in this process are finance, marketing, management, investment, analysis.

Stacked Bar Finance Ppt PowerPoint Presentation File Influencers
This is a stacked bar finance ppt powerpoint presentation file influencers. This is a three stage process. The stages in this process are finance, marketing, management, investment, analysis.

Clustered Bar Finance Ppt PowerPoint Presentation Portfolio Gridlines
This is a clustered bar finance ppt powerpoint presentation portfolio gridlines. This is a three stage process. The stages in this process are finance, marketing, analysis, investment, million.
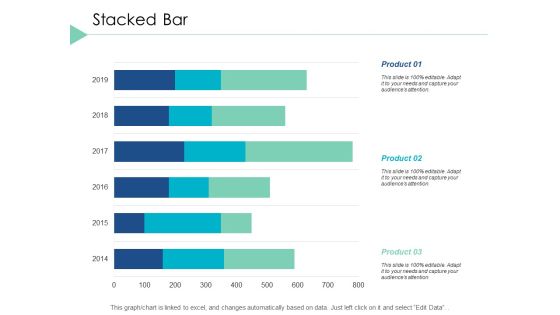
Stacked Bar Finance Ppt PowerPoint Presentation Infographics Guide
This is a stacked bar finance ppt powerpoint presentation infographics guide. This is a three stage process. The stages in this process are finance, marketing, analysis, investment, million.

Clustered Bar Graph Ppt PowerPoint Presentation Outline Layouts
This is a clustered bar graph ppt powerpoint presentation outline layouts. This is a three stage process. The stages in this process are finance, marketing, analysis, investment, million.

Pie Chart Bar Ppt PowerPoint Presentation Layouts Examples
This is a pie chart bar ppt powerpoint presentation layouts examples. This is a three stage process. The stages in this process are finance, marketing, analysis, investment, million.
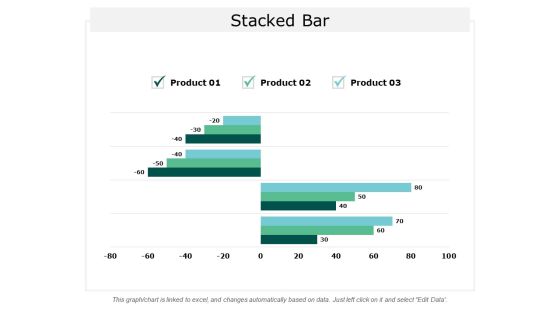
Stacked Bar Marketing Ppt Powerpoint Presentation Layouts Templates
This is a stacked bar marketing ppt powerpoint presentation layouts templates. This is a three stage process. The stages in this process are financial, marketing, analysis, investment, business.
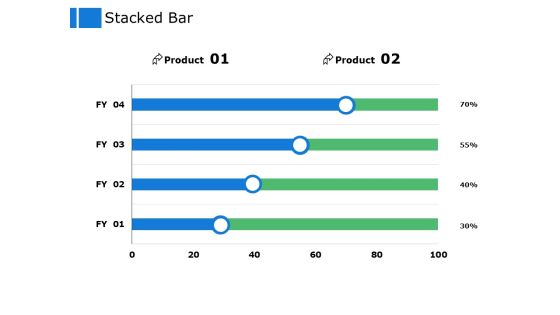
Stacked Bar Finance Ppt Powerpoint Presentation Pictures Clipart
This is a stacked bar finance ppt powerpoint presentation pictures clipart. This is a two stage process. The stages in this process are financial, marketing, analysis, investment, business.

Stacked Bar Finance Ppt PowerPoint Presentation Outline Vector
This is a stacked bar finance ppt powerpoint presentation outline vector. This is a three stage process. The stages in this process are finance, analysis, business, investment, marketing.
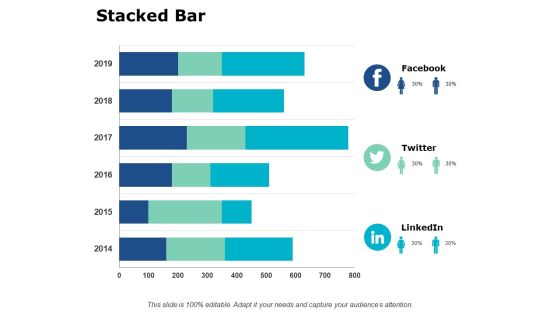
Stacked Bar Investment Ppt PowerPoint Presentation Gallery Infographics
This is a stacked bar investment ppt powerpoint presentation gallery infographics. This is a three stage process. The stages in this process are finance, analysis, business, investment, marketing.

Infographic Bar Chart For Business Practices Powerpoint Template
The PowerPoint template displays infographic of bar chart. This diagram has been professionally designed to display business practices. Grab centre stage with this diagram slide.

Bar Graph For Financial Statements Ppt PowerPoint Presentation Example
This is a bar graph for financial statements ppt powerpoint presentation example. This is a four stage process. The stages in this process are product version, finance, year.
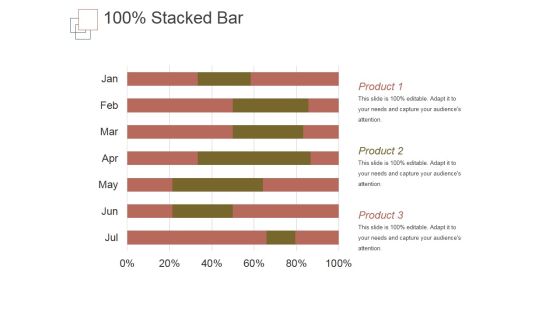
Stacked Bar Template 1 Ppt PowerPoint Presentation Themes
This is a stacked bar template 1 ppt powerpoint presentation themes. This is a six stage process. The stages in this process are product, business, marketing, success, management.

bar graph template 1 ppt powerpoint presentation infographics
This is a bar graph template 1 ppt powerpoint presentation infographics. This is a five stage process. The stages in this process are business, marketing, graph, analysis, growth.

bar graph template 2 ppt powerpoint presentation gallery
This is a bar graph template 2 ppt powerpoint presentation gallery. This is a four stage process. The stages in this process are business, marketing, product, analysis, growth.
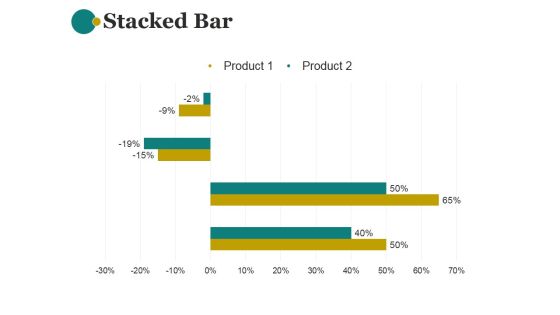
Stacked Bar Template 1 Ppt PowerPoint Presentation Show
This is a stacked bar template 1 ppt powerpoint presentation show. This is a two stage process. The stages in this process are product, planning ,business, management, strategy.

Stacked Bar Template Ppt PowerPoint Presentation Summary Visual Aids
This is a stacked bar template ppt powerpoint presentation summary visual aids. This is a three stage process. The stages in this process are unit count, business, marketing, finance, graph.

Bar Chart Ppt PowerPoint Presentation Visual Aids Diagrams
This is a bar chart ppt powerpoint presentation visual aids diagrams. This is a two stage process. The stages in this process are business, marketing, financial years, sales in percentage, graph.

Clustered Bar Finance Ppt Powerpoint Presentation Visual Aids Example File
This is a clustered bar finance ppt powerpoint presentation visual aids example file. This is a four stage process. The stages in this process are finance, marketing, management, investment, analysis.

Bar Plot For Data Visualization Ppt Powerpoint Presentation Pictures Guide
This is a bar plot for data visualization ppt powerpoint presentation pictures guide. This is a four stage process. The stages in this process are scatter plot, probability plots, plot diagram.

Bar Graph Ppt PowerPoint Presentation Visual Aids Model
This is a bar graph ppt powerpoint presentation visual aids model. This is a three stage process. The stages in this process are business, strategy, analysis, planning, sales in percentage.

Clustered Bar Finance Ppt PowerPoint Presentation Inspiration Visual Aids
This is a clustered bar finance ppt powerpoint presentation inspiration visual aids. The topics discussed in this diagram are marketing, business, management, planning, strategy This is a completely editable PowerPoint presentation, and is available for immediate download.

Circular Progress Bar Vector Icon Ppt PowerPoint Presentation Pictures
Presenting this set of slides with name circular progress bar vector icon ppt powerpoint presentation pictures. This is a three stage process. The stages in this process are circular progress bar vector icon. This is a completely editable PowerPoint presentation and is available for immediate download. Download now and impress your audience.
Sand Clock With Waiting Bar Vector Icon Ppt Pictures PDF
Presenting sand clock with waiting bar vector icon ppt pictures pdf to dispense important information. This template comprises three stages. It also presents valuable insights into the topics including sand clock with waiting bar vector icon. This is a completely customizable PowerPoint theme that can be put to use immediately. So, download it and address the topic impactfully.

Bar Chart Icon For Financial Ratios Comparison Elements PDF
Presenting bar chart icon for financial ratios comparison elements pdf to dispense important information. This template comprises four stages. It also presents valuable insights into the topics including bar chart icon for financial ratios comparison. This is a completely customizable PowerPoint theme that can be put to use immediately. So, download it and address the topic impactfully.

Bar Chart Icon Representing Trend Growth Information PDF
Presenting Bar Chart Icon Representing Trend Growth Information PDF to dispense important information. This template comprises Four stages. It also presents valuable insights into the topics including Bar Chart, Icon Representing, Trend Growth This is a completely customizable PowerPoint theme that can be put to use immediately. So, download it and address the topic impactfully.

Icon Depicting Energy Consumption Statistics Bar Graph Sample PDF
Presenting Icon Depicting Energy Consumption Statistics Bar Graph Sample PDF to dispense important information. This template comprises three stages. It also presents valuable insights into the topics including Icon Depicting, Energy Consumption Statistics, Bar Graph. This is a completely customizable PowerPoint theme that can be put to use immediately. So, download it and address the topic impactfully.
Human Resource Metrics Icon With Bar Chart Elements PDF
Presenting Human Resource Metrics Icon With Bar Chart Elements PDF to dispense important information. This template comprises three stages. It also presents valuable insights into the topics including Human Resource Metrics Icon, Bar Chart. This is a completely customizable PowerPoint theme that can be put to use immediately. So, download it and address the topic impactfully.

Employee Quarter Wise Performance Analysis Bar Chart Icon Guidelines PDF
Presenting Employee Quarter Wise Performance Analysis Bar Chart Icon Guidelines PDF to dispense important information. This template comprises four stages. It also presents valuable insights into the topics including Employee Quarter Wise, Performance Analysis, Bar Chart Icon. This is a completely customizable PowerPoint theme that can be put to use immediately. So, download it and address the topic impactfully.
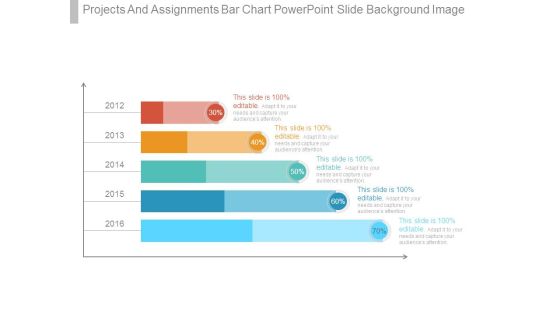
Projects And Assignments Bar Chart Powerpoint Slide Background Image
This is a projects and assignments bar chart powerpoint slide background image. This is a five stage process. The stages in this process are finance, presentation, business, strategy, marketing.

Hiring Plan Bar Chart Powerpoint Slide Background Image
This is a hiring plan bar chart powerpoint slide background image. This is a five stage process. The stages in this process are engineering, sales, marketing, product, support, finance.

Sales Growth Bar Graph Ppt PowerPoint Presentation Background Image
This is a sales growth bar graph ppt powerpoint presentation background image. This is a five stage process. The stages in this process are arrows, success, business, marketing, process.

Bar Chart Ppt PowerPoint Presentation Pictures Background Image
This is a bar chart ppt powerpoint presentation pictures background image. This is a seven stage process. The stages in this process are financial years, sales in percentage, graph, business.

Stacked Bar Ppt PowerPoint Presentation Portfolio Background Image
This is a two stacked bar ppt powerpoint presentation portfolio background image. This is a two stage process. The stages in this process are sales in percentage, graph, business, marketing, strategy.

Bar Chart Ppt PowerPoint Presentation Inspiration Background Image
This is a bar chart ppt powerpoint presentation inspiration background image. This is a two stage process. The stages in this process are business, marketing, strategy, finance, in years, in percentage.

Clustered Bar Ppt PowerPoint Presentation Pictures Clipart Images
This is a clustered bar ppt powerpoint presentation pictures clipart images. This is a three stage process. The stages in this process are business, marketing, graph, finance, strategy, unit count.

Bar Chart Finance Ppt PowerPoint Presentation Infographics Background Images
This is a bar chart finance ppt powerpoint presentation infographics background images. This is a seven stages process. The stages in this process are alpha testing, beta testing, full scale show.

Clustered Bar Finance Ppt PowerPoint Presentation Gallery Background Images
This is a clustered bar finance ppt powerpoint presentation gallery background images. This is a four stage process. The stages in this process are finance, marketing, analysis, business, investment.

Clustered Bar Finance Ppt PowerPoint Presentation Show Background Image
This is a clustered bar finance ppt powerpoint presentation show background image. This is a two stage process. The stages in this process are finance, analysis, business, investment, marketing.

Financial Crisis Bar Graphs Ppt PowerPoint Presentation Background Images
This is a financial crisis bar graphs ppt powerpoint presentation background images. This is a twelve stage process. The stages in this process are business, analysis, strategy, finance, success, management.

Business And Strategy Display Results With Grass Bar Chart Images
Analyze Ailments On Our business and strategy display results with grass bar chart images Powerpoint Templates. Bring Out The Thinking Doctor In You. Dock Your Thoughts With Our Agriculture Powerpoint Templates. They Will Launch Them Into Orbit.

Stock Photo Image Of Business Bar Graph PowerPoint Template
Plan Your Storyboard With Our stock photo Image Of Business Bar Graph powerpoint template Powerpoint Templates. Give An Outline To The Solutions You Have. Give Power To Your Elbow With Our finance Powerpoint Templates. Get That Extra Information You Need.

Bar Chart Finance Marketing Ppt PowerPoint Presentation Diagram Images
This is a bar chart finance marketing ppt powerpoint presentation diagram images. The topics discussed in this diagram are finance, marketing, management, investment, analysis. This is a completely editable PowerPoint presentation, and is available for immediate download.

Stock Photo Red Growth Arrow On Bar Graph PowerPoint Slide
Explain the concepts of business growth with this unique image. This image has been designed with red growth arrow on bar graph. Use this image in business and finance related topics
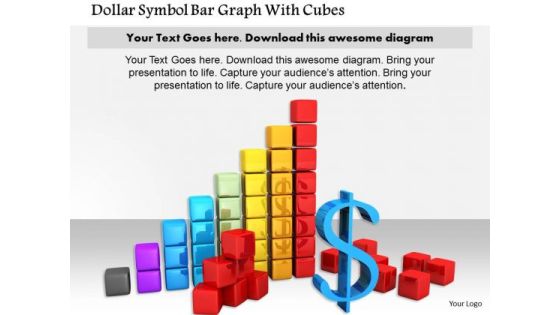
Stock Photo Dollar Symbol Bar Graph With Cubes PowerPoint Slide
This image slide contains bar graph of cubes with dollar symbol. This image is designed with dollar growth graph. Use this slide to display growth of profit in business presentations. Make an impressive presentation by using this image.

Stock Photo Bar Graph With Growth Arrow PowerPoint Slide
This creative image displays design of Bar Graph with Growth Arrow. This image has been designed to depict business on an Upward Trend. Create an impact with this quality image and make professional presentations.

Colorful Bar Graph Business PowerPoint Templates And PowerPoint Themes 0512
Colorful Bar Graph Business PowerPoint Templates And PowerPoint Themes 0512-Microsoft Powerpoint Templates and Background with bar chart growth-These high quality PowerPoint templates and PowerPoint images are carefully selected by our team of professionals to convey your ideas in a visually appealing manner. Each download contains a text and print slide. The text and print slides show up automatically when you insert a new slide in the downloaded template

Cylinderical Bar Graph Business PowerPoint Templates And PowerPoint Themes 0512
Cylinderical Bar Graph Business PowerPoint Templates And PowerPoint Themes 0512-Microsoft Powerpoint Templates and Background with bar graph-These high quality PowerPoint templates and PowerPoint images are carefully selected by our team of professionals to convey your ideas in a visually appealing manner. Each download contains a text and print slide. The text and print slides show up automatically when you insert a new slide in the downloaded template
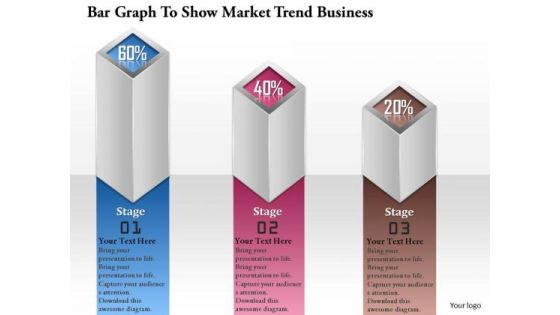
Consulting Slides Bar Graph To Show Market Trend Business Presentation
This bar graph can be very useful in presentations where you need to market trend. This can be used as a visualization tool because the audience can get a better view about what you want to show.

Bar Graph On Blackboard For Growth Analysis Powerpoint Template
Visually support your presentation with our above template containing bar graph on blackboard. This PowerPoint template helps to display growth analysis. Etch your views in the brains of your audience with this diagram slide.

Bar Graph With Financial Ratio And Icons Powerpoint Template
Visually support your presentation with our above template containing bar graph with icons. This diagram slide helps to exhibit financial ratio analysis. Etch your views in the brains of your audience with this diagram slide.

Bar Graph Of Lego Blocks For Data Analysis Powerpoint Slides
This PowerPoint template contains bar graph made of Lego blocks. You may use this slide to display growth process. This diagram provides an effective way of displaying information you can edit text, color, shade and style as per you need.
Four Pencils Bar Graph And Icons Powerpoint Template
Develop competitive advantage with our above template which contains a diagram of five pencils bar graph. This diagram provides an effective way of displaying business information. You can edit text, color, shade and style as per you need.

Bar Graph For Marketing Research Data Powerpoint Slides
This PowerPoint template has been designed with diagram of bar graph. This PPT slide can be used to prepare presentations for profit growth report and also for financial data analysis. You can download finance PowerPoint template to prepare awesome presentations.

Bar Graph For Marketing Research Process Powerpoint Slides
This PowerPoint template has been designed with diagram of bar graph. This PPT slide can be used to prepare presentations for profit growth report and also for financial data analysis. You can download finance PowerPoint template to prepare awesome presentations.

Bar Graph For Year Based Analysis Powerpoint Slides
This PowerPoint template has been designed with year based bar graph. This diagram may be used to display yearly statistical analysis. Use this PPT slide design to make impressive presentations.

Bar Graph For Profit Growth Analysis Powerpoint Slides
This PowerPoint template has been designed with bar graph with percentage values. This diagram is useful to exhibit profit growth analysis. This diagram slide can be used to make impressive presentations.

Bar Graph For Yearly Statistical Analysis Powerpoint Slides
This PowerPoint template has been designed with bar graph. This PowerPoint diagram is useful to exhibit yearly statistical analysis. This diagram slide can be used to make impressive presentations.

Five Steps Bar Graph For Financial Management Powerpoint Slides
This PowerPoint template has been designed with five steps bar graph and icons. This diagram is useful to exhibit financial management. This diagram slide can be used to make impressive presentations.
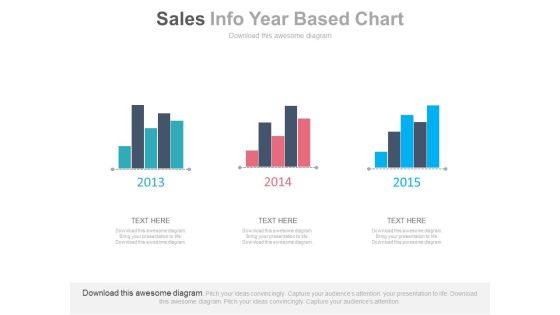
Three Years Sales Data Bar Graph Powerpoint Slides
This PowerPoint template has been designed with bar charts. This business slide may be used to display three years sales data for comparison. Present your views and ideas with this impressive design.

Bar Graph For Data Distribution And Analysis Powerpoint Slides
This PowerPoint template has been designed with bar graph. This PowerPoint diagram is useful for data distribution and analysis This diagram slide can be used to make impressive presentations.

Bar Graph With Increasing Percentage Flow Powerpoint Slides
This PowerPoint slide has been designed with bar graph and increasing percentage values. This diagram slide may be used to display profit growth. Prove the viability of your ideas with this professional slide.

Board With Bar Graph For Financial Analysis Powerpoint Slides
You can download this PowerPoint template to display statistical data and analysis. This PPT slide contains display board with bar graph. Draw an innovative business idea using this professional diagram.
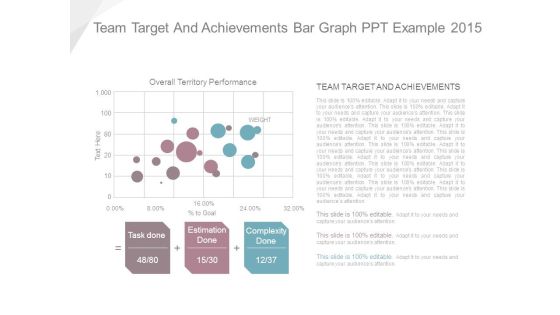
Team Target And Achievements Bar Graph Ppt Example 2015
This is a team target and achievements bar graph ppt example 2015. This is a three stage process. The stages in this process are task done, estimation done, complexity done, overall territory performance, team target and achievements.

Stacked Bar Template 1 Ppt PowerPoint Presentation Layouts Templates
This is a stacked bar template 1 ppt powerpoint presentation layouts templates. This is a two stage process. The stages in this process are product, unit count, business, marketing.
Stacked Bar Template 2 Ppt PowerPoint Presentation Icon Pictures
This is a stacked bar template 2 ppt powerpoint presentation icon pictures. This is a four stage process. The stages in this process are product, percentage, finance, business, marketing.

Stacked Bar Template 1 Ppt PowerPoint Presentation Ideas Design Templates
This is a stacked bar template 1 ppt powerpoint presentation ideas design templates. This is a two stage process. The stages in this process are product, finance, percentage, business, marketing.

Bar Chart Ppt PowerPoint Presentation Slides Example File
This is a bar chart ppt powerpoint presentation slides example file. This is a two stage process. The stages in this process are product, financial years, sales in percentage.

Clustered Bar Chart Finance Ppt PowerPoint Presentation Icon Tips
This is a clustered bar chart finance ppt powerpoint presentation icon tips. This is a two stage process. The stages in this process are analysis, finance, marketing, management, investment.

Product Comparison Data Bar Graph Ppt Powerpoint Presentation Slides Show
This is a product comparison data bar graph ppt powerpoint presentation slides show. This is a four stage process. The stages in this process are data presentation, content presentation, information presentation.

Bar Graph For Business Growth Steps Powerpoint Slides
This PowerPoint template contains design of bar graph with icons. You may download this slide to display strategy steps for business growth. You can easily customize this template to make it more unique as per your need.

Bar Graph With Line Chart For Analysis Powerpoint Slides
This PowerPoint template contains design of bar graph with line chart. You may download this slide to display strategy steps for business growth. You can easily customize this template to make it more unique as per your need.

Bar Graph With Yearly Statistical Analysis Powerpoint Slides
This PowerPoint template contains diagram of bar graph with yearly percentage ratios. You may download this slide to display statistical analysis. You can easily customize this template to make it more unique as per your need.

Bar Graph Infographics With Success Arrow Powerpoint Slides
This PowerPoint template has been designed with bar graph with success arrow. You may use this PPT slide to display goal achievement and planning. Impress your audiences by using this PPT slide.
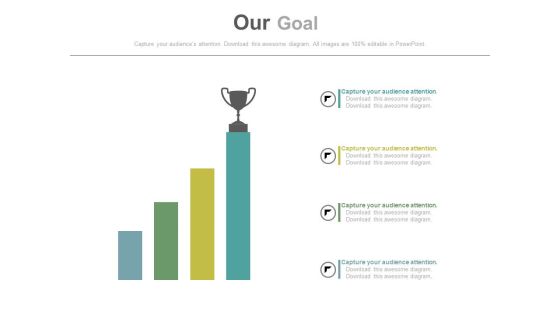
Growth Bar Graph With Trophy On Top Powerpoint Slides
This PowerPoint template has been designed with growth bar graph and trophy onto of it. Download this PPT slide to define and achieve goals with more success. This diagram may be used for goal planning related topics.
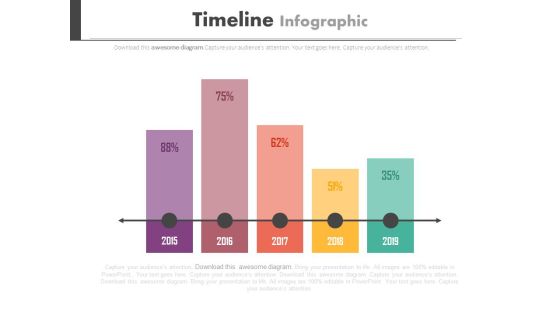
Timeline Bar Graph For Yearly Planning Powerpoint Slides
This PowerPoint template has been designed with timeline bar graph. You may download this timeline diagram slide to display long term planning for business. Chart the course you intend to take with this slide.

Projects And Assignments Bar Graph Ppt Sample Download
This is a projects and assignments bar graph ppt sample download. This is a five stage process. The stages in this process are business, process, marketing, strategy, graph chart, management.

Bar Graph For Changes In Competitive Environment Example Of Ppt
This is a bar graph for changes in competitive environment example of ppt. This is a four stage process. The stages in this process are engagement, brand, monthly, weekly.

Changes In Competitive Environment Bar Chart Sample Of Ppt Presentation
This is a changes in competitive environment bar chart sample of ppt presentation. This is a four stage process. The stages in this process are engagement, brand, monthly, weekly.
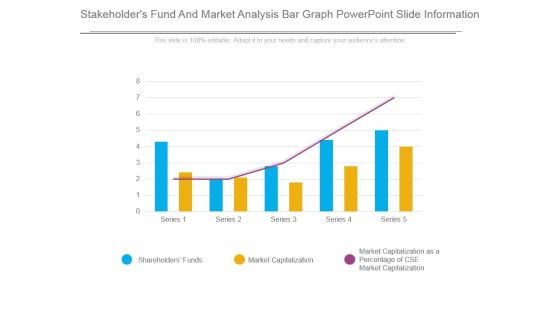
Stakeholders Fund And Market Analysis Bar Graph Powerpoint Slide Information
This is a stakeholders fund and market analysis bar graph powerpoint slide information. This is a five stage process. The stages in this process are shareholders funds, market capitalization, market capitalization as a percentage of cse market capitalization.
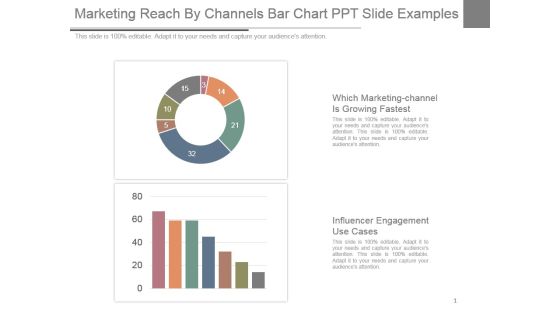
Marketing Reach By Channels Bar Chart Ppt Slide Examples
This is a marketing reach by channels bar chart ppt slide examples. This is a two stage process. The stages in this process are which marketing-channel is growing fastest, influencer engagement use cases.
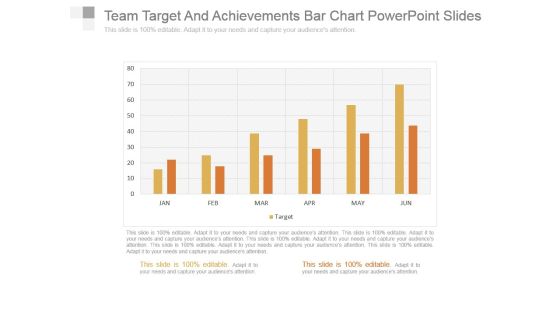
Team Target And Achievements Bar Chart Powerpoint Slides
This is a team target and achievements bar chart powerpoint slides. This is a six stage process. The stages in this process are business, success, graph chart, strategy, marketing.
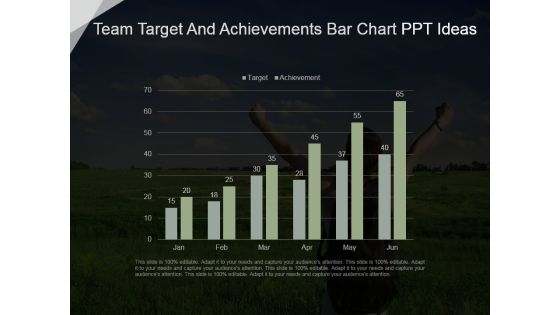
Team Target And Achievements Bar Chart Ppt Ideas
This is a team target and achievements bar chart ppt ideas. This is a six stage process. The stages in this process are business, marketing, graph chart, success, strategy.

Inflation Rate Analysis Bar Graph Powerpoint Slide Backgrounds
This is a inflation rate analysis bar graph powerpoint slide backgrounds. This is a twelve stage process. The stages in this process are jan, feb, mar, apr, may, jun, jul, aug, sep, oct, nov, dec.
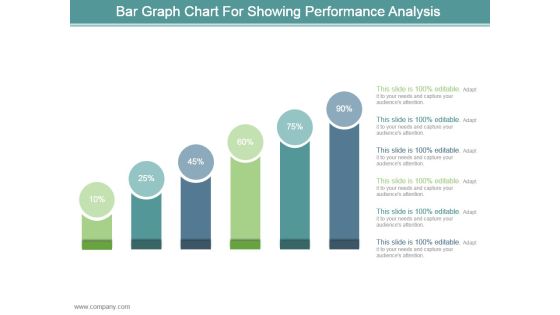
Bar Graph Chart For Showing Performance Analysis Ppt Design
This is a bar graph chart for showing performance analysis ppt design. This is a six stage process. The stages in this process are business, marketing, process, success, presentation.

Bar Graph For Descriptive Analysis Ppt PowerPoint Presentation Shapes
This is a bar graph for descriptive analysis ppt powerpoint presentation shapes. This is a five stage process. The stages in this process are icons, business, marketing, management, process.

Bar Graph To Showcase Financial Analysis Ppt PowerPoint Presentation Professional
This is a bar graph to showcase financial analysis ppt powerpoint presentation professional. This is a four stage process. The stages in this process are business, marketing, growth, success, arrows.

Magnifier With Tools And Bar Graph Ppt PowerPoint Presentation Diagrams
This is a magnifier with tools and bar graph ppt powerpoint presentation diagrams. This is a four stage process. The stages in this process are magnifier, strategy, search, business, management.

Bar Graph Ppt PowerPoint Presentation Infographic Template Background
This is a bar graph ppt powerpoint presentation infographic template background. This is a four stage process. The stages in this process are business, strategy, analysis, growth, chart and graph.

Bar Graph Ppt PowerPoint Presentation Summary Infographic Template
This is a bar graph ppt powerpoint presentation summary infographic template. This is a seven stage process. The stages in this process are business, strategy, marketing, analysis, growth strategy.

Clustered Bar Template 2 Ppt PowerPoint Presentation Infographic Template Information
This is a clustered bar template 2 ppt powerpoint presentation infographic template information. This is a four stage process. The stages in this process are business, management, planning, strategy, marketing.

Bar Graph Template 2 Ppt PowerPoint Presentation Ideas Files
This is a bar graph template 2 ppt powerpoint presentation ideas files. This is a five stage process. The stages in this process are in percentage, business, marketing, finance, graph.

Clustered Bar Ppt PowerPoint Presentation Show Slide Portrait
This is a clustered bar ppt powerpoint presentation show slide portrait. This is a four stage process. The stages in this process are product, unit count, graph, business, marketing.
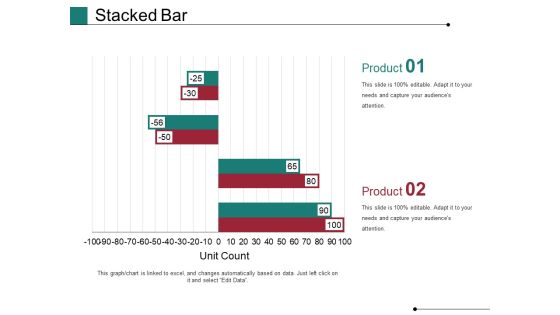
Stacked Bar Template 1 Ppt PowerPoint Presentation Show Slides
This is a stacked bar template 1 ppt powerpoint presentation show slides. This is a two stage process. The stages in this process are Unit Count, Business, Marketing, Graph, Finance.
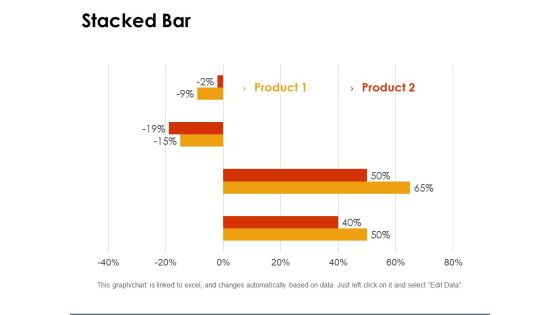
Stacked Bar Template 1 Ppt PowerPoint Presentation Gallery Clipart
This is a stacked bar template 1 ppt powerpoint presentation gallery clipart. This is a two stage process. The stages in this process are percentage, graph, business, marketing, finance.

Stacked Bar Ppt PowerPoint Presentation Styles Slide Portrait
This is a stacked bar ppt powerpoint presentation styles slide portrait. This is a three stage process. The stages in this process are unit count, business, marketing, strategy, graph, finance.
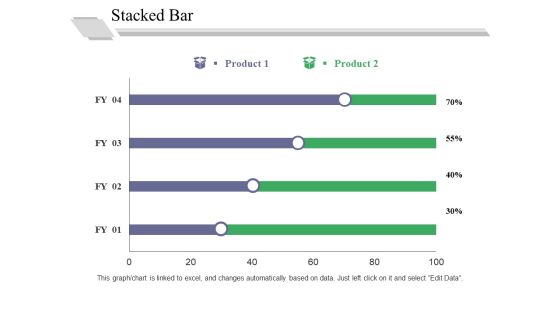
Stacked Bar Template 1 Ppt PowerPoint Presentation Outline Good
This is a stacked bar template 1 ppt powerpoint presentation outline good. This is a two stage process. The stages in this process are in percentage, business, marketing, graph, strategy.

Clustered Bar Ppt PowerPoint Presentation Outline Slide Download
This is a clustered bar ppt powerpoint presentation outline slide download. This is a three stage process. The stages in this process are unit count, finance, marketing, business, graph.
Stacked Bar Template 1 Ppt PowerPoint Presentation Icon Portfolio
This is a stacked bar template 1 ppt powerpoint presentation icon portfolio. This is a two stage process. The stages in this process are business, marketing, finance, graph, strategy.
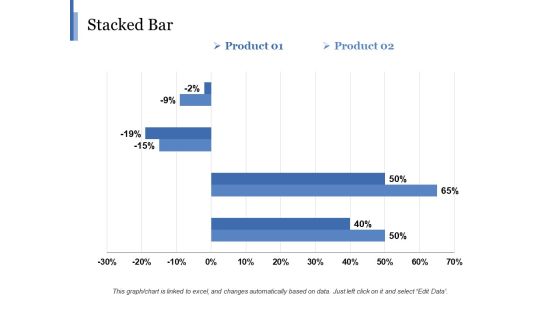
Stacked Bar Template 2 Ppt PowerPoint Presentation Gallery Background
This is a stacked bar template 2 ppt powerpoint presentation gallery background. This is a two stage process. The stages in this process are business, marketing, finance, graph, strategy, percentage.

Bar Chart Ppt PowerPoint Presentation Summary File Formats
This is a bar chart ppt powerpoint presentation summary file formats. This is a two stage process. The stages in this process are business, finance, financial years, sales in percentage, graph.

Clustered Bar Finance Ppt PowerPoint Presentation Summary Example Topics
This is a clustered bar finance ppt powerpoint presentation summary example topics. This is a three stage process. The stages in this process are finance, marketing, management, investment, analysis.

Clustered Bar Graph Ppt PowerPoint Presentation Pictures Example File
This is a clustered bar graph ppt powerpoint presentation pictures example file. This is a two stage process. The stages in this process are finance, marketing, management, investment, analysis.

Bar Graph Financial Sales Product Ppt PowerPoint Presentation Icon Vector
This is a bar graph financial sales product ppt powerpoint presentation icon vector. This is a five stage process. The stages in this process are business, management, financial, marketing, sales.

Bar Chart Finance Ppt PowerPoint Presentation Model Master Slide
This is a bar chart finance ppt powerpoint presentation model master slide. This is a two stage process. The stages in this process are finance, marketing, management, investment, analysis.

Bar Graph Finance Ppt PowerPoint Presentation Infographics Background Designs
This is a bar graph finance ppt powerpoint presentation infographics background designs. This is a two stage process. The stages in this process are finance, analysis, business, investment, marketing.

Bar Graph Finance Ppt PowerPoint Presentation Infographics Designs Download
This is a bar graph finance ppt powerpoint presentation infographics designs download. This is a three stage process. The stages in this process are finance, marketing, management, investment, analysis.

Clustered Bar Finance Ppt PowerPoint Presentation Icon Infographic Template
This is a clustered bar finance ppt powerpoint presentation icon infographic template. This is a three stage process. The stages in this process are finance, analysis, business, investment, marketing.

Clustered Bar Finance Marketing Ppt PowerPoint Presentation Outline Professional
This is a clustered bar finance marketing ppt powerpoint presentation outline professional. This is a three stage process. The stages in this process are finance, analysis, business, investment, marketing.

Clustered Bar Financial Chart Ppt PowerPoint Presentation File Design Ideas
This is a clustered bar financial chart ppt powerpoint presentation file design ideas. This is a three stage process. The stages in this process are column chart, financial, business, marketing, planning, strategy.

Clustered Bar Chart Finance Ppt PowerPoint Presentation Summary Layouts
This is a clustered bar chart finance ppt powerpoint presentation summary layouts. This is a two stage process. The stages in this process are finance, marketing, management, investment, analysis.

Bar Graph Employee Value Proposition Ppt PowerPoint Presentation File Layout
This is a bar graph employee value proposition ppt powerpoint presentation file layout. This is a three stage process. The stages in this process are business, management, strategy, analysis, marketing.

Clustered Bar Risk Estimator Ppt PowerPoint Presentation Layouts Mockup
This is a clustered bar risk estimator ppt powerpoint presentation layouts mockup. This is a four stage process. The stages in this process are business, management, strategy, analysis, marketing.

Stacked Bar Risk Estimator Ppt PowerPoint Presentation Gallery Design Templates
This is a stacked bar risk estimator ppt powerpoint presentation gallery design templates. This is a four stage process. The stages in this process are business, management, strategy, analysis, marketing.

Project Status Bar Chart Ppt PowerPoint Presentation Ideas Objects
This is a project status bar chart ppt powerpoint presentation ideas objects. This is a four stage process. The stages in this process are project management, project progress, project growth.

Clustered Bar Finance Marketing Ppt PowerPoint Presentation Model Deck
This is a clustered bar finance marketing ppt powerpoint presentation model deck. This is a three stage process. The stages in this process are finance, marketing, analysis, business, investment.

 Home
Home