Bar Graphics
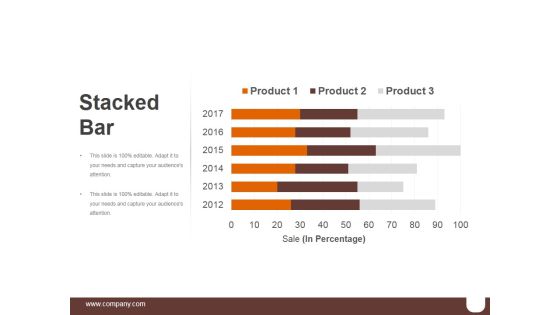
Stacked Bar Ppt PowerPoint Presentation Model
This is a stacked bar ppt powerpoint presentation model. This is a six stage process. The stages in this process are finance, analysis, business, marketing, strategy.

Bar Chart Ppt PowerPoint Presentation Styles
This is a bar chart ppt powerpoint presentation styles. This is a nine stage process. The stages in this process are business, management, sales in percentage, growth.

Bar Graph Ppt PowerPoint Presentation Pictures Display
This is a bar graph ppt powerpoint presentation pictures display. This is a one stage process. The stages in this process are sales in percentage, financial year.

Bar Graph Ppt PowerPoint Presentation Slides Format
This is a bar graph ppt powerpoint presentation slides format. This is a two stage process. The stages in this process are business, marketing, growth, planning, sales plan.

Bar Graph Ppt PowerPoint Presentation Ideas Diagrams
This is a bar graph ppt powerpoint presentation ideas diagrams. This is a twelve stage process. The stages in this process are jan, feb, mar, apr, may, growth.

Bar Chart Ppt PowerPoint Presentation Show Show
This is a bar chart ppt powerpoint presentation show show. This is a nine stage process. The stages in this process are business, marketing, chart, growth.

Bar Graph Ppt PowerPoint Presentation Model Templates
This is a bar graph ppt powerpoint presentation model templates. This is a eight stage process. The stages in this process are graph, business, finance, growth, marketing.

Bar Graph Ppt PowerPoint Presentation Outline Influencers
This is a bar graph ppt powerpoint presentation outline influencers. This is a four stage process. The stages in this process are business, marketing, management, growth.

Bar Graph Ppt PowerPoint Presentation Gallery Outline
This is a bar graph ppt powerpoint presentation gallery outline. This is a five stage process. The stages in this process are business, marketing, strategy, growth, success.

Bar Graph Ppt PowerPoint Presentation Outline Backgrounds
This is a bar graph ppt powerpoint presentation outline backgrounds. This is a five stage process. The stages in this process are planning, marketing, business, management, strategy.

Bar Graph Ppt PowerPoint Presentation Gallery Good
This is a bar graph ppt powerpoint presentation gallery good. This is a seven stage process. The stages in this process are graph, finance, business, marketing.

Bar Graph Ppt Powerpoint Presentation Show Backgrounds
This is a bar graph ppt powerpoint presentation show backgrounds. This is a four stage process. The stages in this process are graph, finance, marketing, management, business.

Bar Chart Ppt PowerPoint Presentation File Skills
This is a bar chart ppt powerpoint presentation file skills. This is a nine stage process. The stages in this process are business, marketing, growth, finance, management.

Bar Graph Ppt Powerpoint Presentation Slides Example
This is a bar graph ppt powerpoint presentation slides example. This is a five stage process. The stages in this process are graph, business, marketing, finance.

Bar Graph Ppt PowerPoint Presentation File Show
This is a bar graph ppt powerpoint presentation file show. This is a four stage process. The stages in this process are business, marketing, graph, growth, finance.

Bar Graph Ppt PowerPoint Presentation Layouts Gridlines
This is a bar graph ppt powerpoint presentation layouts gridlines. this is a three stage process. The stages in this process are product, percentage, business, marketing, management.

Bar Graph Ppt PowerPoint Presentation Inspiration Microsoft
This is a bar graph ppt powerpoint presentation inspiration microsoft. This is a five stage process. The stages in this process are business, marketing, graph, management, growth.

Bar Graph Ppt Powerpoint Presentation Model Topics
This is a bar graph ppt powerpoint presentation model topics. This is a twelve stage process. The stages in this process are jan, feb, mar, mar, apr.

Bar Graph Ppt Powerpoint Presentation Outline Shapes
This is a bar graph ppt powerpoint presentation outline shapes. This is a four stage process. The stages in this process are product, graph, finance, marketing, business.

Bar Graph Ppt PowerPoint Presentation Pictures Templates
This is a bar graph ppt powerpoint presentation pictures templates. This is a one stage process. The stages in this process are business, marketing, graph, management, growth.

Clustered Bar Ppt PowerPoint Presentation Portfolio Clipart
This is a clustered bar ppt powerpoint presentation portfolio clipart. This is a four stage process. The stages in this process are business, strategy, analysis, planning, unit count.

Bar Graph Ppt PowerPoint Presentation Gallery Inspiration
This is a bar graph ppt powerpoint presentation gallery inspiration. This is a three stage process. The stages in this process are product, sales in percentage, finance, success.

Clustered Bar Ppt PowerPoint Presentation Professional Objects
This is a clustered bar ppt powerpoint presentation professional objects. This is a three stage process. The stages in this process are product, in percentage, finance, business, marketing.
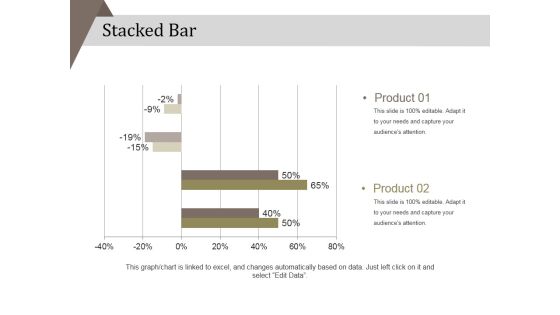
Stacked Bar Ppt PowerPoint Presentation Infographics Inspiration
This is a stacked bar ppt powerpoint presentation infographics inspiration. This is a two stage process. The stages in this process are product, percentage, finance, business, marketing.

Bar Graph Ppt PowerPoint Presentation Layouts Layouts
This is a bar graph ppt powerpoint presentation layouts layouts. This is a five stage process. The stages in this process are product, financial years, business, graph, marketing.

Clustered Bar Ppt PowerPoint Presentation File Inspiration
This is a clustered bar ppt powerpoint presentation file inspiration. This is a two stage process. The stages in this process are product, profit, growth, success, graph.

Bar Graph Ppt PowerPoint Presentation Outline Structure
This is a bar graph ppt powerpoint presentation outline structure. This is a three stage process. The stages in this process are product, percentage, finance, business.

Bar Graph Ppt PowerPoint Presentation Ideas Topics
This is a bar graph ppt powerpoint presentation ideas topics. This is a six stage process. The stages in this process are graph, business, growth, success, marketing.

Bar Diagram Ppt PowerPoint Presentation Pictures Designs
This is a bar diagram ppt powerpoint presentation pictures designs. This is a five stage process. The stages in this process are business, marketing, growth, graph, success.

Bar Graph Ppt PowerPoint Presentation Icon
This is a bar graph ppt powerpoint presentation icon. This is a three stage process. The stages in this process are business, finance, marketing, strategy, analysis.

Bar Graph Ppt PowerPoint Presentation Layouts Professional
This is a bar graph ppt powerpoint presentation layouts professional. This is a five stage process. The stages in this process are product, business, marketing, finance, graph.

Clustered Bar Ppt PowerPoint Presentation Model Slides
This is a clustered bar ppt powerpoint presentation model slides. This is a two stage process. The stages in this process are product, profit, business, finance, percentage.

Bar Graph Ppt PowerPoint Presentation File Tips
This is a bar graph ppt powerpoint presentation file tips. This is a twelve stage process. The stages in this process are business, marketing, finance, graph, strategy.
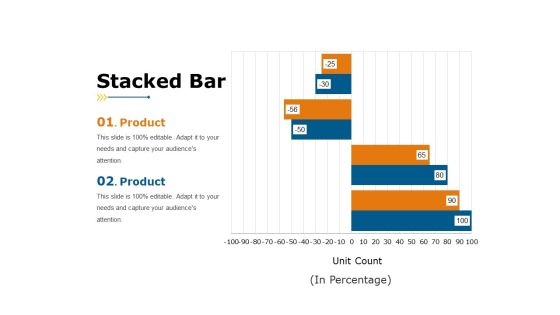
Stacked Bar Ppt PowerPoint Presentation File Sample
This is a stacked bar ppt powerpoint presentation file sample. This is a two stage process. The stages in this process are in percentage, finance, business, marketing, graph.

Clustered Bar Ppt PowerPoint Presentation Styles Elements
This is a clustered bar ppt powerpoint presentation styles elements. This is a three stage process. The stages in this process are product, business, marketing finance, graph.

Bar Chart Ppt PowerPoint Presentation Pictures Inspiration
This is a bar chart ppt powerpoint presentation pictures inspiration. This is a seven stage process. The stages in this process are in percentage, business, marketing, finance, graph.

Clustered Bar Ppt PowerPoint Presentation Outline Model
This is a clustered bar ppt powerpoint presentation outline model. This is a five stage process. The stages in this process are years, business, marketing, graph, finance.

Stacked Bar Ppt PowerPoint Presentation Summary Infographics
This is a stacked bar ppt powerpoint presentation summary infographics. This is a four stage process. The stages in this process are product, unit count, business, marketing, graph.

Bar Graph Ppt PowerPoint Presentation Inspiration Sample
This is a bar graph ppt powerpoint presentation inspiration sample. This is a four stage process. The stages in this process are business, pyramid, marketing, strategy, planning.

Clustered Bar Ppt PowerPoint Presentation File Maker
This is a clustered bar ppt powerpoint presentation file maker. This is a five stage process. The stages in this process are product, business, marketing, graph, finance.
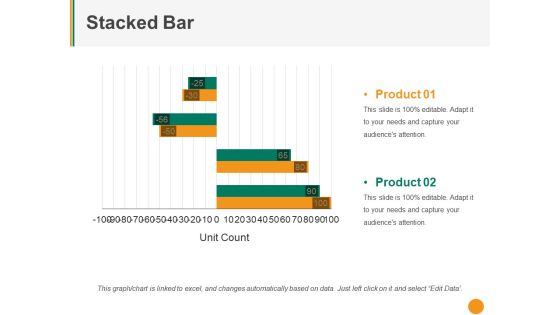
Stacked Bar Ppt PowerPoint Presentation Templates
This is a stacked bar ppt powerpoint presentation templates. This is a two stage process. The stages in this process are product, unit count, graph, business, marketing.

Bar Chart Ppt PowerPoint Presentation Summary Pictures
This is a bar chart ppt powerpoint presentation summary pictures. This is a four stage process. The stages in this process are product, unit count, finance, percentage, business.

Clustered Bar Ppt PowerPoint Presentation Background Designs
This is a clustered bar ppt powerpoint presentation background designs. This is a four stage process. The stages in this process are unit count, business, marketing, graph, finance.

Stacked Bar Ppt PowerPoint Presentation Layouts Inspiration
This is a stacked bar ppt powerpoint presentation layouts inspiration. This is a four stage process. The stages in this process are finance, business, marketing, percentage, graph.

Bar Graph Ppt PowerPoint Presentation File Demonstration
This is a bar graph ppt powerpoint presentation file demonstration. This is a four stage process. The stages in this process are graph, year, success, growth, business.

Bar Graph Ppt PowerPoint Presentation Summary Inspiration
This is a bar graph ppt powerpoint presentation summary inspiration. This is a four stage process. The stages in this process are graph, business, marketing, growth, years.

Clustered Bar Ppt PowerPoint Presentation Outline Demonstration
This is a clustered bar ppt powerpoint presentation outline demonstration. This is a three stage process. The stages in this process are unit count, graph, business, marketing, finance.

Clustered Bar Ppt PowerPoint Presentation Icon Slides
This is a clustered bar ppt powerpoint presentation icon slides. This is a two stage process. The stages in this process are profit, business, marketing, finance, chart.
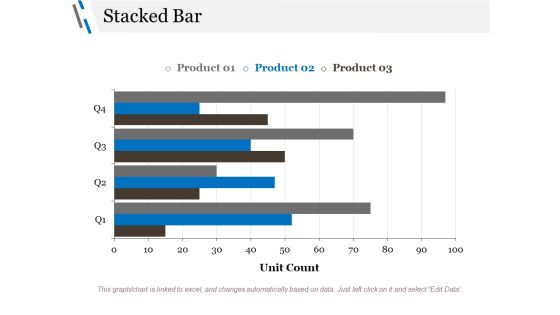
Stacked Bar Ppt PowerPoint Presentation File Backgrounds
This is a stacked bar ppt powerpoint presentation file backgrounds. This is a three stage process. The stages in this process are unit count, finance, business, marketing, graph.
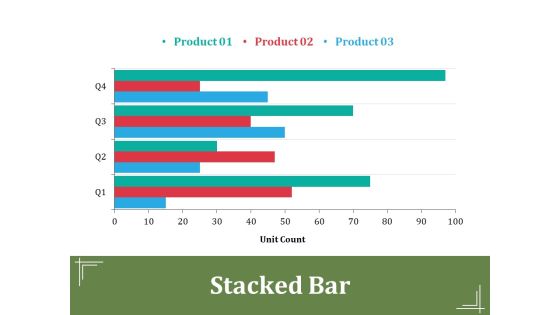
Stacked Bar Ppt PowerPoint Presentation Outline Layout
This is a stacked bar ppt powerpoint presentation outline layout. This is a two stage process. The stages in this process are in percentage, business, marketing, strategy, finance.

Clustered Bar Ppt PowerPoint Presentation Professional Grid
This is a clustered bar ppt powerpoint presentation professional grid. This is a two stage process. The stages in this process are profit, business, marketing, graph, strategy.
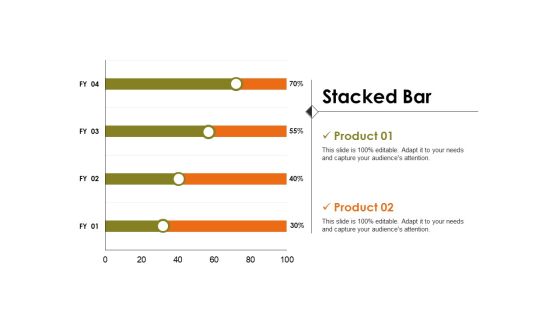
Stacked Bar Ppt PowerPoint Presentation Outline Elements
This is a stacked bar ppt powerpoint presentation outline elements. This is a two stage process. The stages in this process are chart, business, marketing, finance, strategy.

Clustered Bar Ppt PowerPoint Presentation Layouts Layout
This is a clustered bar ppt powerpoint presentation layouts layout. This is a two stage process. The stages in this process are profit, graph, business, marketing, finance.
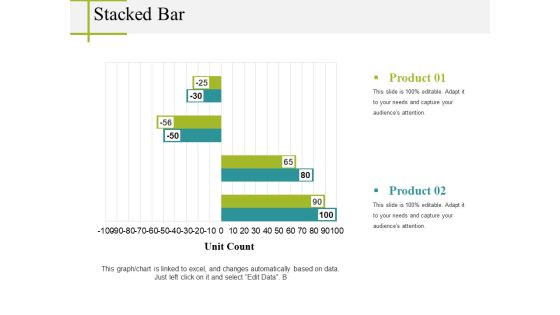
Stacked Bar Ppt PowerPoint Presentation Infographics Portrait
This is a stacked bar ppt powerpoint presentation infographics portrait. This is a two stage process. The stages in this process are unit count, business, marketing, graph, strategy.

Bar Diagram Ppt Powerpoint Presentation Styles Outline
This is a bar diagram ppt powerpoint presentation styles outline. This is a three stage process. The stages in this process are business, management, finance, analysis, marketing.

Clustered Bar Ppt PowerPoint Presentation Slides Show
This is a clustered bar ppt powerpoint presentation slides show. This is a three stage process. The stages in this process are finance, analysis, business, strategy, marketing.

Bar Graph Ppt PowerPoint Presentation Model Vector
This is a bar graph ppt powerpoint presentation model vector. This is a two stage process. The stages in this process are graph, financial, year, business, marketing.

Stacked Bar Ppt PowerPoint Presentation Infographics Clipart
This is a stacked bar ppt powerpoint presentation infographics clipart. This is a two stage process. The stages in this process are finance, marketing, business, unit count, graph.

Bar Chart Ppt PowerPoint Presentation Model Professional
This is a bar chart ppt powerpoint presentation model professional. This is a three stage process. The stages in this process are business, marketing, strategy, finance, growth.

Stacked Bar Ppt PowerPoint Presentation Pictures Slides
This is a stacked bar ppt powerpoint presentation pictures slides. This is a two stage process. The stages in this process are business, marketing, graph, finance, strategy.

Clustered Bar Ppt PowerPoint Presentation File Styles
This is a clustered bar ppt powerpoint presentation file styles. This is a four stage process. The stages in this process are business, marketing, strategy, planning, finance.

Clustered Bar Ppt PowerPoint Presentation Icon Background
This is a clustered bar ppt powerpoint presentation icon background. This is a three stage process. The stages in this process are business, unit count, marketing, graph, finance.

Bar Graph Ppt PowerPoint Presentation Pictures Picture
This is a bar graph ppt powerpoint presentation pictures picture. This is a three stage process. The stages in this process are business, marketing, strategy, planning, finance.

Stacked Bar Ppt PowerPoint Presentation Summary Diagrams
This is a stacked bar ppt powerpoint presentation summary diagrams. This is a four stage process. The stages in this process are business, marketing, strategy, planning, finance.

Stacked Bar Ppt PowerPoint Presentation Gallery Summary
This is a stacked bar ppt powerpoint presentation gallery summary. This is a two stage process. The stages in this process are business, marketing, graph, unit count, finance.
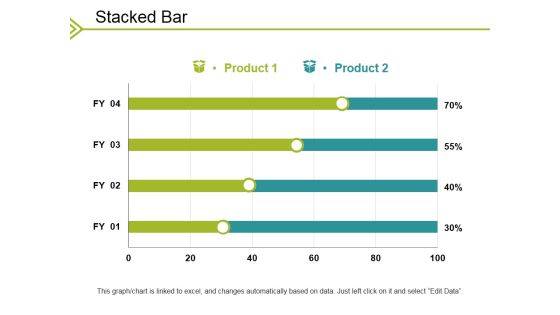
Stacked Bar Ppt PowerPoint Presentation File Outfit
This is a stacked bar ppt powerpoint presentation file outfit. This is a two stage process. The stages in this process are business, in percentage, marketing, strategy, graph.

Clustered Bar Ppt PowerPoint Presentation Model Gridlines
This is a clustered bar ppt powerpoint presentation model gridlines. This is a four stage process. The stages in this process are finance, marketing, analysis, management, planning.

Clustered Bar Ppt PowerPoint Presentation Icon Elements
This is a clustered bar ppt powerpoint presentation icon elements. This is a three stage process. The stages in this process are business, marketing, strategy, planning, finance.
Stacked Bar Ppt PowerPoint Presentation Icon Deck
This is a stacked bar ppt powerpoint presentation icon deck. This is a three stage process. The stages in this process are business, unit count, marketing, strategy, graph.

Clustered Bar Ppt PowerPoint Presentation Diagram Templates
This is a clustered bar ppt powerpoint presentation diagram templates. This is a three stage process. The stages in this process are business, marketing, unit count, finance, strategy.

Bar Graph Ppt PowerPoint Presentation Inspiration Slides
This is a bar graph ppt powerpoint presentation inspiration slides. This is a six stage process. The stages in this process are sales in percentage, financial year, product.

Bar Chart Ppt PowerPoint Presentation File Templates
This is a bar chart ppt powerpoint presentation file templates. This is a four stage process. The stages in this process are business, marketing, strategy, finance, planning.

Stacked Bar Ppt PowerPoint Presentation Layouts Brochure
This is a stacked bar ppt powerpoint presentation layouts brochure. This is a four stage process. The stages in this process are business, marketing, strategy, planning, finance.

Bar Graph Ppt PowerPoint Presentation Slides Slideshow
This is a bar graph ppt powerpoint presentation slides slideshow. This is a three stage process. The stages in this process are business, finance, marketing, strategy, planning.

Clustered Bar Ppt PowerPoint Presentation Outline Templates
This is a clustered bar ppt powerpoint presentation outline templates. This is a three stage process. The stages in this process are business, finance, analysis, management, marketing.

Bar Graph Ppt PowerPoint Presentation Infographics Templates
This is a bar graph ppt powerpoint presentation infographics templates. This is a two stage process. The stages in this process are product, financial years, sales in percentage.

Clustered Bar Ppt PowerPoint Presentation Icon Example
This is a clustered bar ppt powerpoint presentation icon example. This is a two stage process. The stages in this process are finance, investment, analysis, business, marketing.

Bar Graph Ppt PowerPoint Presentation Show Slides
This is a bar graph ppt powerpoint presentation show slides. This is a two stage process. The stages in this process are finance, marketing, management, investment, analysis.
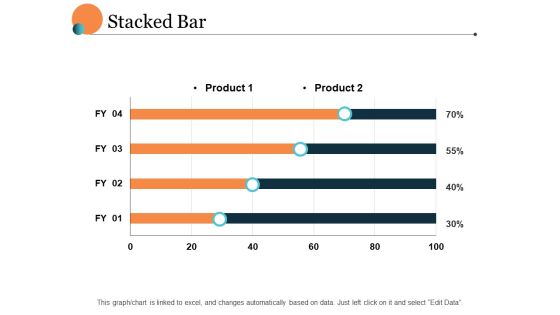
Stacked Bar Ppt PowerPoint Presentation Layouts
This is a stacked bar ppt powerpoint presentation layouts. This is a two stage process. The stages in this process are finance, marketing, management, investment, analysis.

Clustered Bar Ppt PowerPoint Presentation Inspiration Backgrounds
This is a clustered bar ppt powerpoint presentation inspiration backgrounds. This is a three stage process. The stages in this process are product, percentage, marketing, business.
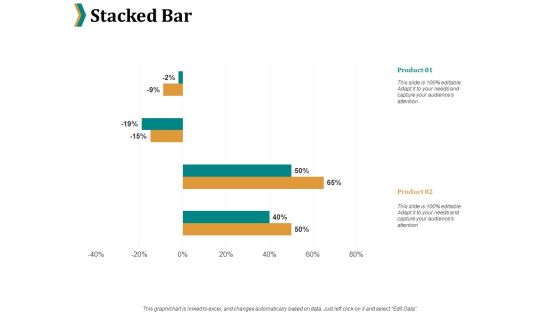
Stacked Bar Ppt PowerPoint Presentation Ideas
This is a stacked bar ppt powerpoint presentation ideas. This is a two stage process. The stages in this process are product, percentage, marketing, business.

Stacked Bar Finance Ppt PowerPoint Presentation Microsoft
This is a stacked bar finance ppt powerpoint presentation microsoft. This is a two stage process. The stages in this process are finance, marketing, management, investment, analysis.

Stacked Bar Ppt PowerPoint Presentation Inspiration
This is a stacked bar ppt powerpoint presentation inspiration. This is a two stage process. The stages in this process are business, management, strategy, sales, marketing.
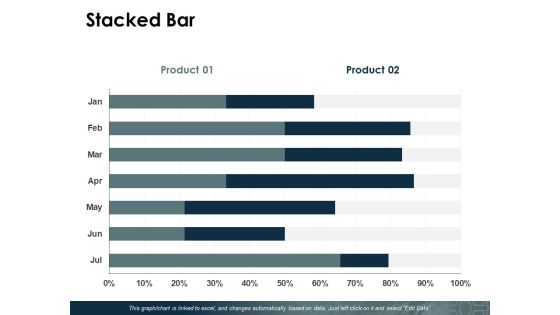
Stacked Bar Ppt PowerPoint Presentation Ideas Themes
This is a stacked bar ppt powerpoint presentation ideas themes. This is a two stage process. The stages in this process are product, percentage, management, marketing.

Stacked Bar Ppt PowerPoint Presentation Ideas Maker
This is a stacked bar ppt powerpoint presentation ideas maker. This is a two stage process. The stages in this process are percentage, product, business, management.

Bar Chart Ppt PowerPoint Presentation Professional Examples
This is a bar chart ppt powerpoint presentation professional examples. This is a four stage process. The stages in this process are percentage, marketing, management, product.

Bar Chart Ppt PowerPoint Presentation Show Deck
This is a bar chart ppt powerpoint presentation show deck. This is a two stage process. The stages in this process are percentage, product, business, marketing.

Clustered Bar Ppt PowerPoint Presentation Summary Elements
This is a clustered bar ppt powerpoint presentation summary elements. This is a two stage process. The stages in this process are percentage, product, business, marketing.
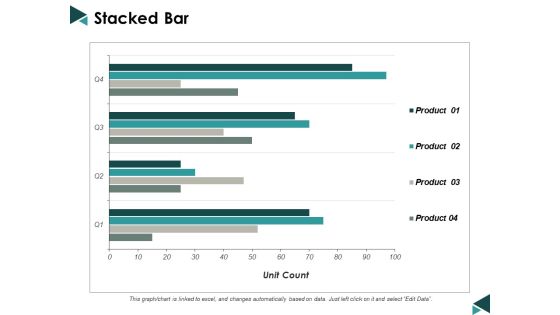
Stacked Bar Ppt Powerpoint Presentation Ideas Templates
This is a stacked bar ppt powerpoint presentation ideas templates. This is a four stage process. The stages in this process are finance, marketing, management, investment, analysis.

Stacked Bar Ppt PowerPoint Presentation Ideas Portfolio
This is a stacked bar ppt powerpoint presentation ideas portfolio. This is a three stage process. The stages in this process are percentage, product, management, marketing.

Clustered Bar Ppt PowerPoint Presentation Professional Guide
This is a clustered bar ppt powerpoint presentation professional guide. This is a three stage process. The stages in this process are percentage, product, business, management, marketing.

Clustered Bar Graph Ppt PowerPoint Presentation Templates
This is a clustered bar graph ppt powerpoint presentation templates. This is a three stage process. The stages in this process are finance, marketing, management, investment, analysis.

Business Plan With Bar Graph Powerpoint Guide
This is a business plan with bar graph powerpoint guide. This is a four stage process. The stages in this process are sales, years, net profit, gross profit.

Bar Graph Ppt PowerPoint Presentation Backgrounds
This is a bar graph ppt powerpoint presentation backgrounds. This is a four stage process. The stages in this process are business, marketing, finance, growth, management.

Bar Graph Ppt PowerPoint Presentation Clipart
This is a bar graph ppt powerpoint presentation clipart. This is a four stage process. The stages in this process are silhouettes, business, success, growth, stair.

Bar Graph Ppt PowerPoint Presentation Layout
This is a bar graph ppt powerpoint presentation layout. This is a three stage process. The stages in this process are business, marketing, management, analysis, growth.

Bar Graph Ppt PowerPoint Presentation Themes
This is a bar graph ppt powerpoint presentation themes. This is a three stage process. The stages in this process are business, marketing, strategy, success, management.

Bar Graph Ppt PowerPoint Presentation Diagrams
This is a bar graph ppt powerpoint presentation diagrams. This is a nine stage process. The stages in this process are business, marketing, success, management, growth.

Bar Graph Ppt PowerPoint Presentation Ideas
This is a bar graph ppt powerpoint presentation ideas. This is a two stage process. The stages in this process are computer, graph, growth, success, social.

Bar Chart Ppt PowerPoint Presentation Microsoft
This is a bar chart ppt powerpoint presentation microsoft. This is a eleven stage process. The stages in this process are sales in percentage, fy, graph, success, business.

Bar Chart Ppt PowerPoint Presentation Model
This is a bar chart ppt powerpoint presentation model. This is a two stage process. The stages in this process are business, marketing, product, planning, management.

Bar Graph Ppt PowerPoint Presentation Portfolio Background
This is a bar graph ppt powerpoint presentation portfolio background. This is a four stage process. The stages in this process are sale, years, product.
Stacked Bar Ppt PowerPoint Presentation Icon Styles
This is a stacked bar ppt powerpoint presentation icon styles. This is a seven stage process. The stages in this process are unit count, months, product, shared values.

Bar Graph Ppt PowerPoint Presentation Outline Slides
This is a bar graph ppt powerpoint presentation outline slides. This is a three stage process. The stages in this process are business, marketing, management, analysis, growth.

Bar Graph Ppt PowerPoint Presentation Ideas Professional
This is a bar graph ppt powerpoint presentation ideas professional. This is a five stage process. The stages in this process are business, marketing, growth, planning, process.

Bar Graph Ppt PowerPoint Presentation Gallery Maker
This is a bar graph ppt powerpoint presentation gallery maker. This is a six stage process. The stages in this process are business, marketing, growth, planning, management.

Bar Graph Ppt PowerPoint Presentation File Portfolio
This is a bar graph ppt powerpoint presentation file portfolio. This is a twelve stage process. The stages in this process are financial, marketing, management, business, strategy.

Bar Graph Ppt PowerPoint Presentation File Picture
This is a bar graph ppt powerpoint presentation file picture. This is a six stage process. The stages in this process are management, planning, marketing, business, strategy.

Bar Graph Ppt PowerPoint Presentation Portfolio Vector
This is a bar graph ppt powerpoint presentation portfolio vector. This is a nine stage process. The stages in this process are business, marketing, graph, finance, growth.

Bar Graph Ppt PowerPoint Presentation Professional Show
This is a bar graph ppt powerpoint presentation professional show. This is a four stage process. The stages in this process are business, strategy, marketing, planning, finance.

Bar Graph Ppt PowerPoint Presentation Gallery Portfolio
This is a bar graph ppt powerpoint presentation gallery portfolio. This is a five stage process. The stages in this process are business, marketing, graph, line chart, growth.
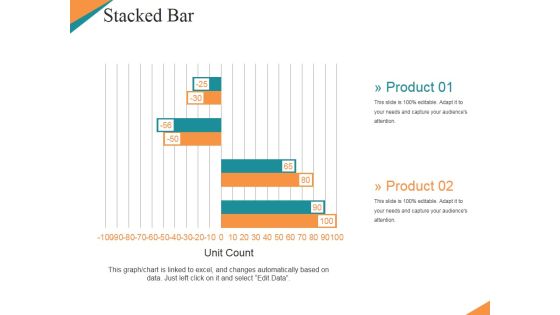
Stacked Bar Ppt PowerPoint Presentation Sample
This is a stacked bar ppt powerpoint presentation sample. This is a four stage process. The stages in this process are planning, management, strategy, marketing, business.
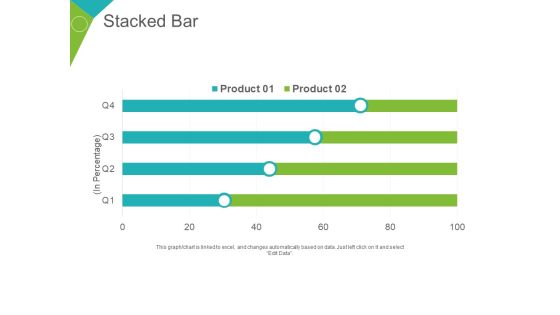
Stacked Bar Ppt PowerPoint Presentation Summary Portfolio
This is a stacked bar ppt powerpoint presentation summary portfolio. This is a two stage process. The stages in this process are product, business, planning, marketing, in percentage.

Bar Graph Ppt PowerPoint Presentation Layouts Pictures
This is a bar graph ppt powerpoint presentation layouts pictures. This is a four stage process. The stages in this process are fire, earthquake, axis title, in percentage.

Bar Chart Ppt PowerPoint Presentation Layouts Visuals
This is a bar chart ppt powerpoint presentation layouts visuals. This is a two stage process. The stages in this process are business, strategy, marketing, planning, chart and graph.

Bar Graph For Statistical Analysis Powerpoint Slides
This PowerPoint template has been designed with bar chart and percentage values. You may download this PPT slide to depict statistical analysis. Add this slide to your presentation and impress your superiors.

Bar Graph With Five Icons Powerpoint Slides
This PowerPoint slide contains diagram bar graph with icons. This PPT slide helps to exhibit concepts of financial deal and planning. Use this business slide to make impressive presentations.

Bar Chart For Strategic Planning Powerpoint Slides
This PowerPoint template has been designed with bar graph with two teams. This diagram is useful to exhibit strategic planning. This diagram slide can be used to make impressive presentations.
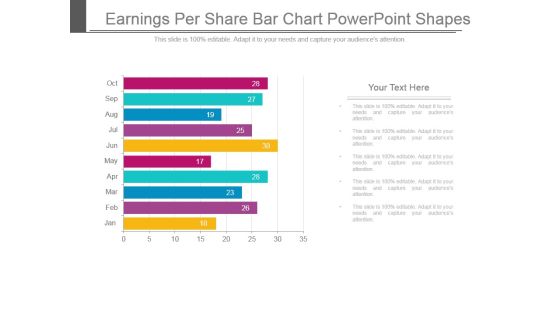
Earnings Per Share Bar Chart Powerpoint Shapes
This is a earnings per share bar chart powerpoint shapes. This is a ten stage process. The stages in this process are jan, feb, mar, apr, may, jun, jul, aug, sep, oct.

Bar Chart Ppt PowerPoint Presentation Icon Demonstration
This is a bar chart ppt powerpoint presentation icon demonstration. This is a seven stage process. The stages in this process are product, sales in percentage, financial year, graph.

Bar Chart Ppt PowerPoint Presentation Ideas Deck
This is a bar chart ppt powerpoint presentation ideas deck. This is a two stage process. The stages in this process are product, in percentage, in years, financial, business.
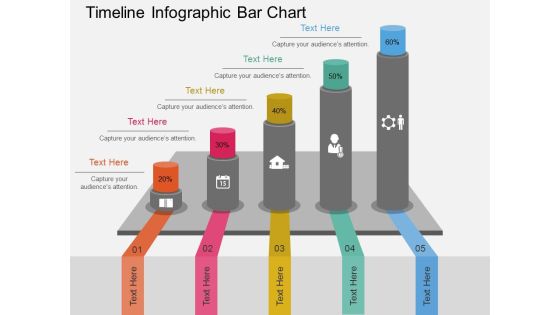
Timeline Infographic Bar Chart Powerpoint Template
This business diagram has been designed with timeline infographic bar chart. You may use this slide to display success and growth concepts. Make your mark with this unique slide and create an impression that will endure.
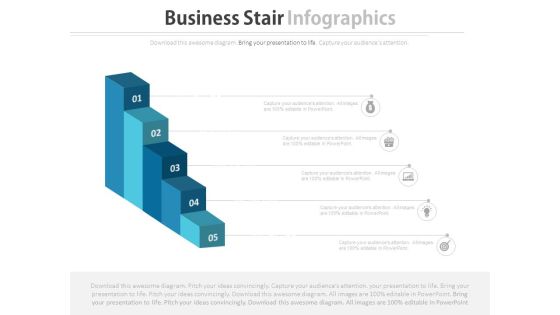
Five Steps Growth Bar Graph Powerpoint Template
This business template has been designed with five steps growth bar graph. This business diagram helps to bullet point your thoughts and ideas. Download this diagram to make interactive presentations.

Pareto Analysis Bar Graph Powerpoint Slide Deck
This is a pareto analysis bar graph powerpoint slide deck. This is a ten stage process. The stages in this process are restaurant complaints, total complaints, complaints pricing and service, pricing and service, analysis bring down complaints, category.

Bar Graph Ppt PowerPoint Presentation Introduction
This is a bar graph ppt powerpoint presentation introduction. This is a eleven stage process. The stages in this process are management, marketing, business, fy, graph, sales in percentage.

Bar Graph Ppt PowerPoint Presentation Slides Deck
This is a bar graph ppt powerpoint presentation slides deck. This is a three stage process. The stages in this process are financial in years, product, sales in percentage.

Bar Chart Ppt PowerPoint Presentation Portfolio Icons
This is a bar chart ppt powerpoint presentation portfolio icons. This is a seven stage process. The stages in this process are in years, in percentage, finance, business marketing.

Bar Graph Ppt PowerPoint Presentation Portfolio Example
This is a bar graph ppt powerpoint presentation portfolio example. This is a three stage process. The stages in this process are sales in percentage, year, business, product, business, graph.

Bar Chart Ppt PowerPoint Presentation Outline Introduction
This is a bar chart ppt powerpoint presentation outline introduction. This is a one stage process. The stages in this process are sales in percentage, product, business, financial years, graph.

Bar Graph Ppt PowerPoint Presentation Gallery Grid
This is a bar graph ppt powerpoint presentation gallery grid. This is a three stage process. The stages in this process are sales in percentage, product, finance, business, marketing.

Bar Chart Ppt PowerPoint Presentation Outline Guidelines
This is a bar chart ppt powerpoint presentation outline guidelines. This is a four stage process. The stages in this process are product, unit count, in years, graph, finance, business.

Bar Chart Ppt PowerPoint Presentation Styles Outfit
This is a bar chart ppt powerpoint presentation styles outfit. This is a Seven stage process. The stages in this process are sales in percentage, financial years, graph, business.

Bar Chart Ppt PowerPoint Presentation Portfolio Diagrams
This is a bar chart ppt powerpoint presentation portfolio diagrams. This is a three stage process. The stages in this process are sales in percentage, business, marketing, graph, finance.

Bar Chart Ppt PowerPoint Presentation Icon Introduction
This is a bar chart ppt powerpoint presentation icon introduction. This is a seven stage process. The stages in this process are in years, in percentage, business, marketing, graph.

Bar Chart Ppt PowerPoint Presentation File Slide
This is a bar chart ppt powerpoint presentation file slide. This is a one stage process. The stages in this process are sales in percentage financial years, business, marketing, strategy, graph.

Bar Chart Ppt PowerPoint Presentation Slide Download
This is a bar chart ppt powerpoint presentation slide download. This is a three stage process. The stages in this process are chart, in years, unit count, business, marketing.

Bar Chart Ppt PowerPoint Presentation Diagram Lists
This is a bar chart ppt powerpoint presentation diagram lists. This is a two stage process. The stages in this process are business, marketing, financial years, sales in percentage, graph.

Bar Chart Ppt PowerPoint Presentation Model Sample
This is a bar chart ppt powerpoint presentation model sample. This is a two stage process. The stages in this process are sales in percentage, business, marketing, graph, percentage, year.

Bar Chart Ppt PowerPoint Presentation Summary Themes
This is a bar chart ppt powerpoint presentation summary themes. This is a three stage process. The stages in this process are financial years, sales in percentage, business, marketing, graph.

Bar Chart Ppt PowerPoint Presentation Layouts Template
This is a bar chart ppt powerpoint presentation layouts template. This is a two stage process. The stages in this process are financial year, sales in percentage, business, marketing, finance.

Bar Graph Ppt PowerPoint Presentation Infographics Icon
This is a bar graph ppt powerpoint presentation infographics icon. This is a two stage process. The stages in this process are business, marketing, financial year, in percentage, graph.

Bar Graph Displaying Profit Growth Powerpoint Slides
This PowerPoint template has been designed with six point?s bar graph with icons. This PPT slide can be used to prepare presentations for marketing reports and also for financial data analysis. You can download finance PowerPoint template to prepare awesome presentations.

Bar Graph For Future Planning Powerpoint Template
This business diagram display bar graph for years 2015 and 2016. You may use this slide to display statistical analysis. This diagram provides an effective way of displaying information you can edit text, color, shade and style as per you need.
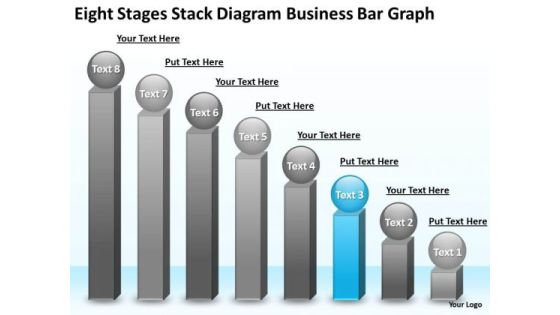
PowerPoint Presentations Bar Graph Business Plan Templates
We present our powerpoint presentations bar graph business plan templates.Use our Finance PowerPoint Templates because Our PowerPoint Templates and Slides are created by a hardworking bunch of busybees. Always flitting around with solutions gauranteed to please. Download our Leadership PowerPoint Templates because Our PowerPoint Templates and Slides are endowed to endure. Ideas conveyed through them will pass the test of time. Use our Business PowerPoint Templates because Your ideas provide food for thought. Our PowerPoint Templates and Slides will help you create a dish to tickle the most discerning palate. Use our Success PowerPoint Templates because Our PowerPoint Templates and Slides will provide you a launch platform. Give a lift off to your ideas and send them into orbit. Use our Spheres PowerPoint Templates because You can Bait your audience with our PowerPoint Templates and Slides. They will bite the hook of your ideas in large numbers.Use these PowerPoint slides for presentations relating to Concepts, Leadership, Success, Human, Achievement, Wink, Business, Ball, Three-Dimensional, Sign, Template, Diagram, Change, Character, Graphic, Stock, Development, Shape, Graph, Finances, Steps, Chart, Sphere, Examining, Up, Nice, Planning, Face, Growth, Person, Progress, Increases, Improvement, Image, Mimicry, Financial, Staircase. The prominent colors used in the PowerPoint template are Blue, Gray, Black.
Bar Graph And Pie Charts For Business Reports Vector Icon Ppt PowerPoint Presentation Show Graphics Tutorials PDF
Pitch your topic with ease and precision using this bar graph and pie charts for business reports vector icon ppt powerpoint presentation show graphics tutorials pdf. This layout presents information on bar graph and pie charts for business reports vector icon. It is also available for immediate download and adjustment. So, changes can be made in the color, design, graphics or any other component to create a unique layout.
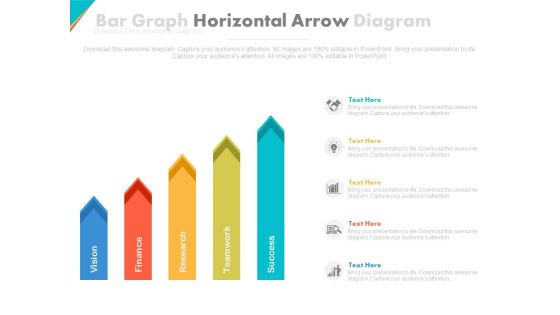
Five Horizontal Arrows Bar Graph Powerpoint Slides
This PowerPoint template contains five horizontal arrows bra graph. You may download this PPT slide design to display steps of strategic planning. You can easily customize this template to make it more unique as per your need.

Business Diagram Bar Graph For Growth And Progress Presentation Template
This business slide has been designed with graphics of bar chart. You may download this diagram to display concepts like growth, progress and success in business. Download this diagram slide to make impressive presentations.
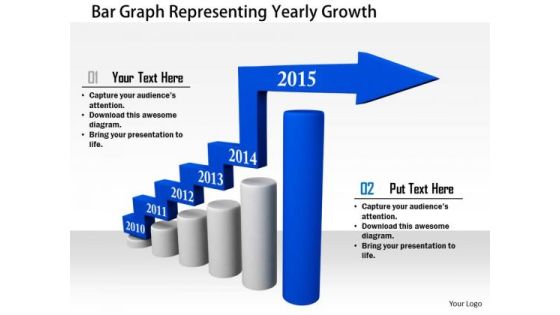
Stock Photo Bar Graph Representing Yearly Growth PowerPoint Slide
This Power Point image template slide has been crafted with graphic of bar graph and arrow. This image slide template contains the concept of yearly growth. Use this image slide and build exclusive presentation for your viewers.
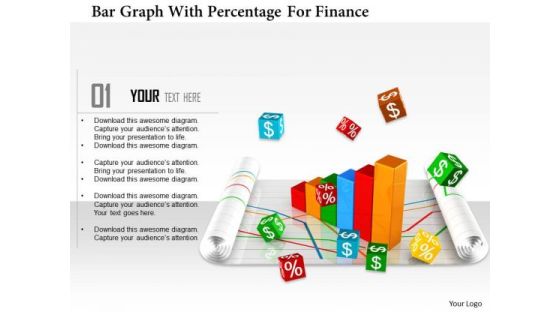
Stock Photo Bar Graph With Percentage For Finance PowerPoint Slide
This Power Point template has been designed with graphic of bar graph and percentage value. This image slide contains the concept of finance and accounting. Use this editable diagram for your business and finance related presentations.
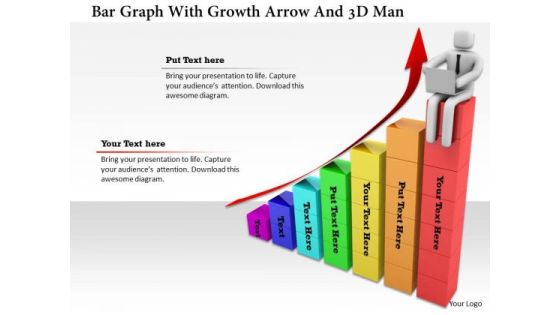
Bar Graph With Growth Arrow And 3d Man
This image slide has been crafted with graphic of bar graph and arrow. In this slide arrow is representing the concept of growth. Use this editable slide to display business growth.
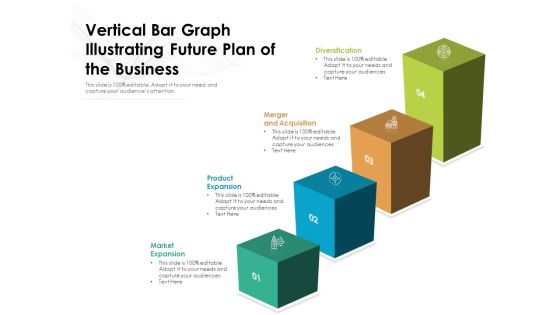
Vertical Bar Graph Illustrating Future Plan Of The Business Ppt PowerPoint Presentation File Graphic Tips PDF
Presenting vertical bar graph illustrating future plan of the business ppt powerpoint presentation file graphic tips pdf to dispense important information. This template comprises four stages. It also presents valuable insights into the topics including market expansion, product expansion, merger and acquisition. This is a completely customizable PowerPoint theme that can be put to use immediately. So, download it and address the topic impactfully.
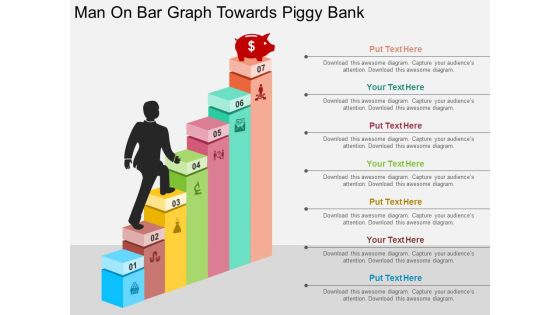
Man On Bar Graph Towards Piggy Bank Powerpoint Templates
Our above business slide contains graphics of man on bar graph towards piggy bank. This slide may be used to exhibit finance planning and saving. Capture the attention of your audience with this slide.

Man On Bar Graph With Ladders For Success Powerpoint Template
This business slide has been designed with graphics of man on bar graph with ladder. You may download this diagram to display concepts like strategy, management and success. Download this diagram slide to make impressive presentations.

Stock Photo Globe With Bar Graph For Business PowerPoint Slide
This image slide displays globe with bar graph. This image has been designed with graphic of bar graph, pie char, globe and growth arrow. Use this image slide, in your presentations to express views on finance, global growth and success. This image slide may also be used to exhibit any information which requires visual presentation in your presentations. This image slide will enhance the quality of your presentations.
Map Diagram With Bar Graph And Icons Powerpoint Slides
This PowerPoint template displays graphics of map diagram with bar graph and icons. This Map template can be used in business presentations to depict economic analysis. This slide can also be used by school students for educational projects.

Business Diagram Process Pyramids Bar Chart Business Slide Presentation Template
Graphic of pyramid and bar chart has been used to design this power point template diagram. This PPT diagram contains the concept of business result analysis and process flow. Use this template slide and display result in your presentations.

Stock Photo Bar Graph With Grid PowerPoint Slide
This image slide displays bar graph with grid. This image has been designed with graphic of 3d multicolor bar graph. Use this image slide, in your presentations to express views on finance, growth and success. This image slide may also be used to exhibit any information which requires visual presentation in your presentations. This image slide will enhance the quality of your presentations.
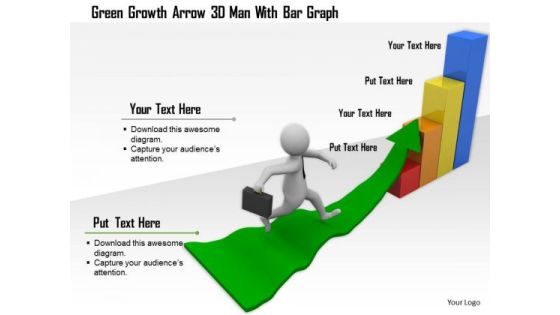
Green Growth Arrow 3d Man With Bar Graph
Our above image slide displays 3d man climbing on growth arrow. This conceptual image contains the concept of growth. We have also used graphic of bar graph which can be used to display business progress. Build an innovative presentation using this professional image slide.

Banner Bar Graph For Success Concept Powerpoint Template
Concepts of success and progress have been displayed in this power point template diagram. This PPT diagram contains the graphic of business man on bar graph. Use this PPT diagram for business and success related presentations.
Business Diagram Human Icon Bar Graph For Business Presentation Template
Graphic of human icons and bar graph has been used to decorate this power point template. This PPT contains the concept of business communication and result analysis. Use this PPT for business and marketing related presentations.

Business Diagram Business People Over Bar Chart PowerPoint Template
This Power Point template has been designed with graphic of business people and bar chart. This PPT contains the concept of result analysis and business data display. Use this PPT slide for your business and marketing related presentations.

Stock Photo Bar Graph And Different Currencies PowerPoint Slide
This image slide displays bar graph with different currencies symbols. This image has been designed with graphic of bar graph, blue colored growth arrow and symbols of different currencies. Use this image slide, in your presentations to express views on finance, growth and achievements. This image slide may also be used to exhibit finance accounts in your presentations. This image slide will enhance the quality of your presentations.
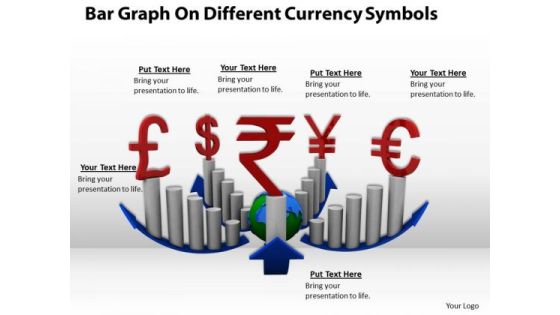
Stock Photo Bar Graph For Currency And Finance PowerPoint Slide
This image slide displays bar graphs with different currency symbols. This image has been designed with graphic of bar graphs, blue colored growth arrow and symbols of different currencies. Use this image slide, in your presentations to express views on finance, growth and achievements. This image slide may also be used to exhibit finance accounts in your presentations. This image slide will enhance the quality of your presentations.
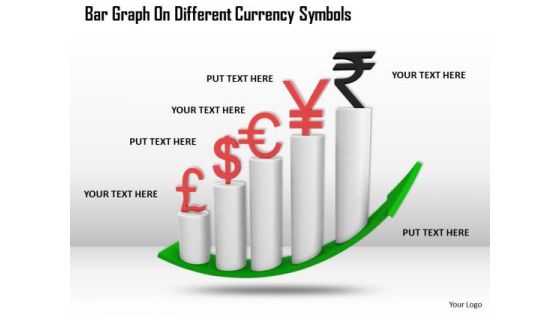
Stock Photo Bar Graph On Different Currency Symbols PowerPoint Slide
This image slide displays bar graph with different currency symbols. This image has been designed with graphic of bar graph, green colored growth arrow and symbols of different currencies. Use this image slide, in your presentations to express views on finance, monetary growth and achievements. This image slide may also be used to exhibit finance accounts in your presentations. This image slide will enhance the quality of your presentations.

Stock Photo Bar Graph With Dollar Currency Symbol PowerPoint Slide
This image slide displays bar graph with dollar currency symbol. This image has been designed with graphic of bar graph, red colored growth arrow and symbols of dollar currency. Use this image slide, in your presentations to express views on finance, growth and achievements. This image slide may also be used to exhibit finance accounts in your presentations. This image slide will enhance the quality of your presentations.
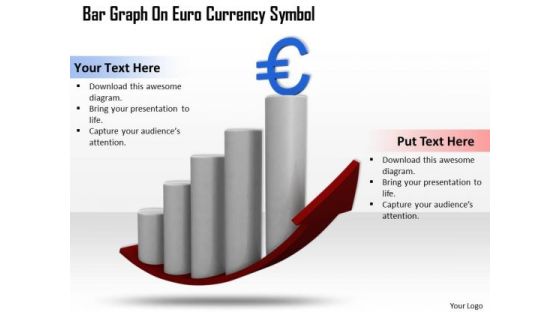
Stock Photo Bar Graph With Euro Currency Symbol PowerPoint Slide
This image slide displays bar graph with euro currency symbol. This image has been designed with graphic of bar graph, red colored growth arrow and symbols of euro currency. Use this image slide, in your presentations to express views on finance, growth and achievements. This image slide may also be used to exhibit finance accounts in your presentations. This image slide will enhance the quality of your presentations.
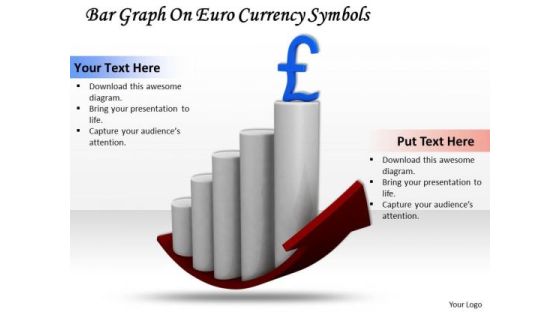
Stock Photo Bar Graph With Pound Currency Symbol PowerPoint Slide
This image slide displays bar graph with pound currency symbol. This image has been designed with graphic of bar graph, red colored growth arrow and symbols of pound currency. Use this image slide, in your presentations to express views on finance, growth and achievements. This image slide may also be used to exhibit finance accounts in your presentations. This image slide will enhance the quality of your presentations.

Stock Photo Bar Graph With Yen Currency Symbol PowerPoint Slide
This image slide displays bar graph with yen currency symbol. This image has been designed with graphic of bar graph, black colored growth arrow and symbols of pound currency. Use this image slide, in your presentations to express views on finance, growth and achievements. This image slide may also be used to exhibit finance accounts in your presentations. This image slide will enhance the quality of your presentations.

Business Diagram Eight Staged Circular Puzzle Bar Graph Presentation Template
This Power Point template has been crafted with graphic of eight staged circular puzzle and bar graph. This PPT contains the financial result analysis related concept. Use this PPT for your business and success related presentations.

Stock Photo Pie And Bar Graph With 2015 PowerPoint Slide
This Power Point image template slide has been crafted with graphic of pie and bar graph and 2015 year text. This PPT slide contains the concept of business and financial analysis. Use this image slide and build quality presentation for your viewers.

3d Man Running On Blue Growth And Bar Graph
This image slide has been designed with graphic of 3d man on blue arrow moving towards bar graph. This professional slide contains the concept of growth and success. Use this editable slide to depict business growth.

3d Man Running Over The Red Arrow On Bar Graph
This image slide has been designed with graphic of 3d man on red arrow moving towards bar graph. This professional slide contains the concept of growth and success. Use this editable slide to depict business growth.

Stock Photo Arrow Growth Bar Graph On Phone Pwerpoint Slide
This graphic image has been designed with graphic of smart phone with growth bar graph. This image contains the concept of business growth analysis. Use this image for business and marketing related analysis presentations. Display finance growth analysis in an graphical way with this exclusive image.
Digital Transformation Icon With Bar Graph Mockup PDF
Presenting digital transformation icon with bar graph mockup pdf to provide visual cues and insights. Share and navigate important information on three stages that need your due attention. This template can be used to pitch topics like digital transformation icon with bar graph. In addtion, this PPT design contains high resolution images, graphics, etc, that are easily editable and available for immediate download.

Business PowerPoint Presentation Bar Graph Constructing Plan Templates
We present our business powerpoint presentation bar graph constructing plan templates.Present our Business PowerPoint Templates because Our PowerPoint Templates and Slides will embellish your thoughts. See them provide the desired motivation to your team. Present our Spheres PowerPoint Templates because Our PowerPoint Templates and Slides are Clear and concise. Use them and dispel any doubts your team may have. Use our Competition PowerPoint Templates because You should Bet on your luck with our PowerPoint Templates and Slides. Be assured that you will hit the jackpot. Download our Shapes PowerPoint Templates because Our PowerPoint Templates and Slides will let Your superior ideas hit the target always and everytime. Download our Success PowerPoint Templates because You can Create a matrix with our PowerPoint Templates and Slides. Feel the strength of your ideas click into place.Use these PowerPoint slides for presentations relating to bar, graph, statistics, economy, render, success, representation, diagram, graphic, achievment, obstruction, chevron, accounting, finances, energy eco, steps, figure, tall, barrier, strategy, ladder, up, planning, high, climb, stripes, growth, maintenance, profit, successful, repair, return, gradient, sustainability, financial, construction, upwards, increasing. The prominent colors used in the PowerPoint template are Blue, Gray, White.
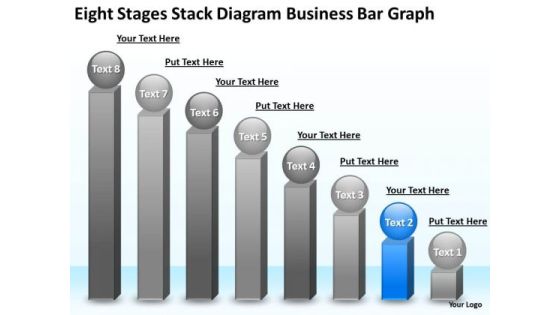
Business PowerPoint Presentation Bar Graph Strategic Planning Slides
We present our business powerpoint presentation bar graph strategic planning Slides.Download and present our Business PowerPoint Templates because Our PowerPoint Templates and Slides will let Your superior ideas hit the target always and everytime. Use our Spheres PowerPoint Templates because They will Put the wind in your sails. Skim smoothly over the choppy waters of the market. Present our Competition PowerPoint Templates because Our PowerPoint Templates and Slides will Embellish your thoughts. They will help you illustrate the brilliance of your ideas. Download and present our Shapes PowerPoint Templates because Our PowerPoint Templates and Slides will give you great value for your money. Be assured of finding the best projection to highlight your words. Download our Success PowerPoint Templates because Our PowerPoint Templates and Slides will effectively help you save your valuable time. They are readymade to fit into any presentation structure. Use these PowerPoint slides for presentations relating to bar, graph, statistics, economy, render, success, representation, diagram, graphic, achievment, obstruction, chevron, accounting, finances, energy eco, steps, figure, tall, barrier, strategy, ladder, up, planning, high, climb, stripes, growth, maintenance, profit, successful, repair, return, gradient, sustainability, financial, construction, upwards, increasing. The prominent colors used in the PowerPoint template are Blue, Gray, White.
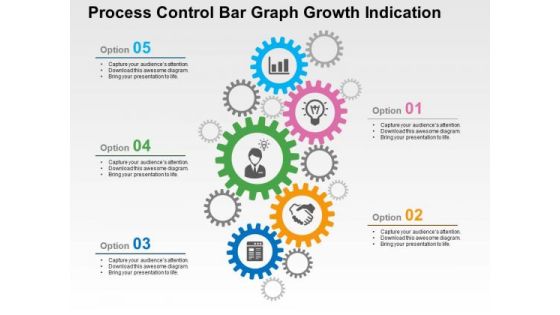
Process Control Bar Graph Growth Indication PowerPoint Template
Download our business slide with gear graphics to convincingly convey your important ideas in presentations. It also contains graphics of business icons. Create captivating presentations using this template

Black Chess Pieces Graphics
Black Chess Pieces GraphicsThese high quality powerpoint pre-designed slides and powerpoint templates have been carefully created by our professional team to help you impress your audience. All slides have been created and are 100% editable in powerpoint. Each and every property of any graphic - color, size, orientation, shading, outline etc. can be modified to help you build an effective powerpoint presentation. Any text can be entered at any point in the powerpoint template or slide. Simply DOWNLOAD, TYPE and PRESENT!

Chess Pieces Graphics
Chess Pieces GraphicsThese high quality powerpoint pre-designed slides and powerpoint templates have been carefully created by our professional team to help you impress your audience. All slides have been created and are 100% editable in powerpoint. Each and every property of any graphic - color, size, orientation, shading, outline etc. can be modified to help you build an effective powerpoint presentation. Any text can be entered at any point in the powerpoint template or slide. Simply DOWNLOAD, TYPE and PRESENT!
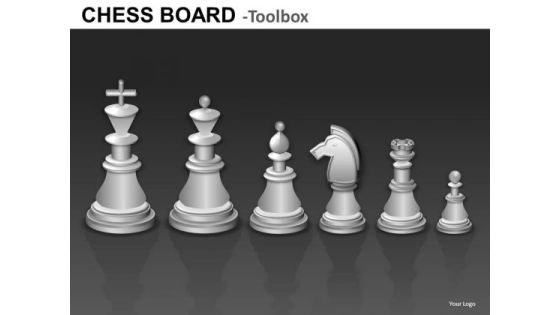
White Chess Pieces Graphics
White Chess Pieces GraphicsThese high quality powerpoint pre-designed slides and powerpoint templates have been carefully created by our professional team to help you impress your audience. All slides have been created and are 100% editable in powerpoint. Each and every property of any graphic - color, size, orientation, shading, outline etc. can be modified to help you build an effective powerpoint presentation. Any text can be entered at any point in the powerpoint template or slide. Simply DOWNLOAD, TYPE and PRESENT!

 Home
Home