Bar Graphics

Bar Graph Template 1 Ppt PowerPoint Presentation Deck
This is a bar graph template 1 ppt powerpoint presentation deck. This is a five stage process. The stages in this process are bar graph, business, marketing, success, management.

Bar Graph Template 2 Ppt PowerPoint Presentation Introduction
This is a bar graph template 2 ppt powerpoint presentation introduction. This is a four stage process. The stages in this process are bar graph, presentation, year, planning, marketing.

Bar Graph Ppt PowerPoint Presentation Gallery Example Topics
This is a bar graph ppt powerpoint presentation gallery example topics. This is a four stage process. The stages in this process are business, strategy, marketing, analysis, finance, bar graph.

Bar Chart Ppt PowerPoint Presentation Icon Design Templates
This is a bar chart ppt powerpoint presentation icon design templates. This is a nine stage process. The stages in this process are sales in percentage, bar graph, business, marketing, growth.

Bar Graph Ppt PowerPoint Presentation Outline File Formats
This is a bar graph ppt powerpoint presentation outline file formats. This is a nine stage process. The stages in this process are bar graph, business, management, success, strategy.

Bar Graph Ppt PowerPoint Presentation Layouts Design Templates
This is a bar graph ppt powerpoint presentation layouts design templates. This is a four stage process. The stages in this process are bar graph, planning, business, management, strategy.

Stacked Bar Chart Ppt PowerPoint Presentation Inspiration Ideas
This is a stacked bar chart ppt powerpoint presentation inspiration ideas. This is a four stage process. The stages in this process are product, highest, business, marketing, bar graph.
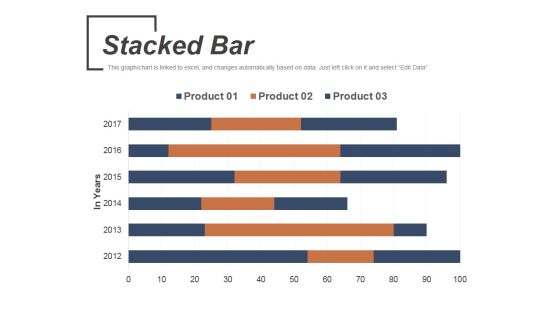
Stacked Bar Template 2 Ppt PowerPoint Presentation Slides Introduction
This is a stacked bar template 2 ppt powerpoint presentation slides introduction. This is a six stage process. The stages in this process are product, stacked bar, business, marketing, in years.

Bar Graph Ppt PowerPoint Presentation Outline Design Templates
This is a bar graph ppt powerpoint presentation outline design templates. This is a nine stage process. The stages in this process are bar graph, management, planning, strategy, marketing.

Bar Chart Ppt PowerPoint Presentation Slides Design Ideas
This is a bar chart ppt powerpoint presentation slides design ideas. This is a six stage process. The stages in this process are product, bar chart, sales in percentage.

Clustered Bar Ppt PowerPoint Presentation Summary Design Inspiration
This is a clustered bar ppt powerpoint presentation summary design inspiration. This is a two stage process. The stages in this process are product, clustered bar, profit, business, marketing.
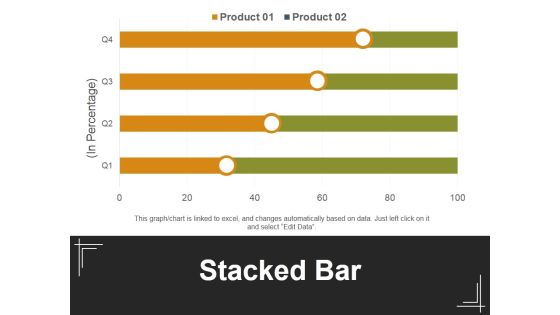
Stacked Bar Template 1 Ppt PowerPoint Presentation Inspiration Background Designs
This is a stacked bar template 1 ppt powerpoint presentation inspiration background designs. This is a four stage process. The stages in this process are in percentage, stacked bar, product, business, marketing.
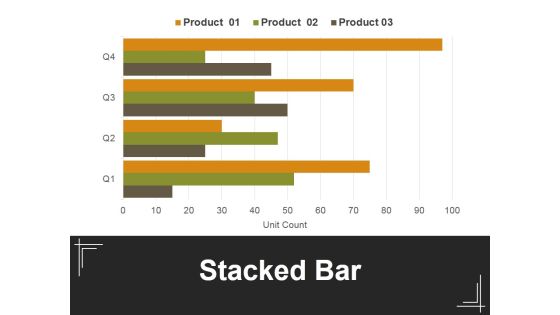
Stacked Bar Template 2 Ppt PowerPoint Presentation Professional Example
This is a stacked bar template 2 ppt powerpoint presentation professional example. This is a four stage process. The stages in this process are in percentage, stacked bar, product, business, marketing.

Bar Graph Ppt PowerPoint Presentation Infographic Template Template
This is a bar graph ppt powerpoint presentation infographic template template. This is a three stage process. The stages in this process are bar graph, sales in percentage, product, planning, business.

Bar Chart Ppt PowerPoint Presentation Infographic Template Brochure
This is a bar chart ppt powerpoint presentation infographic template brochure. This is a seven stage process. The stages in this process are bar graph, finance, marketing, strategy, analysis, business.

Bar Graph Ppt PowerPoint Presentation Gallery Example File
This is a bar graph ppt powerpoint presentation gallery example file. This is a two stage process. The stages in this process are column, bar graph, business, marketing, management.

Bar Chart Ppt PowerPoint Presentation Infographics Designs Download
This is a bar chart ppt powerpoint presentation infographics designs download. This is a twelve stage process. The stages in this process are bar chart, business, marketing, strategy, success.

Stacked Bar Ppt PowerPoint Presentation Visual Aids Pictures
This is a stacked bar ppt powerpoint presentation visual aids pictures. This is a two stage process. The stages in this process are product, percentage, finance, business, marketing.

Bar Graph Ppt PowerPoint Presentation Infographic Template Visuals
This is a bar graph ppt powerpoint presentation infographic template visuals. This is a twelve stage process. The stages in this process are business, marketing, management, growth, planning.

Bar Graph Ppt PowerPoint Presentation Visual Aids Styles
This is a bar graph ppt powerpoint presentation visual aids styles. This is a five stage process. The stages in this process are finance, analysis, planning, business, process.

Clustered Bar Ppt PowerPoint Presentation Model Visual Aids
This is a clustered bar ppt powerpoint presentation model visual aids. This is a three stage process. The stages in this process are business, marketing, strategy, graph, finance.

Clustered Bar Ppt PowerPoint Presentation Pictures Visual Aids
This is a clustered bar ppt powerpoint presentation pictures visual aids. This is a four stage process. The stages in this process are business, marketing, strategy, finance, planning.

Bar Chart Product Ppt PowerPoint Presentation Portfolio Visuals
This is a bar chart product ppt powerpoint presentation portfolio visuals. This is a three stage process. The stages in this process are business, management, marketing, percentage, product.

Gross Margin Improvement Bar Charts Powerpoint Slide Images
This is a gross margin improvement bar charts powerpoint slide images. This is a two stage process. The stages in this process are chart title.

Bar Graph Ppt Powerpoint Presentation Inspiration Background Image
This is a bar graph ppt powerpoint presentation inspiration background image. This is a four stage process. The stages in this process are australia, china, brazil, united states.

Bar Graph Ppt PowerPoint Presentation Ideas Background Image
This is a bar graph ppt powerpoint presentation ideas background image. This is a five stage process. The stages in this process are business, marketing, growth, graph, success.
Stacked Bar Ppt PowerPoint Presentation Icon Background Image
This is a stacked bar ppt powerpoint presentation icon background image. This is a four stage process. The stages in this process are product, percentage, finance, business, marketing.

Bar Chart Ppt PowerPoint Presentation Professional Clipart Images
This is a bar chart ppt powerpoint presentation professional clipart images. This is a three stage process. The stages in this process are business, finance, analysis, investment, marketing.
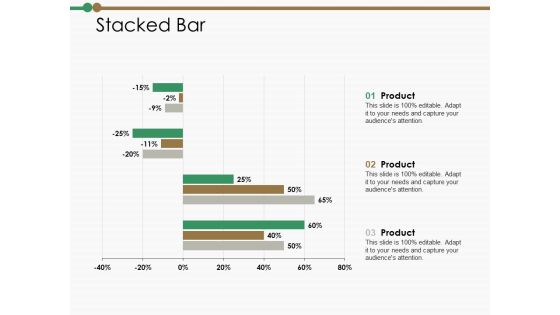
Stacked Bar Ppt PowerPoint Presentation Summary Clipart Images
This is a stacked bar ppt powerpoint presentation summary clipart images. This is a three stage process. The stages in this process are financial, percentage, product, management, marketing.

Clustered Bar Ppt PowerPoint Presentation Icon Background Image
This is a clustered bar ppt powerpoint presentation icon background image. This is a three stage process. The stages in this process are percentage, product, business, marketing.
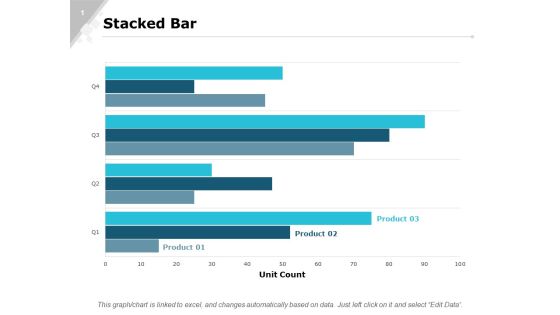
Stacked Bar Graph Ppt PowerPoint Presentation Inspiration Images
This is a stacked bar graph ppt powerpoint presentation inspiration images. This is a three stage process. The stages in this process are finance, marketing, analysis, investment, million.
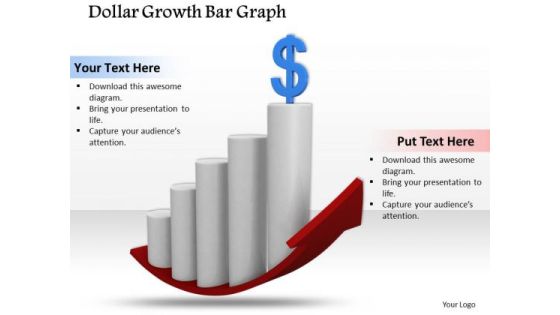
Business Management Strategy Dollar Growth Bar Graph Clipart Images
Land The Idea With Our business management strategy dollar growth bar graph clipart images Powerpoint Templates. Help It Grow With Your Thoughts.
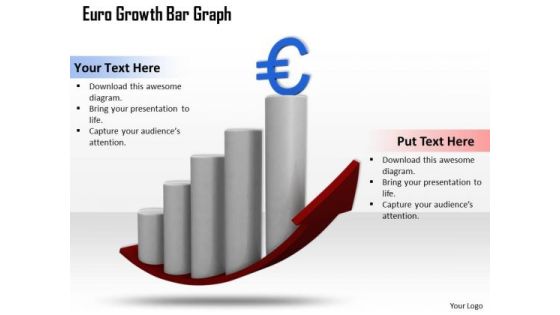
New Business Strategy Euro Growth Bar Graph Images Photos
Your Thoughts Are Dripping With Wisdom. Lace It With Our new business strategy euro growth bar graph images photos Powerpoint Templates.

Bar Chart Investment Ppt PowerPoint Presentation Styles Visual Aids
Presenting this set of slides with name bar chart investment ppt powerpoint presentation styles visual aids. The topics discussed in these slide is bar chart. This is a completely editable PowerPoint presentation and is available for immediate download. Download now and impress your audience.

Clustered Bar Ppt PowerPoint Presentation Visual Aids Professional
Presenting this set of slides with name clustered bar ppt powerpoint presentation visual aids professional. The topics discussed in these slide is clustered bar. This is a completely editable PowerPoint presentation and is available for immediate download. Download now and impress your audience.

Cocktail Bar Food Van Ppt PowerPoint Presentation Visual Aids Gallery
Presenting this set of slides with name cocktail bar food van ppt powerpoint presentation visual aids gallery. The topics discussed in these slide is cocktail bar food van. This is a completely editable PowerPoint presentation and is available for immediate download. Download now and impress your audience.
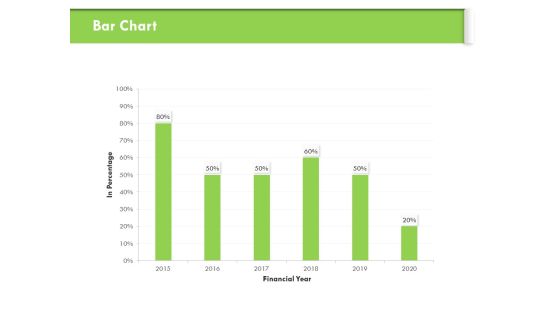
Understanding Organizational Structures Bar Chart Ppt Professional Visuals PDF
Presenting this set of slides with name understanding organizational structures bar chart ppt professional visuals pdf. The topics discussed in these slides are bar chart, financial year, percentage. This is a completely editable PowerPoint presentation and is available for immediate download. Download now and impress your audience.

Know Your Customer Clustered Bar Ppt Infographics Visuals PDF
Presenting this set of slides with name know your customer clustered bar ppt infographics visuals pdf. The topics discussed in these slide is clustered bar. This is a completely editable PowerPoint presentation and is available for immediate download. Download now and impress your audience.

Stock Photo Piggy Banks Of Bar Graph PowerPoint Slide
This image is designed with piggy banks on bar graph. This image portrays the concepts of saving and investment. You may use this image to make outstanding presentations.
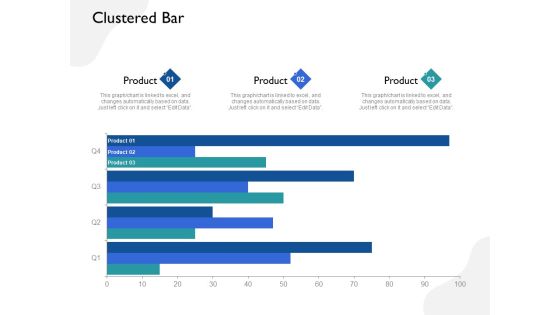
Five Business Strategic Approaches Clustered Bar Ppt Summary Images PDF
Presenting this set of slides with name five business strategic approaches clustered bar ppt summary images pdf. The topics discussed in these slide is clustered bar. This is a completely editable PowerPoint presentation and is available for immediate download. Download now and impress your audience.
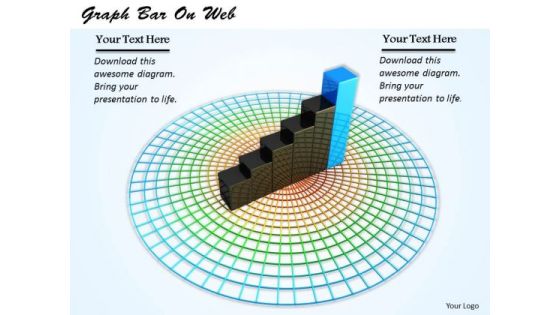
Stock Photo Bar Graph On Circular Web PowerPoint Slide
This image slide displays bar garph on circular web. This image slide helps you to make business and sales related presenations. Deliver amazing presentations to mesmerize your audience.

Bar Chart Representing Macroeconomic Analysis Variables Background PDF
This slide shows the graphical representation of macroeconomic variables which includes house prices, stock prices, unemployment and wages that shows effect of macroeconomic policies on the variables of four different countries. Showcasing this set of slides titled Bar Chart Representing Macroeconomic Analysis Variables Background PDF. The topics addressed in these templates are House Prices, Stock Prices, Unemployment, Wages. All the content presented in this PPT design is completely editable. Download it and make adjustments in color, background, font etc. as per your unique business setting.

Bar Chart Representing Competitive Customer Relationship Benefits Demonstration PDF
This slide focuses on the graphical representation of benefits arises from customer relationship management which covers improving customer services, enhances sales, managing customer renewals, minimizes costs, generates new business, increase customer retention, etc. Showcasing this set of slides titled Bar Chart Representing Competitive Customer Relationship Benefits Demonstration PDF. The topics addressed in these templates are Management Software, Customer Relationship, Costs Since. All the content presented in this PPT design is completely editable. Download it and make adjustments in color, background, font etc. as per your unique business setting.

Yearly Sales Assessment Of Products With Bar Graph Structure PDF
This slide represent graphical presentation of annual sales review of various products sold by an organization within 5 years showing difference in revenue generated .It shows report of following years 2018,2019,2020,and 2021. Showcasing this set of slides titled Yearly Sales Assessment Of Products With Bar Graph Structure PDF. The topics addressed in these templates are Product, Sales Of Product, Product Demand. All the content presented in this PPT design is completely editable. Download it and make adjustments in color, background, font etc. as per your unique business setting.

Bar Graph Business PowerPoint Templates And PowerPoint Themes 1012
Bar Graph Business PowerPoint Templates And PowerPoint Themes 1012-This PowerPoint Template shows the Bar Graph with increasing percentage which signifies the Financial Growth. The Template signifies the concept of business growth. The structure of our templates allows you to effectively highlight the key issues concerning the growth of your business. Our PPT images are so ideally designed that it reveals the very basis of our PPT template are an effective tool to make your clients understand.-Bar Graph Business PowerPoint Templates And PowerPoint Themes 1012-This PowerPoint template can be used for presentations relating to-Financial bar graph chart, technology, money, business, finance, marketing
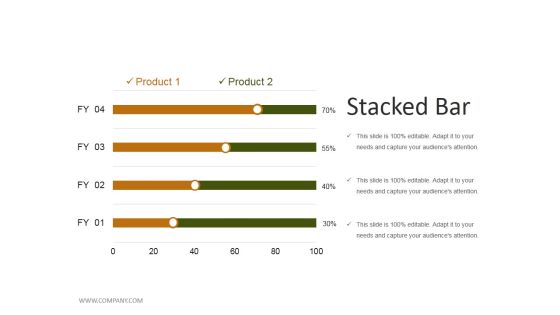
Stacked Bar Ppt PowerPoint Presentation Gallery File Formats
This is a stacked bar ppt powerpoint presentation gallery file formats. This is a four stage process. The stages in this process are finance, product, percentage, business, marketing.

Stacked Bar Ppt PowerPoint Presentation Outline Slide Portrait
This is a stacked bar ppt powerpoint presentation outline slide portrait. This is a two stage process. The stages in this process are product, unit count, business, marketing.
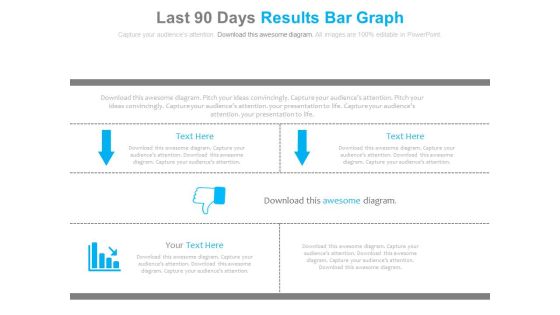
Last 90 Days Results Bar Graph Ppt Slides
This is a last 90 days results bar graph ppt slides. This is a three stage process. The stages in this process are arrows, business, marketing.

Bar Graph With Product Development Analysis Powerpoint Ideas
This is a bar graph with product development analysis powerpoint ideas. This is a five stage process. The stages in this process are graph, growth, business, marketing, arrows.

Curve Bar Graph For Process Capability Measurement Powerpoint Guide
This is a curve bar graph for process capability measurement powerpoint guide. This is a nine stage process. The stages in this process are target, lsl, usl, category.

Overall Revenue Analysis Bar Chart Powerpoint Slide Information
This is a overall revenue analysis bar chart powerpoint slide information. This is a nine stage process. The stages in this process are finance, success, business, marketing, percentage.
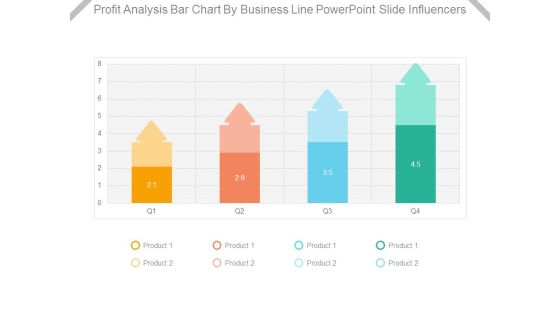
Profit Analysis Bar Chart By Business Line Powerpoint Slide Influencers
This is a profit analysis bar chart by business line powerpoint slide influencers. This is a four stage process. The stages in this process are product.

Competitive Environment Analysis Bar Graph Ppt Slide Templates
This is a competitive environment analysis bar graph ppt slide templates. This is a one stage process. The stages in this process are engagement, brand, monthly, weekly.
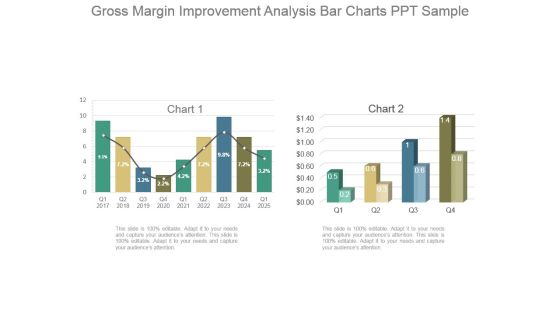
Gross Margin Improvement Analysis Bar Charts Ppt Sample
This is a gross margin improvement analysis bar charts ppt sample. This is a two stage process. The stages in this process are chart.

Gross Margin Improvement Bar Chart Powerpoint Slide Backgrounds
This is a gross margin improvement bar chart powerpoint slide backgrounds. This is a two stage process. The stages in this process are chart title.

Gross Margin Improvement Bar Graph Dashboard Powerpoint Slide Download
This is a gross margin improvement bar graph dashboard powerpoint slide download. This is a two stage process. The stages in this process are chart title.

Ebitda Highlights Growth Indication Bar Graph Powerpoint Slide Backgrounds
This is a ebitda highlights growth indication bar graph powerpoint slide backgrounds. This is a five stage process. The stages in this process are ebitda, ebitda margins, category.

Financials Bar Graph For Expectation Analysis Powerpoint Slide Deck Samples
This is a financials bar graph for expectation analysis powerpoint slide deck samples. This is a four stage process. The stages in this process are product version.

Bar Graph For Career Advancement Sample Of Ppt
This is a bar graph for career advancement sample of ppt. This is a six stage process. The stages in this process are business, strategy, management, growth, process.

Stacked Bar Template 2 Ppt PowerPoint Presentation Inspiration
This is a stacked bar template 2 ppt powerpoint presentation inspiration. This is a four stage process. The stages in this process are product, business, management, marketing, strategy.

 Home
Home