Bar Graphics

Cost Reduction Bar Graph For Organization Optimization Ppt Inspiration Vector PDF
This slide represent cost saving with benefits in an organization and areas where more efficiencies are utilized. It includes travel, administrative and hiring. Pitch your topic with ease and precision using this Cost Reduction Bar Graph For Organization Optimization Ppt Inspiration Vector PDF. This layout presents information on Total Cost Benefits, Promoting Employees, Providing Perks. It is also available for immediate download and adjustment. So, changes can be made in the color, design, graphics or any other component to create a unique layout.

Busines Diagram Five Staged Bar Graph For Process Flow Presentation Template
This business diagram displays graphic of five staged business info graphics. This diagram is useful to display business growth steps. Add this image in your presentations to visually support your content and express your thoughts.

Capital Spending Ppt PowerPoint Presentation Graphics
This is a capital spending ppt powerpoint presentation graphics. This is a two stage process. The stages in this process are business, marketing, success, bar graph, management.

Bar Graph Representing Macroeconomic Analysis Employment Change By Industry Background PDF
This slide focuses on the graphical presentation of macroeconomic indicator such as employment rate of different industries which includes service providing and goods producing industries which includes healthcare and social assistance, construction, manufacturing industry, etc. Pitch your topic with ease and precision using this Bar Graph Representing Macroeconomic Analysis Employment Change By Industry Background PDF. This layout presents information on Goods Producing, Service Providing, Financial, Business. It is also available for immediate download and adjustment. So, changes can be made in the color, design, graphics or any other component to create a unique layout.

Bar Chart Representing IT Risk Control Strategies Risk Management For Banks Themes PDF
This slide shows the graphical presentation of information technology risk management strategies adopted by banks such as mapping rules and requirements, regulatory impact management, data preparation and validation, compliance monitoring, analytical calculations, etc. Pitch your topic with ease and precision using this Bar Chart Representing IT Risk Control Strategies Risk Management For Banks Themes PDF. This layout presents information on IT Risk Management, Compliance Monitoring, Manages IT Risks. It is also available for immediate download and adjustment. So, changes can be made in the color, design, graphics or any other component to create a unique layout.

Business Revenue Bar Graph With Business Operational Expenditure Details Summary PDF
This slide represents business revenue bar graph with OPEX details which can be referred by companies to earn more revenue by controlling expenditures. It also provides information about marketing and sales, research and development, administration, total revenue, etc. Pitch your topic with ease and precision using this Business Revenue Bar Graph With Business Operational Expenditure Details Summary PDF. This layout presents information on Cost Of Marketing, Sales, Highest Amount. It is also available for immediate download and adjustment. So, changes can be made in the color, design, graphics or any other component to create a unique layout.

Bar Chart Showing Various Bullying Activities Ppt PowerPoint Presentation Professional Slide PDF
Pitch your topic with ease and precision using this bar chart showing various bullying activities ppt powerpoint presentation professional slide pdf. This layout presents information on unjustified criticism or complaints, deliberately excluding someone from workplace activities, deliberately denying access to information or other resources, verbal abusing, humiliating a person through gestures, sarcasm, teasing and insults in front of others, spreading rumors about someone. It is also available for immediate download and adjustment. So, changes can be made in the color, design, graphics or any other component to create a unique layout.

Monthly Business Operational Expenditure Bar Graph With Projected And Actual Expenses Introduction PDF
This slide shows monthly operating expenditure opex with projected and actual expenses which can be referred by companies to align budget with expenses effectively. It also provides information about machinery rent, personnel benefits, building rent, equipment, professional fees, etc. Pitch your topic with ease and precision using this Monthly Business Operational Expenditure Bar Graph With Projected And Actual Expenses Introduction PDF. This layout presents information on Projected Expenses, Costs, Service. It is also available for immediate download and adjustment. So, changes can be made in the color, design, graphics or any other component to create a unique layout.

Stock Photo 3d Business Executive On Chess Board Bar PowerPoint Slide
This Power Point slide has been crafted with graphic of business executives on chess board. We have also graphic of executives on chess board to display team strategy concept. Use this image slide in your presentation and create an exclusive presentation for your viewers.
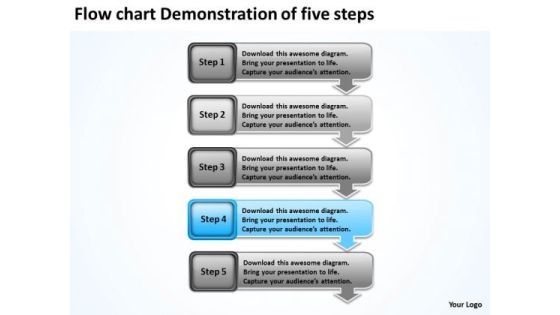
Flow Chart Demonstration Of Five Steps Business Plan For Bar PowerPoint Slides
We present our flow chart demonstration of five steps business plan for bar PowerPoint Slides.Download and present our Business PowerPoint Templates because you should Lay down the fundamentals to build upon. Download and present our Boxes PowerPoint Templates because it depicts Rolling along while gathering profits along the way is the aim. Use our Arrows PowerPoint Templates because with the help of our Slides you can Illustrate your plans on using the many social media modes available to inform soceity at large of the benefits of your product. Use our Process and Flows PowerPoint Templates because getting it done in time is the key to success. Use our Shapes PowerPoint Templates because they are truly some of the wonders of our life.Use these PowerPoint slides for presentations relating to Arrow, Background, Business, Chart, Diagram, Financial, Graphic, Gray, Icon, Illustration, Management, Orange, Perspective, Planning, Process, Stages, Steps, Text. The prominent colors used in the PowerPoint template are Blue light, Gray, Black. We assure you our flow chart demonstration of five steps business plan for bar PowerPoint Slides are the best it can get when it comes to presenting. We assure you our Gray PowerPoint templates and PPT Slides are specially created by a professional team with vast experience. They diligently strive to come up with the right vehicle for your brilliant Ideas. Customers tell us our flow chart demonstration of five steps business plan for bar PowerPoint Slides will get their audience's attention. Presenters tell us our Graphic PowerPoint templates and PPT Slides are Elevated. You can be sure our flow chart demonstration of five steps business plan for bar PowerPoint Slides are Cheerful. The feedback we get is that our Graphic PowerPoint templates and PPT Slides are Classic.

Bar Graph Option Market Diversification Strategy Ppt PowerPoint Presentation Complete Deck
Share a great deal of information on the topic by deploying this bar graph option market diversification strategy ppt powerpoint presentation complete deck. Support your ideas and thought process with this prefabricated set. It includes a set of eleven slides, all fully modifiable and editable. Each slide can be restructured and induced with the information and content of your choice. You can add or remove large content boxes as well, to make this PPT slideshow more personalized. Its high-quality graphics and visuals help in presenting a well-coordinated pitch. This PPT template is also a resourceful tool to take visual cues from and implement the best ideas to help your business grow and expand. The main attraction of this well-formulated deck is that everything is editable, giving you the freedom to adjust it to your liking and choice. Changes can be made in the background and theme as well to deliver an outstanding pitch. Therefore, click on the download button now to gain full access to this multifunctional set.
Growing Arrow On Bar Graph Vector Icon Ppt PowerPoint Presentation Designs Cpb
This is a growing arrow on bar graph vector icon ppt powerpoint presentation designs cpb . This is a three stage process. The stages in this process are bar chart icon, bar graph icon, data chart icon.
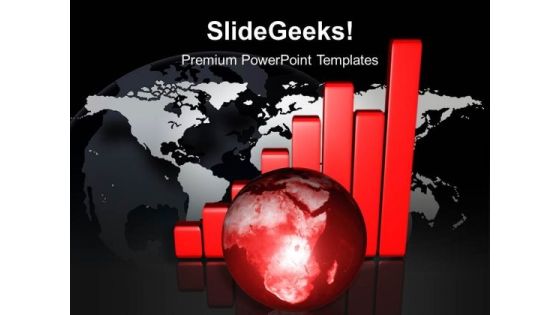
Growth Bar Graph With Earth PowerPoint Templates And PowerPoint Themes 1012
Growth Bar Graph With Earth PowerPoint Templates And PowerPoint Themes 1012-Create stunning Microsoft office PPT Presentations with our professional templates containing a graphic of a rising chart graph predicts global worldwide growth with a globe as symbol of success and financial, business. This image has been conceived to enable you to emphatically communicate your ideas in your Business PPT presentations. Our PPT images are so ideally designed that it reveals the very basis of our PPT template are an effective tool to make your clients understand.-Growth Bar Graph With Earth PowerPoint Templates And PowerPoint Themes 1012-This PowerPoint template can be used for presentations relating to-Global profit growth charts with world globe, success, business, finance, marketing, globe
Bar Graph On Bright Background Business PowerPoint Templates Ppt Backgrounds For Slides 1212
We present our Bar Graph On Bright Background Business PowerPoint Templates PPT Backgrounds For Slides 1212.Use our Future PowerPoint Templates because let this slide illustrates others piggyback on you to see well over the horizon. Present our Success PowerPoint Templates because the Venn graphic comprising interlinking circles geometrically demonstate how various functions operating independantly, to a large extent, are essentially interdependant. Download and present our Signs PowerPoint Templates because like your thoughts arrows are inherently precise and true. Download and present our Marketing PowerPoint Templates because The marketplace is the merger of your dreams and your ability. Use our Business PowerPoint Templates because like the famed William Tell, they put aside all emotions and concentrate on the target.Use these PowerPoint slides for presentations relating to Bright bar graph, business, future, success, signs, marketing. The prominent colors used in the PowerPoint template are Yellow, Black, Gray. Customers tell us our Bar Graph On Bright Background Business PowerPoint Templates PPT Backgrounds For Slides 1212 are readymade to fit into any presentation structure. Presenters tell us our graph PowerPoint templates and PPT Slides will help them to explain complicated concepts. Use our Bar Graph On Bright Background Business PowerPoint Templates PPT Backgrounds For Slides 1212 are Lush. PowerPoint presentation experts tell us our graph PowerPoint templates and PPT Slides are Fabulous. Customers tell us our Bar Graph On Bright Background Business PowerPoint Templates PPT Backgrounds For Slides 1212 are Great. Presenters tell us our future PowerPoint templates and PPT Slides are Efficacious.
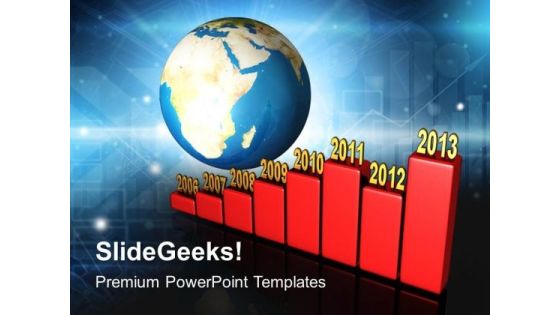
Bar Graph Yearly Along Earth PowerPoint Templates And PowerPoint Themes 1012
Bar Graph Yearly Along Earth PowerPoint Templates And PowerPoint Themes 1012-This PowerPoint Template shows the Annual growth Chart from 2006 to 2013 in the Graphical manner. It imitates the concept of Money, Business, Profit, Loss etc. Use this Template for Increasing and decreasing Bar Graph. Clarity of thought has been the key to your growth. Use our templates to illustrate your ability-Bar Graph Yearly Along Earth PowerPoint Templates And PowerPoint Themes 1012-This PowerPoint template can be used for presentations relating to-Bar graph showing the growth of profits, business, finance, success, earth, globe
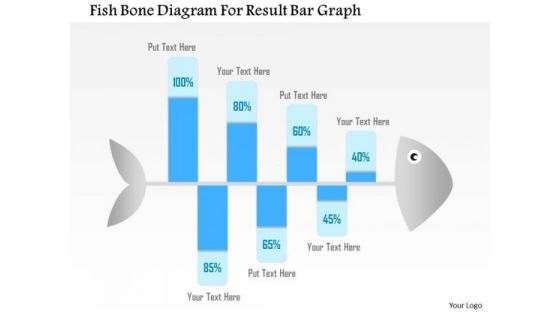
Business Diagram Fish Bone Diagram For Result Bar Graph Presentation Template
Graphic of fish bone has been used to design this Power Point template slide. This PPT slide contains the concept of problem analysis and root cause analysis. Use this PPT slide and display process of root cause analysis for any field. This PPT slide is very well designed for business and production related problem analysis.

Bar Graph Companys Business Model Canvas Ppt PowerPoint Presentation Visual Aids Model
This is a bar graph companys business model canvas ppt powerpoint presentation visual aids model. This is a three stage process. The stages in this process are bar graph, finance, marketing, strategy, analysis, business.

Bar Graph For Sales Revenue Over The Years Ppt PowerPoint Presentation Professional
This is a bar graph for sales revenue over the years ppt powerpoint presentation professional. This is a nine stage process. The stages in this process are business, marketing, growth, bar, years.

Bar Graph Shows Financial Values Ppt PowerPoint Presentation Infographic Template Gridlines
This is a bar graph shows financial values ppt powerpoint presentation infographic template gridlines. This is a two stage process. The stages in this process are bar, marketing, strategy, finance, planning.

Horizontal Bar Graph With Profit Percentage Of Company Ppt PowerPoint Presentation Shapes
This is a horizontal bar graph with profit percentage of company ppt powerpoint presentation shapes. This is a five stage process. The stages in this process are business, strategy, marketing, analysis, slide bar, target.

3d Business Bar Graph Growth Of Year 2013 PowerPoint Templates Ppt Backgrounds For Slides 1212
We present our 3d Business Bar Graph Growth Of Year 2013 PowerPoint Templates PPT Backgrounds For Slides 1212.Download our Americana PowerPoint Templates because it is inspired by the indelible Olympic logo this graphic exemplifies the benefits of teamwork. Download our Success PowerPoint Templates because iT outlines the entire thought process for the benefit of others. Tell it to the world with your characteristic aplomb. Download our Targets PowerPoint Templates because motivating your team will cross all barriers. Download our Business PowerPoint Templates because this is the unerring accuracy in reaching the target. the effortless ability to launch into flight. Download our Marketing PowerPoint Templates because all elements of the venture are equally critical.Use these PowerPoint slides for presentations relating to 2013 american growth business graph, americana, business, marketing, success, targets. The prominent colors used in the PowerPoint template are Blue, Green, White. Professionals tell us our 3d Business Bar Graph Growth Of Year 2013 PowerPoint Templates PPT Backgrounds For Slides 1212 help you meet deadlines which are an element of today's workplace. Just browse and pick the slides that appeal to your intuitive senses. We assure you our graph PowerPoint templates and PPT Slides are Awesome. PowerPoint presentation experts tell us our 3d Business Bar Graph Growth Of Year 2013 PowerPoint Templates PPT Backgrounds For Slides 1212 are Youthful. Presenters tell us our business PowerPoint templates and PPT Slides are Quaint. The feedback we get is that our 3d Business Bar Graph Growth Of Year 2013 PowerPoint Templates PPT Backgrounds For Slides 1212 will save the presenter time. You can be sure our business PowerPoint templates and PPT Slides are Nice.
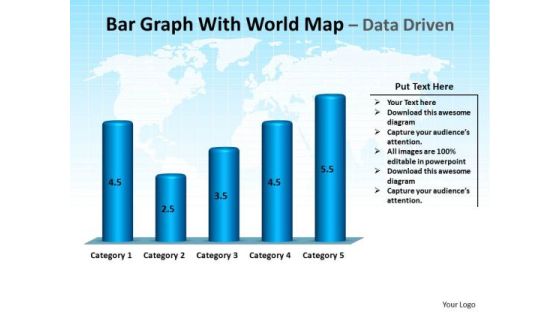
Business Success PowerPoint Templates Business Bar Graph With World Map Ppt Slides
Business Success PowerPoint Templates Business bar graph with world map PPT Slides-This PowerPoint Template is a illustration of bar garph with world map on blue background -Business Success PowerPoint Templates Business bar graph with world map PPT Slides-This ppt can be used for concepts relating to-animated, business, finance, sales, marketing, accounting, future, education, america, Antarctica, arrow, Asia, charts, statistics, budget, investment, abstract, australia, background, bar, blue, calculation, company and continents.
Globe With Search Bar Vector Icon Ppt PowerPoint Presentation File Visual Aids PDF
Presenting globe with search bar vector icon ppt powerpoint presentation file visual aids pdf to dispense important information. This template comprises three stages. It also presents valuable insights into the topics including globe with search bar vector icon. This is a completely customizable PowerPoint theme that can be put to use immediately. So, download it and address the topic impactfully.
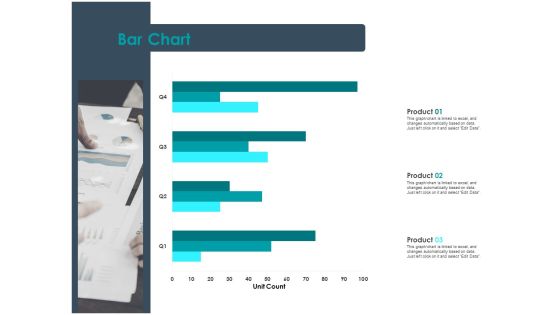
Strategic Plan For Companys Development Bar Chart Ppt PowerPoint Presentation Visual Aids Gallery
Presenting this set of slides with name strategic plan for companys development bar chart ppt powerpoint presentation visual aids gallery. The topics discussed in these slide is bar chart. This is a completely editable PowerPoint presentation and is available for immediate download. Download now and impress your audience.

Customer Relationship Management In Freehold Property Clustered Bar Ppt Professional Visual Aids PDF
Presenting this set of slides with name customer relationship management in freehold property clustered bar ppt professional visual aids pdf. The topics discussed in these slide is clustered bar. This is a completely editable PowerPoint presentation and is available for immediate download. Download now and impress your audience.

Arrow Bar Chart With Four Circles Ppt PowerPoint Presentation Icon Background Images PDF
Presenting this set of slides with name arrow bar chart with four circles ppt powerpoint presentation icon background images pdf. This is a four stage process. The stages in this process are arrow bar chart with four circles. This is a completely editable PowerPoint presentation and is available for immediate download. Download now and impress your audience.

Bar Chart With Arrow For Future Planning Vector Icon Ppt Gallery Background Image PDF
Presenting bar chart with arrow for future planning vector icon ppt gallery background image pdf to dispense important information. This template comprises three stages. It also presents valuable insights into the topics including bar chart with arrow for future planning vector icon. This is a completely customizable PowerPoint theme that can be put to use immediately. So, download it and address the topic impactfully.
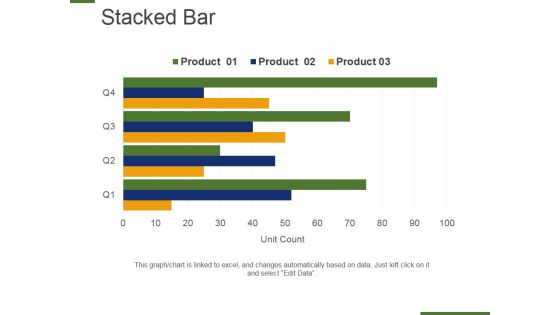
Stacked Bar Template 2 Ppt PowerPoint Presentation Visual Aids Background Images
This is a stacked bar template 2 ppt powerpoint presentation visual aids background images. This is a two stage process. The stages in this planning, management, strategy, marketing, business.

Client Image In Restaurant And Bar Ppt PowerPoint Presentation Gallery Templates PDF
Presenting this set of slides with name client image in restaurant and bar ppt powerpoint presentation gallery templates pdf. The topics discussed in these slide is client image in restaurant and bar. This is a completely editable PowerPoint presentation and is available for immediate download. Download now and impress your audience.

Designing Compensation Systems For Professionals Clustered Bar Ppt Show Background Images PDF
Presenting this set of slides with name designing compensation systems for professionals clustered bar ppt show background images pdf. The topics discussed in these slide is clustered bar. This is a completely editable PowerPoint presentation and is available for immediate download. Download now and impress your audience.

Client Health Score Clustered Bar Ppt PowerPoint Presentation Summary Background Images PDF
Presenting this set of slides with name client health score clustered bar ppt powerpoint presentation summary background images pdf. The topics discussed in these slides are clustered bar, 2019 to 2020. This is a completely editable PowerPoint presentation and is available for immediate download. Download now and impress your audience.

Bar Graph For Financial Growth Analysis Ppt PowerPoint Presentation Gallery Background Images PDF
Presenting this set of slides with name bar graph for financial growth analysis ppt powerpoint presentation gallery background images pdf. The topics discussed in these slide is bar graph for financial growth analysis. This is a completely editable PowerPoint presentation and is available for immediate download. Download now and impress your audience.

Business Man With Bar Chart Vector Icon Ppt PowerPoint Presentation File Images PDF
Presenting this set of slides with name business man with bar chart vector icon ppt powerpoint presentation file images pdf. The topics discussed in these slide is business man with bar chart vector icon. This is a completely editable PowerPoint presentation and is available for immediate download. Download now and impress your audience.

Bar Graph Showing Net Changes In Cash Flow Ppt PowerPoint Presentation Gallery Clipart Images PDF
Showcasing this set of slides titled bar graph showing net changes in cash flow ppt powerpoint presentation gallery clipart images pdf. The topics addressed in these templates are bar graph showing net changes in cash flow. All the content presented in this PPT design is completely editable. Download it and make adjustments in color, background, font etc. as per your unique business setting.

Bar Graph Representing Accomplishment Metrics For Customer Service Team Icons PDF
This slide shows the graphical representation of success metrics that helps to measure the customer service team which includes customer lifetime value, customer churn, net promoter score, revenues churn, customer experience score, customer renewals, etc. Showcasing this set of slides titled bar graph representing accomplishment metrics for customer service team icons pdf. The topics addressed in these templates are importance level, least important. All the content presented in this PPT design is completely editable. Download it and make adjustments in color, background, font etc. as per your unique business setting.

Bar Chart Representing Quality Management Tools And Techniques For Process Improvement Download PDF
This slide focuses on the graphical representation of quality management software tools which includes quality management system, enterprise resource planning, business intelligence and manufacturing operations management with top performers, etc. Showcasing this set of slides titled bar chart representing quality management tools and techniques for process improvement download pdf. The topics addressed in these templates are manufacturing operations management, business intelligence, enterprise resource planning, quality management system. All the content presented in this PPT design is completely editable. Download it and make adjustments in color, background, font etc. as per your unique business setting.

Bar Graph Representing Importance Of Human Resource Cloud Automation System Background PDF
This slide shows the graphical representation of cloud automation system for human resource which includes the benefits to organization such as better employee experience, real time data, strategic functions, less training needs, better employee insights, etc. Showcasing this set of slides titled Bar Graph Representing Importance Of Human Resource Cloud Automation System Background PDF. The topics addressed in these templates are System, Resource, Reduced. All the content presented in this PPT design is completely editable. Download it and make adjustments in color, background, font etc. as per your unique business setting.

Bar Graph Representing Challenges In 3 PL Supply Chain Management Slides PDF
This slide shows the graphical representation of challenges faced by third party logistics industry in providing supply chain services such as reducing costs, improving process and customer service, supply chain visibility, training to labour, reducing labour expenses, etc. Showcasing this set of slides titled Bar Graph Representing Challenges In 3 PL Supply Chain Management Slides PDF. The topics addressed in these templates are Reducing Transport Costs, Technologies. All the content presented in this PPT design is completely editable. Download it and make adjustments in color, background, font etc. as per your unique business setting.

Bar Graph Representing Risk Assessment Variant On Basis Of Impact Level Topics PDF
This slide shows the graphical representation of risk scenario on the basis of impact category score and degree of severity which includes impacted categories such as people, economy, environment, territorial security, business reputation, etc. Showcasing this set of slides titled Bar Graph Representing Risk Assessment Variant On Basis Of Impact Level Topics PDF. The topics addressed in these templates are Measuring Metrics, Organization, Greater Impact. All the content presented in this PPT design is completely editable. Download it and make adjustments in color, background, font etc. as per your unique business setting.

Business Cycle Diagram Eight Stages Stack Diagram Business Bar Graph Strategy Diagram
Get Out Of The Dock With Our Business Cycle Diagram Eight Stages Stack Diagram Business Bar Graph Strategy Diagram Powerpoint Templates. Your Mind Will Be Set Free.

Return Of Investment Bar Chart For Business Powerpoint Slide Designs Download
This is a return of investment bar chart for business powerpoint slide designs download. This is a four stage process. The stages in this process are product.

Business Sales PowerPoint Templates Business Bar Chart Data Driven Ppt Slides
Business Sales PowerPoint Templates Business bar chart data driven PPT Slides-This PowerPoint d Editable Data-Driven Chart is for visualizing your figures and data. Business Sales PowerPoint Templates Business bar chart data driven PPT Slides-This ppt can be used for concepts relating to-Chat, Illustration, data driven, figures, charts and Graphs.
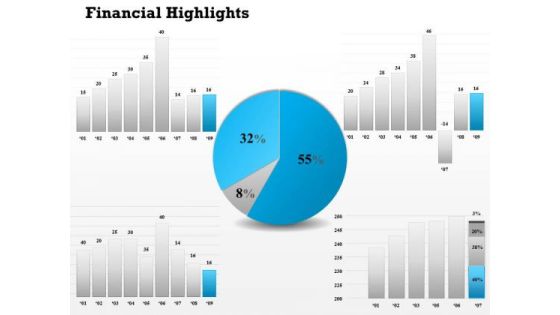
Consulting Diagram Financial Pie And Bar Graph Diagram Business Cycle Diagram
Doll Up Your Thoughts With Our Consulting Diagram Financial Pie And Bar Graph Diagram Business Cycle Diagram Powerpoint Templates. They Will Make A Pretty Picture. They Say A Dog Is Man's Best Friend. Our Consulting Diagram Financial Pie And Bar Graph Diagram Business Cycle Diagram Powerpoint Templates Come A Close Second.

Sales Diagram Financial Result Display Bar Graph Diagram Business Framework Model
Our Sales Diagram Financial Result Display Bar Graph Diagram Business Framework Model Powerpoint Templates Deliver At Your Doorstep. Let Them In For A Wonderful Experience. Dig Out The Dope With Our Sales Diagram Financial Result Display Bar Graph Diagram Business Framework Model Powerpoint Templates. Your Thoughts Will Expose The Truth.

Strategic Management Bar Graph For Business And Financial Growth Business Diagram
Connect The Dots With Our Strategic Management Bar Graph For Business And Financial Growth Business Diagram Powerpoint Templates. Watch The Whole Picture Clearly Emerge. Dot Your Thoughts With Our Strategic Management Bar Graph For Business And Financial Growth Business Diagram Powerpoint Templates. Give Your Demeanor That Propel Look.

Brain With Bar Graph Vector Icon Ppt PowerPoint Presentation Ideas Slideshow PDF
Presenting this set of slides with name brain with bar graph vector icon ppt powerpoint presentation ideas slideshow pdf. This is a three stage process. The stages in this process are brain with bar graph vector icon. This is a completely editable PowerPoint presentation and is available for immediate download. Download now and impress your audience.

Business Bar Graph For Future Planning Icon Ppt PowerPoint Presentation Professional Skills PDF
Presenting business bar graph for future planning icon ppt powerpoint presentation professional skills pdf to dispense important information. This template comprises three stages. It also presents valuable insights into the topics including business bar graph for future planning icon. This is a completely customizable PowerPoint theme that can be put to use immediately. So, download it and address the topic impactfully.

Bar Chart For Facts Stats Growth And Percentage Analysis Ppt PowerPoint Presentation Styles Infographic Template
Presenting this set of slides with name bar chart for facts stats growth and percentage analysis ppt powerpoint presentation styles infographic template. This is a six stage process. The stages in this process are education, growth, pencil bar graph. This is a completely editable PowerPoint presentation and is available for immediate download. Download now and impress your audience.

Bar Chart Showing Growth Trends Over The Years Ppt PowerPoint Presentation Slides Layout
Presenting this set of slides with name bar chart showing growth trends over the years ppt powerpoint presentation slides layout. This is a five stage process. The stages in this process are education, growth, pencil bar graph. This is a completely editable PowerPoint presentation and is available for immediate download. Download now and impress your audience.

Business Growth Bar Chart Vector Icon Ppt PowerPoint Presentation Outline Professional
Presenting this set of slides with name business growth bar chart vector icon ppt powerpoint presentation outline professional. This is a one stage process. The stages in this process are business growth, bar chart. This is a completely editable PowerPoint presentation and is available for immediate download. Download now and impress your audience.
Growth Icon Bar Chart With Gear Ppt PowerPoint Presentation Icon Slides
Presenting this set of slides with name growth icon bar chart with gear ppt powerpoint presentation icon slides. This is a one stage process. The stages in this process are growth icon bar chart, gear. This is a completely editable PowerPoint presentation and is available for immediate download. Download now and impress your audience.

Business Growth Analysis Bar Chart Vector Icon Ppt PowerPoint Presentation Model Outline
Presenting this set of slides with name business growth analysis bar chart vector icon ppt powerpoint presentation model outline. This is a one stage process. The stages in this process are business growth, analysis, bar chart vector icon. This is a completely editable PowerPoint presentation and is available for immediate download. Download now and impress your audience.

Man On Bar Graph For Future Analysis Ppt PowerPoint Presentation Ideas Smartart
Presenting this set of slides with name man on bar graph for future analysis ppt powerpoint presentation ideas smartart. This is a one stage process. The stages in this process are man on bar graph for future analysis. This is a completely editable PowerPoint presentation and is available for immediate download. Download now and impress your audience.

Bar Chart With Declining Arrow Vector Icon Ppt PowerPoint Presentation Show Designs Download
Presenting this set of slides with name bar chart with declining arrow vector icon ppt powerpoint presentation show designs download. This is a three stage process. The stages in this process are bar chart with declining arrow vector icon. This is a completely editable PowerPoint presentation and is available for immediate download. Download now and impress your audience.
Sales Growth Bar Chart Vector Icon Ppt PowerPoint Presentation Infographics Layout
Presenting this set of slides with name sales growth bar chart vector icon ppt powerpoint presentation infographics layout. This is a three stage process. The stages in this process are sales growth, bar chart vector icon. This is a completely editable PowerPoint presentation and is available for immediate download. Download now and impress your audience.

Bar Graph Showing Negative Trend Ppt PowerPoint Presentation Summary Master Slide
Presenting this set of slides with name bar graph showing negative trend ppt powerpoint presentation summary master slide. This is a one stage process. The stages in this process are bar graph showing negative trend. This is a completely editable PowerPoint presentation and is available for immediate download. Download now and impress your audience.
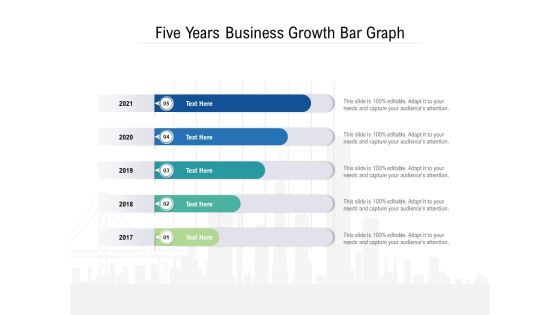
Five Years Business Growth Bar Graph Ppt PowerPoint Presentation Infographic Template Slideshow
Presenting this set of slides with name five years business growth bar graph ppt powerpoint presentation infographic template slideshow. This is a five stage process. The stages in this process are five years business growth bar graph. This is a completely editable PowerPoint presentation and is available for immediate download. Download now and impress your audience.

Bar Graph With Dollar Sign For Profit Trends Vector Icon Ppt PowerPoint Presentation Show Designs
Presenting this set of slides with name bar graph with dollar sign for profit trends vector icon ppt powerpoint presentation show designs. This is a one stage process. The stage in this process is bar graph with dollar sign for profit trends vector icon. This is a completely editable PowerPoint presentation and is available for immediate download. Download now and impress your audience.

Bar Graph With Star On Top Vector Icon Ppt PowerPoint Presentation Infographics Gridlines
Presenting this set of slides with name bar graph with star on top vector icon ppt powerpoint presentation infographics gridlines. This is a three stage process. The stages in this process are bar graph with star on top vector icon. This is a completely editable PowerPoint presentation and is available for immediate download. Download now and impress your audience.
Financial Document With Bar Graph Vector Icon Ppt PowerPoint Presentation Model Layout PDF
Presenting this set of slides with name financial document with bar graph vector icon ppt powerpoint presentation model layout pdf. This is a three stage process. The stages in this process are financial document with bar graph vector icon. This is a completely editable PowerPoint presentation and is available for immediate download. Download now and impress your audience.

 Home
Home