Bar Graphics

Bar Graph Showing New Business Launch Ppt PowerPoint Presentation File Clipart PDF
Presenting bar graph showing new business launch ppt powerpoint presentation file clipart pdf to dispense important information. This template comprises three stages. It also presents valuable insights into the topics including bar graph showing new business launch. This is a completely customizable PowerPoint theme that can be put to use immediately. So, download it and address the topic impactfully.

Customer Service Reporting Icon With Bar Graph Ppt Styles File Formats PDF
Presenting customer service reporting icon with bar graph ppt styles file formats pdf to dispense important information. This template comprises three stages. It also presents valuable insights into the topics including customer service reporting icon with bar graph. This is a completely customizable PowerPoint theme that can be put to use immediately. So, download it and address the topic impactfully.

Data Consumption Icon With Bar Chart Ppt PowerPoint Presentation File Skills PDF
Presenting data consumption icon with bar chart ppt powerpoint presentation file skills pdf to dispense important information. This template comprises three stages. It also presents valuable insights into the topics including data consumption icon with bar chart. This is a completely customizable PowerPoint theme that can be put to use immediately. So, download it and address the topic impactfully.
Statistical Data Icon Of Data Analytics Using Bar Graph Background PDF
Presenting statistical data icon of data analytics using bar graph background pdf to dispense important information. This template comprises four stages. It also presents valuable insights into the topics including statistical data icon of data analytics using bar graph. This is a completely customizable PowerPoint theme that can be put to use immediately. So, download it and address the topic impactfully.
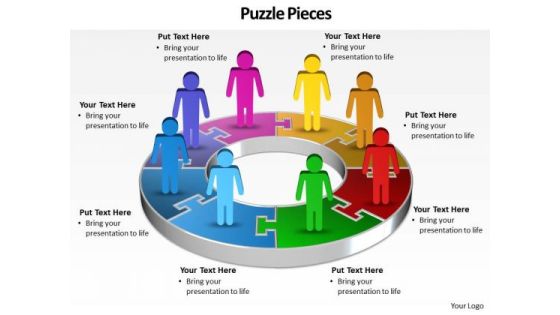
Ppt A Team Of Business People Standing On Pie PowerPoint Bar Chart Ks2 Pieces Templates
PPT a team of business people standing on pie powerpoint bar chart ks2 pieces Templates-This Business PowerPoint Diagram shows 3d linear abstraction to represent Business related issues. It uses three steps. It indicates employment, field, function, game, line, and livelihood. It is helpful to organize information. -PPT a team of business people standing on pie powerpoint bar chart ks2 pieces Templates-Abstract, Arrow, Art, Artistic, Background, Business, Colorful, Communication, Computer-Graphics, Concept, Creation, Data, Decoration, Decorative, Design, Design-Element, Digital, Direction, Effect, Elegance, Element, Energy, Flow, Go, Idea, Illustration, Modern, Movement, Network, Symbol

Visual Data Presentation With Bar Chart Ppt PowerPoint Presentation Portfolio Brochure
This is a visual data presentation with bar chart ppt powerpoint presentation portfolio brochure. This is a four stage process. The stages in this process are visual aids, communication, business.

3D Bar Chart For Percentage Values Comparison Ppt PowerPoint Presentation Professional Visual Aids
This is a 3d bar chart for percentage values comparison ppt powerpoint presentation professional visual aids. This is a five stage process. The stages in this process are art, colouring, paint brush.

3D Bar Chart For Technical Analysis Ppt PowerPoint Presentation Summary Visuals
This is a 3d bar chart for technical analysis ppt powerpoint presentation summary visuals. This is a five stage process. The stages in this process are art, colouring, paint brush.

100 Percent Stacked Bar Strategy Approaches Ppt PowerPoint Presentation Gallery Visual Aids
This is a 100 percent stacked bar strategy approaches ppt powerpoint presentation gallery visual aids. This is a three stage process. The stages in this process are business, management, strategy, analysis, marketing.

Vector Showing Statistics Comparison Bar Chart Ppt Visual Aids Styles PDF
Persuade your audience using this Vector Showing Statistics Comparison Bar Chart Ppt Visual Aids Styles PDF. This PPT design covers three stages, thus making it a great tool to use. It also caters to a variety of topics including vector showing statistics comparison bar chart. Download this PPT design now to present a convincing pitch that not only emphasizes the topic but also showcases your presentation skills.
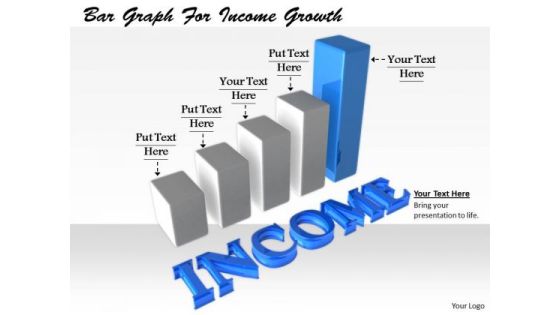
Stock Photo Business Management Strategy Bar Graph For Income Growth Stock Images
Experiment With Your Thoughts As You Desire. Our stock photo business management strategy bar graph for income growth stock images Will Be All For It. Stand On Your Own Feet With Our finance. You Will Discover Personal Power.
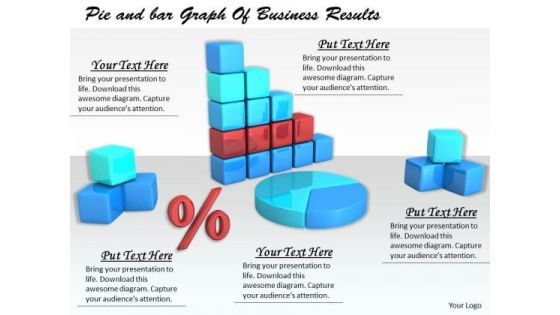
Stock Photo Business Strategy Examples Pie And Bar Graph Of Results Images
Plan For All Contingencies With Our Stock Photo Business Strategy Examples Pie And Bar Graph Of Results Images Powerpoint Templates. Douse The Fire Before It Catches. Generate Camaraderie With Our sales Powerpoint Templates. Good Wishes Will Come Raining Down.
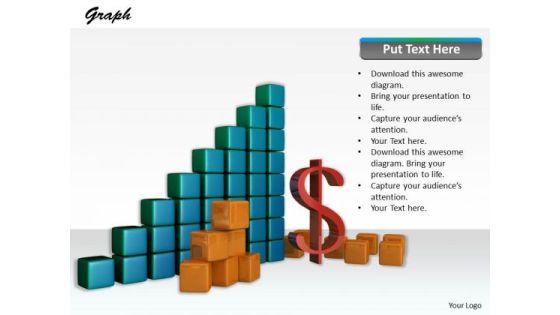
Stock Photo Modern Marketing Concepts See The Financial Bar Graph Business Images
Be The Dramatist With Our Stock Photo Modern Marketing Concepts See The Financial Bar Graph Business Images Powerpoint Templates. Script Out The Play Of Words. Put Our sales Powerpoint Templates Into The Draw. Your Thoughts Will Win The Lottery.
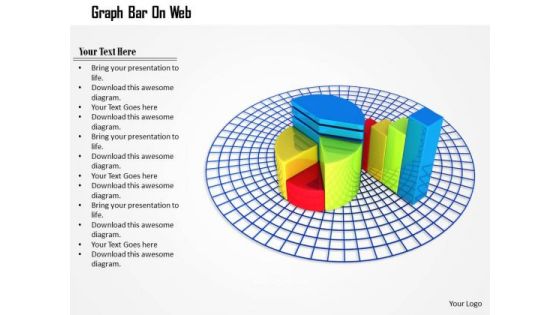
Stock Photo Pie Chart And Bar Graph On Web PowerPoint Slide
This image is designed with pie chart and bar graph on web. Use this diagram to explain your strategy to co-ordinate activities. Deliver amazing presentations to mesmerize your audience.
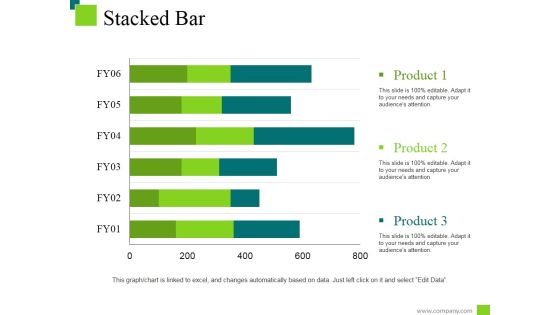
Stacked Bar Template 2 Ppt PowerPoint Presentation Infographic Template File Formats
This is a stacked bar template 2 ppt powerpoint presentation infographic template file formats. This is a three stage process. The stages in this process are product, business, marketing, management.

3D Bar Chart To Display Data Ppt PowerPoint Presentation Icon Design Inspiration
This is a 3d bar chart to display data ppt powerpoint presentation icon design inspiration. This is a four stage process. The stages in this process are art, colouring, paint brush.

Stock Market Trend Dollar Sign On Bar Graph Ppt Powerpoint Presentation Show Deck
This is a stock market trend dollar sign on bar graph ppt powerpoint presentation show deck. This is a four stage process. The stages in this process are stock market, financial market, bull market.
Growth Arrow On Bar Graph Icon Ppt Powerpoint Presentation Infographic Template Clipart
This is a growth arrow on bar graph icon ppt powerpoint presentation infographic template clipart. This is a three stage process. The stages in this process are financial statements icon, accounting ratio icon, balance sheet icon.

Bar Chart With Growth Arrow For Business Expansion Ppt Powerpoint Presentation File Vector
This is a bar chart with growth arrow for business expansion ppt powerpoint presentation file vector. This is a two stage process. The stages in this process are expanding, business development, business expansion.

Bar Graph To Present Financial Information Ppt PowerPoint Presentation Show Tips
This is a bar graph to present financial information ppt powerpoint presentation show tips. This is a four stage process. The stages in this process are stock market, financial markets, bull market.

Downward Arrow On Bar Graph For Financial Loss Ppt PowerPoint Presentation Infographics Sample
This is a downward arrow on bar graph for financial loss ppt powerpoint presentation infographics sample. This is a three stage process. The stages in this process are business failure, unsuccessful business, business non success.
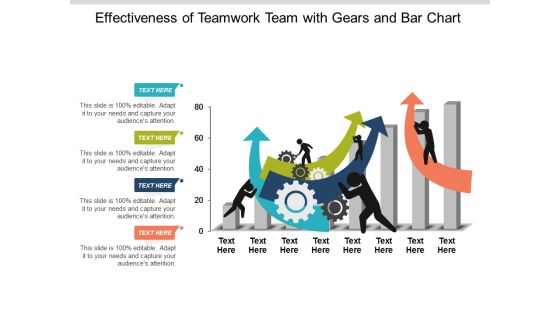
Effectiveness Of Teamwork Team With Gears And Bar Chart Ppt Powerpoint Presentation Ideas Information
This is a effectiveness of teamwork team with gears and bar chart ppt powerpoint presentation ideas information. This is a four stage process. The stages in this process are team performance, member performance, group performance.

5 Level Bar Graph For Analysis With Icons Ppt PowerPoint Presentation Shapes
This is a 5 level bar graph for analysis with icons ppt powerpoint presentation shapes. This is a five stage process. The stages in this process are business, strategy, marketing, icons, growth, management.

Bar Chart With Annual Performance Analysis Over Years Ppt PowerPoint Presentation Design Ideas
This is a bar chart with annual performance analysis over years ppt powerpoint presentation design ideas. This is a five stage process. The stages in this process are business, strategy, marketing, analysis, line graph.

Bar Graph To Show Company Sales Budget Ppt PowerPoint Presentation Sample
This is a bar graph to show company sales budget ppt powerpoint presentation sample. This is a four stage process. The stages in this process are business, finance, growth, success, marketing, arrow.

Red Board With Arrow Bar For Target Market Ppt PowerPoint Presentation Clipart
This is a red board with arrow bar for target market ppt powerpoint presentation clipart. This is a three stage process. The stages in this process are our goals, arrows, marketing, strategy, business, success.

Magnifier With Tools And Bar Graph Ppt PowerPoint Presentation Portfolio Templates
This is a magnifier with tools and bar graph ppt powerpoint presentation portfolio templates. This is a four stage process. The stages in this process are magnifier, search, marketing, strategy, business.

Bar Chart For Business Performance Evaluation Ppt PowerPoint Presentation Infographics Professional
This is a bar chart for business performance evaluation ppt powerpoint presentation infographics professional. This is a five stage process. The stages in this process are metrics icon, kpis icon, statistics icon.

Clustered Bar Chart Yearly Operating Plan Ppt PowerPoint Presentation Styles Icon
This is a clustered bar chart yearly operating plan ppt powerpoint presentation styles icon. This is a four stage process. The stages in this process are business, management, strategy, analysis, marketing.

Bar Charts For Business Performance Analysis Ppt PowerPoint Presentation Show Slideshow
This is a bar charts for business performance analysis ppt powerpoint presentation show slideshow. This is a two stage process. The stages in this process are compare, comparison of two, competitive analysis.

Demonstration Icon Man Showing Bar Chart Ppt Powerpoint Presentation Styles Ideas
This is a demonstration icon man showing bar chart ppt powerpoint presentation styles ideas. This is a three stage process. The stages in this process are illustration, show, demo.

Staked Bar Planning Business Ppt PowerPoint Presentation Infographic Template Infographic Template
This is a staked bar planning business ppt powerpoint presentation infographic template infographic template. This is a three stage process. The stages in this process are finance, marketing, analysis, business, investment.
Bar Graph Icon Showing Operating Rhythm Ppt Powerpoint Presentation Ideas Templates
This is a bar graph icon showing operating rhythm ppt powerpoint presentation ideas templates. This is a three stage process. The stages in this process are six sigma, operating rhythm, business rhythm.

Bar Chart With Magnifying Glass For Financial Analysis Ppt Powerpoint Presentation Infographics Designs Download
This is a bar chart with magnifying glass for financial analysis ppt powerpoint presentation infographics designs download. This is a three stage process. The stages in this process are business metrics, business kpi, business dashboard.

Bar Graph Icon For Data Analysis Ppt PowerPoint Presentation Pictures Ideas
This is a bar graph icon for data analysis ppt powerpoint presentation pictures ideas. This is a four stage process. The stages in this process are financial analysis, quantitative, statistical modelling.

Financial Analysis Vector Bar Graph With Magnifying Glass Ppt PowerPoint Presentation Gallery Design Ideas
This is a financial analysis vector bar graph with magnifying glass ppt powerpoint presentation gallery design ideas. This is a four stage process. The stages in this process are marketing analytics, marketing performance, marketing discovery.

Worldwide Market Trends Mobile With Bar Graph And Globe Ppt PowerPoint Presentation Styles Demonstration
This is a worldwide market trends mobile with bar graph and globe ppt powerpoint presentation styles demonstration. This is a four stage process. The stages in this process are marketing analytics, marketing performance, marketing discovery.

Clustered Bar Chart Percentage Product Ppt PowerPoint Presentation Portfolio Example Introduction
This is a clustered bar chart percentage product ppt powerpoint presentation portfolio example introduction. This is a three stage process. The stages in this process are area chart, finance, marketing, management, investment.
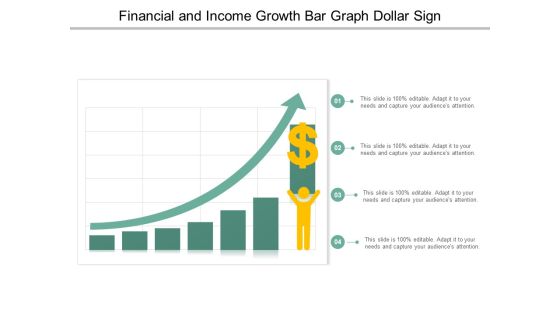
Financial And Income Growth Bar Graph Dollar Sign Ppt PowerPoint Presentation Professional Shapes
This is a financial and income growth bar graph dollar sign ppt powerpoint presentation professional shapes. This is a four stage process. The stages in this process are growth, increase sales, increase revenue.
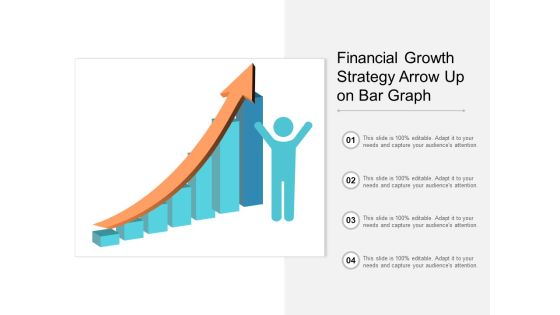
Financial Growth Strategy Arrow Up On Bar Graph Ppt PowerPoint Presentation Gallery Example
This is a financial growth strategy arrow up on bar graph ppt powerpoint presentation gallery example. This is a four stage process. The stages in this process are growth, increase sales, increase revenue.
Profit Growth Bar Graph With Rising Arrow And Dollar Sign Ppt PowerPoint Presentation Icon Designs
This is a profit growth bar graph with rising arrow and dollar sign ppt powerpoint presentation icon designs. This is a five stage process. The stages in this process are growth, increase sales, increase revenue.

Growth Arrow On Bar Graph Vector Ppt Powerpoint Presentation Layouts Master Slide
This is a growth arrow on bar graph vector ppt powerpoint presentation layouts master slide. This is a three stage process. The stages in this process are increasing arrows, improving arrows, growing arrows.
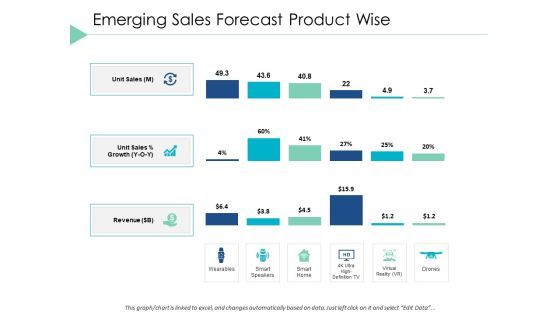
Emerging Sales Forecast Product Wise Bar Ppt PowerPoint Presentation Portfolio Slide Portrait
This is a emerging sales forecast product wise bar ppt powerpoint presentation portfolio slide portrait. This is a four stage process. The stages in this process are finance, marketing, analysis, investment, million.

Bar Graph With Upward Arrow For Financial Success Ppt PowerPoint Presentation Infographic Template Model
This is a bar graph with upward arrow for financial success ppt powerpoint presentation infographic template model. This is a five stage process. The stages in this process are rising arrow, growing arrow, increasing arrow.

Economic Growth Arrow With Bar Graph On Human Hand Ppt PowerPoint Presentation Infographics Ideas
This is a economic growth arrow with bar graph on human hand ppt powerpoint presentation infographics ideas. This is a four stage process. The stages in this process are rising arrow, growing arrow, increasing arrow.

Financial Success Arrow On Bar Chart Ppt PowerPoint Presentation Ideas Display
This is a financial success arrow on bar chart ppt powerpoint presentation ideas display. This is a four stage process. The stages in this process are rising arrow, growing arrow, increasing arrow.

Bar Graph Finance Planning Ppt PowerPoint Presentation Infographic Template Master Slide
This is a bar graph finance planning ppt powerpoint presentation infographic template master slide. This is a two stage process. The stages in this process are finance, analysis, business, investment, marketing.
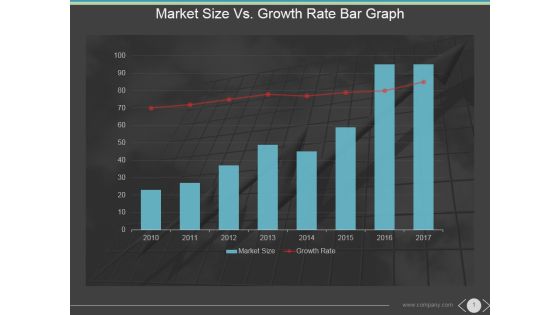
Market Size Vs Growth Rate Bar Graph Ppt PowerPoint Presentation Themes
This is a market size vs growth rate bar graph ppt powerpoint presentation themes. This is a eight stage process. The stages in this process are market size, growth rate, years, future, graph.

Bar Graph With Arrow For Career Planning Ppt PowerPoint Presentation Gallery
This is a bar graph with arrow for career planning ppt powerpoint presentation gallery. This is a six stage process. The stages in this process are business, finance, marketing, strategy, planning, success, arrow.

Bar Chart With Person Standing On Right Side Ppt PowerPoint Presentation File Portrait PDF
Persuade your audience using this bar chart with person standing on right side ppt powerpoint presentation file portrait pdf. This PPT design covers three stages, thus making it a great tool to use. It also caters to a variety of topics including bar chart with person standing on right side. Download this PPT design now to present a convincing pitch that not only emphasizes the topic but also showcases your presentation skills.

Bar Graph With Eye For Future Planning Ppt PowerPoint Presentation Icon Outline PDF
Persuade your audience using this bar graph with eye for future planning ppt powerpoint presentation icon outline pdf. This PPT design covers three stages, thus making it a great tool to use. It also caters to a variety of topics including bar graph with eye for future planning. Download this PPT design now to present a convincing pitch that not only emphasizes the topic but also showcases your presentation skills.

Businessman With Bar Graph Vector Icon Ppt PowerPoint Presentation File Deck PDF
Persuade your audience using this businessman with bar graph vector icon ppt powerpoint presentation file deck pdf. This PPT design covers three stages, thus making it a great tool to use. It also caters to a variety of topics including businessman with bar graph vector icon. Download this PPT design now to present a convincing pitch that not only emphasizes the topic but also showcases your presentation skills.
Handshake With Bar Graph Vector Icon Ppt PowerPoint Presentation File Clipart PDF
Persuade your audience using this handshake with bar graph vector icon ppt powerpoint presentation file clipart pdf. This PPT design covers two stages, thus making it a great tool to use. It also caters to a variety of topics including handshake with bar graph vector icon. Download this PPT design now to present a convincing pitch that not only emphasizes the topic but also showcases your presentation skills.
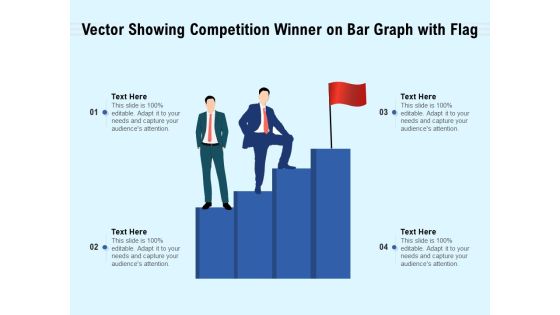
Vector Showing Competition Winner On Bar Graph With Flag Ppt PowerPoint Presentation File Sample PDF
Presenting vector showing competition winner on bar graph with flag ppt powerpoint presentation file sample pdf to dispense important information. This template comprises four stages. It also presents valuable insights into the topics including vector showing competition winner on bar graph with flag. This is a completely customizable PowerPoint theme that can be put to use immediately. So, download it and address the topic impactfully.

Bar Chart With Business Man For Career Growth Vector Icon Ppt PowerPoint Presentation Layouts Samples PDF
Persuade your audience using this bar chart with business man for career growth vector icon ppt powerpoint presentation layouts samples pdf. This PPT design covers one stages, thus making it a great tool to use. It also caters to a variety of topics including bar chart with business man for career growth vector icon. Download this PPT design now to present a convincing pitch that not only emphasizes the topic but also showcases your presentation skills.

Business Financial Growth Bar Graph With Dollar Symbol Icon Ppt PowerPoint Presentation File Ideas PDF
Persuade your audience using this business financial growth bar graph with dollar symbol icon ppt powerpoint presentation file ideas pdf. This PPT design covers one stages, thus making it a great tool to use. It also caters to a variety of topics including business financial growth bar graph with dollar symbol icon. Download this PPT design now to present a convincing pitch that not only emphasizes the topic but also showcases your presentation skills.
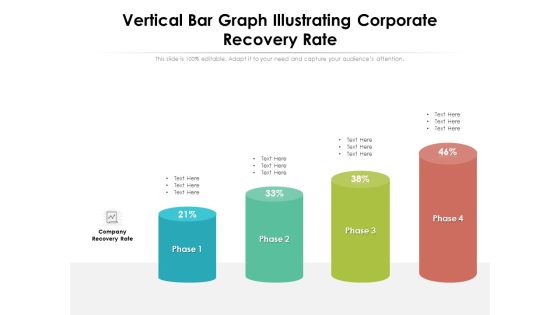
Vertical Bar Graph Illustrating Corporate Recovery Rate Ppt PowerPoint Presentation File Design Inspiration PDF
Persuade your audience using this vertical bar graph illustrating corporate recovery rate ppt powerpoint presentation file design inspiration pdf. This PPT design covers four stages, thus making it a great tool to use. It also caters to a variety of topics including vertical bar graph illustrating corporate recovery rate. Download this PPT design now to present a convincing pitch that not only emphasizes the topic but also showcases your presentation skills.
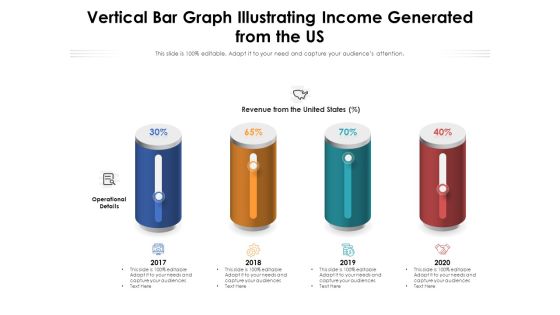
Vertical Bar Graph Illustrating Income Generated From The US Ppt PowerPoint Presentation Gallery Structure PDF
Persuade your audience using this vertical bar graph illustrating income generated from the us ppt powerpoint presentation gallery structure pdf. This PPT design covers four stages, thus making it a great tool to use. It also caters to a variety of topics including vertical bar graph illustrating income generated from the us. Download this PPT design now to present a convincing pitch that not only emphasizes the topic but also showcases your presentation skills.
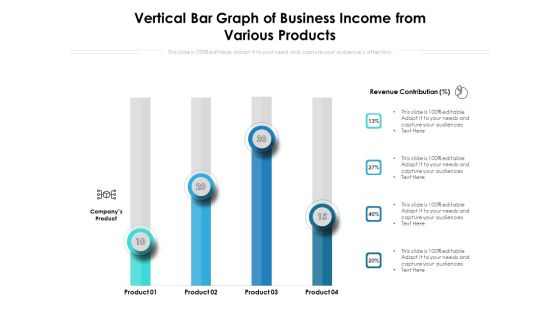
Vertical Bar Graph Of Business Income From Various Products Ppt PowerPoint Presentation File Introduction PDF
Persuade your audience using this vertical bar graph of business income from various products ppt powerpoint presentation file introduction pdf. This PPT design covers four stages, thus making it a great tool to use. It also caters to a variety of topics including vertical bar graph of business income from various products. Download this PPT design now to present a convincing pitch that not only emphasizes the topic but also showcases your presentation skills.
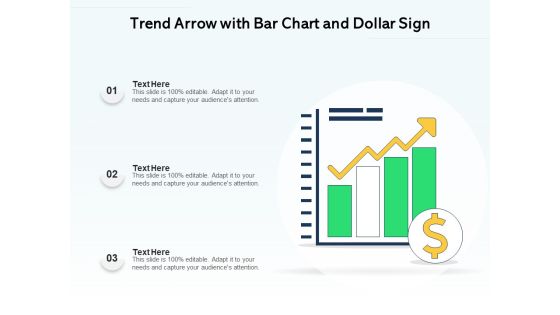
Trend Arrow With Bar Chart And Dollar Sign Ppt PowerPoint Presentation Influencers PDF
Persuade your audience using this trend arrow with bar chart and dollar sign ppt powerpoint presentation influencers pdf. This PPT design covers three stages, thus making it a great tool to use. It also caters to a variety of topics including trend arrow with bar chart and dollar sign. Download this PPT design now to present a convincing pitch that not only emphasizes the topic but also showcases your presentation skills.

 Home
Home