AI PPT Maker
Templates
PPT Bundles
Design Services
Business PPTs
Business Plan
Management
Strategy
Introduction PPT
Roadmap
Self Introduction
Timelines
Process
Marketing
Agenda
Technology
Medical
Startup Business Plan
Cyber Security
Dashboards
SWOT
Proposals
Education
Pitch Deck
Digital Marketing
KPIs
Project Management
Product Management
Artificial Intelligence
Target Market
Communication
Supply Chain
Google Slides
Research Services
 One Pagers
All Categories
-
Home
- Customer Favorites
- Bar Graph
Bar Graph

Cyber Computing Services Risk Analysis Software Status Chart Portrait PDF
This slide illustrates different digitally enabled cyber computing applications. It includes risk severity chart, action cost along with risk owner details and implementation due date. Showcasing this set of slides titled Cyber Computing Services Risk Analysis Software Status Chart Portrait PDF. The topics addressed in these templates are Risk Treatment, Risk Owner, Implementation. All the content presented in this PPT design is completely editable. Download it and make adjustments in color, background, font etc. as per your unique business setting.

Company Shareholder Structure And Organizational Chart Graphics PDF
The slide carries a shareholder structure to represent the company ownerships. It shows division of company shares between companies which are company A, Company B, Company C, etc. Pitch your topic with ease and precision using this Company Shareholder Structure And Organizational Chart Graphics PDF. This layout presents information on Company Shareholder Structure, Organizational Chart. It is also available for immediate download and adjustment. So, changes can be made in the color, design, graphics or any other component to create a unique layout.

Sustainable Resource Recovery Blueprint Process Through Flow Chart Inspiration PDF
This template shows the flow chart of the recycling process. The includes the stages such as product evaluation, monitor, ecological assessment, etc. Pitch your topic with ease and precision using this Sustainable Resource Recovery Blueprint Process Through Flow Chart Inspiration PDF. This layout presents information on Procurement, Manufacturing, Suppliers. It is also available for immediate download and adjustment. So, changes can be made in the color, design, graphics or any other component to create a unique layout.
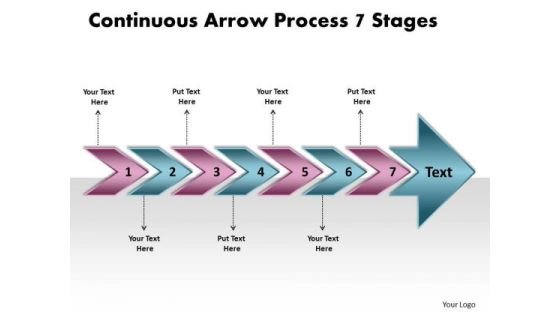
Continuous Arrow Process 7 Stages System Flow Charts PowerPoint Templates
We present our continuous arrow process 7 stages system flow charts PowerPoint templates.Use our Arrows PowerPoint Templates because, You can Show them how to churn out fresh ideas. Use our Shapes PowerPoint Templates because,You can Educate your listeners on the means to keep it ticking over. Use our Signs PowerPoint Templates because,you can Organize your thoughts and illuminate your ideas accordingly. Use our Business PowerPoint Templates because,Everybody knows The world over it is a priority for many. Along with it there are so many oppurtunities waiting to be utilised Use our Process and Flows PowerPoint Templates because, It shows them how to persistently hit bullseye.Use these PowerPoint slides for presentations relating to abstract, arrow, blank, business, chart, circular, circulation, concept, conceptual, continuous, design, diagram, executive, flow, icon, idea, illustration, management, model, numbers, organization, procedure, process, progression, resource, sequence, sequential, stages, steps, strategy. The prominent colors used in the PowerPoint template are Blue, Pink, Black. People tell us our continuous arrow process 7 stages system flow charts PowerPoint templates are Fun. The feedback we get is that our conceptual PowerPoint templates and PPT Slides are Glamorous. People tell us our continuous arrow process 7 stages system flow charts PowerPoint templates are Efficient. Presenters tell us our conceptual PowerPoint templates and PPT Slides are Cheerful. The feedback we get is that our continuous arrow process 7 stages system flow charts PowerPoint templates will get their audience's attention. Professionals tell us our chart PowerPoint templates and PPT Slides are Swanky.
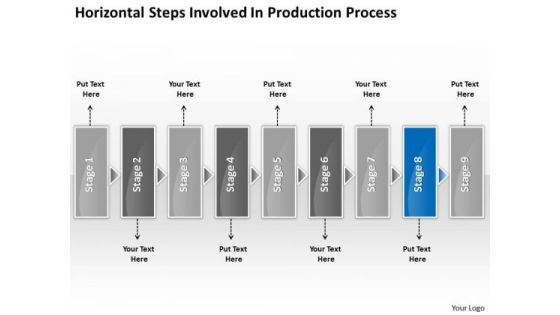
Horizontal Steps Involved Production Processs Business Fishbone Chart PowerPoint Templates
We present our horizontal steps involved production processs business fishbone chart PowerPoint templates.Download and present our Arrows PowerPoint Templates because this layout helps you to see satisfaction spread across the room as they unravel your gifted views. Use our Shapes PowerPoint Templates because you should take your team soaring to the pinnacle they crave. Present our Business PowerPoint Templates because this is the unerring accuracy in reaching the target. the effortless ability to launch into flight. Use our Boxes PowerPoint Templates because your listeners do not have to put on their thinking caps. Download our Communication PowerPoint Templates because you can gain the success to desired levels in one go.Use these PowerPoint slides for presentations relating to abstract, arrow, blank, business, chart, circular, circulation, concept, conceptual, design, diagram, executive, flow, horizontal, icon, idea, illustration, management, model, numbers, organization, process, progression, resource, sequence, stages, steps, strategy. The prominent colors used in the PowerPoint template are Blue, Gray, Black. The feedback we get is that our horizontal steps involved production processs business fishbone chart PowerPoint templates are Magnificent. PowerPoint presentation experts tell us our chart PowerPoint templates and PPT Slides are Elegant. People tell us our horizontal steps involved production processs business fishbone chart PowerPoint templates are Nice. Professionals tell us our circulation PowerPoint templates and PPT Slides are Colorful. You can be sure our horizontal steps involved production processs business fishbone chart PowerPoint templates are Fun. We assure you our concept PowerPoint templates and PPT Slides are designed by a team of presentation professionals.

5 Navigation Arrows Placed Sequentially Schematic Design PowerPoint Templates
We present our 5 navigation arrows placed sequentially schematic design PowerPoint templates.Use our Advertising PowerPoint Templates because, This slide depicts the occasion for gifting and giving. Use our Business PowerPoint Templates because,Like the famed William Tell, they put aside all emotions and concentrate on the target. Use our Shapes PowerPoint Templates because,It Shines the light on your thoughts and motivates your team to improve the quality of celebration for all around you. Use our Signs PowerPoint Templates because,Using our templates for your colleagues will impart knowledge tofeed. Use our Abstract PowerPoint Templates because, you can Ring them out loud with your brilliant ideas.Use these PowerPoint slides for presentations relating to arrow, background, badge, browse, business, button, card, collection, color, copy, dart, design, download, editable, element, golden, graphic, icon, illustration, isolated, item, label, menu, modern, navigation, object, on-line, original, paper, red, select, set, sign, site, sticker, sticky, style, symbol, tape, template, vector, web. The prominent colors used in the PowerPoint template are Blue, Blue navy, White. People tell us our 5 navigation arrows placed sequentially schematic design PowerPoint templates are Pleasant. The feedback we get is that our browse PowerPoint templates and PPT Slides are Fantastic. People tell us our 5 navigation arrows placed sequentially schematic design PowerPoint templates are Magnificent. Presenters tell us our color PowerPoint templates and PPT Slides will help you be quick off the draw. Just enter your specific text and see your points hit home. The feedback we get is that our 5 navigation arrows placed sequentially schematic design PowerPoint templates are Classic. Professionals tell us our collection PowerPoint templates and PPT Slides will save the presenter time.
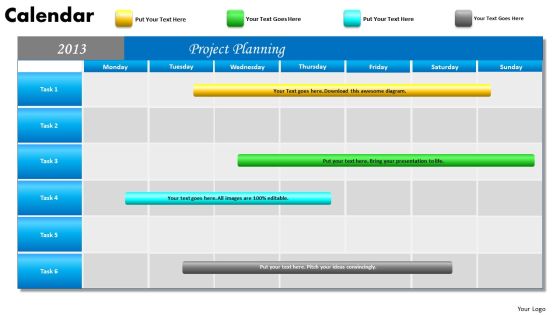
Project Planning Gantt Chart 2013 Calendar PowerPoint Slides Ppt Templates
We present our Project Planning Gantt Chart 2013 Calendar PowerPoint Slides PPT templates.Download and present our Calendars PowerPoint Templates because this slide depicts the occasion for gifting and giving. Present our New Year PowerPoint Templates because our templates emphasises your views. Use our Timelines PowerPoint Templates because this one depicts the popular chart. Use our Targets PowerPoint Templates because you can asked to strive to give true form to your great dream. Use our Time Planning PowerPoint Templates because you can Help your viewers automatically emphathise with your thoughts.Use these PowerPoint slides for presentations relating to 2013, Abstract, Agenda, Annual, April, Background, Book, Business, Calendar, Calendar, Content, Date, Day, Design, Desk, Diary, Document, Editable, Element, Eps10, Graphic, Green, Icon, Illustration, Layout, Monday, Month, Monthly, New, Note, Notepaper, Number, Old, Organizer, Paper, Plan, Planner. The prominent colors used in the PowerPoint template are Blue, Green, Yellow. PowerPoint presentation experts tell us our Project Planning Gantt Chart 2013 Calendar PowerPoint Slides PPT templates are Amazing. You can be sure our April PowerPoint templates and PPT Slides will make the presenter look like a pro even if they are not computer savvy. Presenters tell us our Project Planning Gantt Chart 2013 Calendar PowerPoint Slides PPT templates are Ritzy. We assure you our Calendar PowerPoint templates and PPT Slides are Tranquil. Professionals tell us our Project Planning Gantt Chart 2013 Calendar PowerPoint Slides PPT templates are Nice. The feedback we get is that our Business PowerPoint templates and PPT Slides are Tranquil.
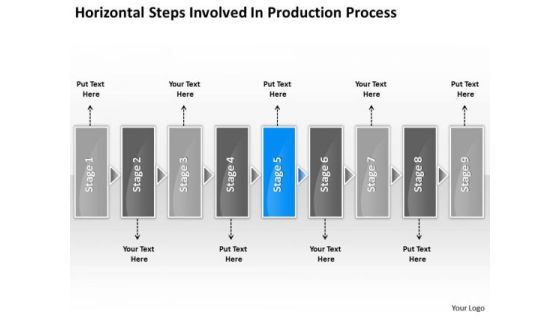
Horizontal Steps Involved Production Process Slides Flow Chart PowerPoint Templates
We present our horizontal steps involved production process Slides flow chart PowerPoint templates.Download our Arrows PowerPoint Templates because it gives a core idea about various enveloping layers. Download our Shapes PowerPoint Templates because you can Take your team along by explaining your plans. Use our Business PowerPoint Templates because maximising sales of your product is the intended destination. Use our Boxes PowerPoint Templates because our template will help pinpoint their viability. Use our Communication PowerPoint Templates because it can illustrate your chain of ideas focusing on that aspect or resource in order to enhance the quality of your product.Use these PowerPoint slides for presentations relating to abstract, arrow, blank, business, chart, circular, circulation, concept, conceptual, design, diagram, executive, flow, horizontal, icon, idea, illustration, management, model, numbers, organization, process, progression, resource, sequence, stages, steps, strategy. The prominent colors used in the PowerPoint template are Blue, Gray, Black. The feedback we get is that our horizontal steps involved production process Slides flow chart PowerPoint templates are Magnificent. PowerPoint presentation experts tell us our circulation PowerPoint templates and PPT Slides are Second to none. People tell us our horizontal steps involved production process Slides flow chart PowerPoint templates are Spiffy. Professionals tell us our concept PowerPoint templates and PPT Slides are Breathtaking. You can be sure our horizontal steps involved production process Slides flow chart PowerPoint templates are No-nonsense. We assure you our concept PowerPoint templates and PPT Slides are Radiant.

Horizontal Steps Involved Production Processs Fishbone Chart PowerPoint Templates
We present our horizontal steps involved production processs fishbone chart PowerPoint templates.Download and present our Arrows PowerPoint Templates because they are the stepping stones of our journey till date. Download our Shapes PowerPoint Templates because this business powerpoint template helps expound on the logic of your detailed thought process to take your company forward. Use our Business PowerPoint Templates because they highlight the depth of your thought process. Download our Boxes PowerPoint Templates because you can enlighten your skills with the help of our topical templates. Download and present our Communication PowerPoint Templates because the plans are in your head, stage by stage, year by year.Use these PowerPoint slides for presentations relating to abstract, arrow, blank, business, chart, circular, circulation, concept, conceptual, design, diagram, executive, flow, horizontal, icon, idea, illustration, management, model, numbers, organization, process, progression, resource, sequence, stages, steps, strategy. The prominent colors used in the PowerPoint template are Blue, Gray, Black. The feedback we get is that our horizontal steps involved production processs fishbone chart PowerPoint templates are Wonderful. PowerPoint presentation experts tell us our conceptual PowerPoint templates and PPT Slides are Fabulous. People tell us our horizontal steps involved production processs fishbone chart PowerPoint templates are visually appealing. Professionals tell us our concept PowerPoint templates and PPT Slides are Exuberant. You can be sure our horizontal steps involved production processs fishbone chart PowerPoint templates are Wonderful. We assure you our business PowerPoint templates and PPT Slides are Beautiful.

7 Arrows Diverging Representing Process Model Circular Chart PowerPoint Templates
We present our 7 arrows diverging representing process model Circular Chart PowerPoint templates.Use our Sale PowerPoint Templates because you can Highlight the key components of your entire manufacturing/ business process. Download our Arrows PowerPoint Templates because this template with an image of helps you chart the course of your presentation. Present our Process and Flows PowerPoint Templates because our creative template will lay down your views. Present our Business PowerPoint Templates because you too have got the framework of your companys growth in place. Download and present our Shapes PowerPoint Templates because your listeners do not have to put on their thinking caps.Use these PowerPoint slides for presentations relating to Abstract, Arrow, Art, Artistic, Background, Banner, Boost, Box, Business, Clip Art, Color, Colorful, Concept, Cover, Creative, Decide, Decision, Design, Direction, Finance, Futuristic, Graphic, Icon, Idea, Illustration, Increase, Info, Information, Journey, Label, Modern, Path, Pattern, Pop, Print, Process, Sale, Solution, Statistic, Sticker, Stylish, Template. The prominent colors used in the PowerPoint template are Blue, Gray, Black. PowerPoint presentation experts tell us our 7 arrows diverging representing process model Circular Chart PowerPoint templates are Radiant. People tell us our Background PowerPoint templates and PPT Slides are Upbeat. People tell us our 7 arrows diverging representing process model Circular Chart PowerPoint templates are Sparkling. Presenters tell us our Background PowerPoint templates and PPT Slides are Functional. Customers tell us our 7 arrows diverging representing process model Circular Chart PowerPoint templates are Delightful. The feedback we get is that our Boost PowerPoint templates and PPT Slides are Festive.

Arrows Pointing Different Directions Circular Flow Process Chart PowerPoint Slide
We present our arrows pointing different directions Circular Flow Process Chart PowerPoint Slide.Present our Arrows PowerPoint Templates because your team and you always raise a toast. Use our Process and Flows PowerPoint Templates because this template with an image of helps you chart the course of your presentation. Download and present our Business PowerPoint Templates because the fruits of your labour are beginning to show.Enlighten them on the great plans you have for their enjoyment. Present our Marketing PowerPoint Templates because this emphasises on the relevance and importance of all milestones along the way. Download our Shapes PowerPoint Templates because you can Determine your targets and sequence them as per your priorities.Use these PowerPoint slides for presentations relating to Process,arrow, background, banner,blue, , choice, concept,creative, design, direction, flow, four,illustration, infographic, instruction, label,layout, manual, marketing, modern, next,number, offer, one, options, order, pointer, process, product,promotion, sequence, simple, special,step, symbol, business. The prominent colors used in the PowerPoint template are Green lime, White, Black. You can be sure our arrows pointing different directions Circular Flow Process Chart PowerPoint Slide are Reminiscent. PowerPoint presentation experts tell us our choice PowerPoint templates and PPT Slides are Colorful. Professionals tell us our arrows pointing different directions Circular Flow Process Chart PowerPoint Slide are Nostalgic. Presenters tell us our creative PowerPoint templates and PPT Slides are Romantic. Professionals tell us our arrows pointing different directions Circular Flow Process Chart PowerPoint Slide are Delightful. Customers tell us our choice PowerPoint templates and PPT Slides are Delightful.

Two Layered Venn Diagram Cycle Chart PowerPoint Slides
We present our two layered venn diagram Cycle Chart PowerPoint Slides.Use our Marketing PowerPoint Templates because Our PowerPoint Templates and Slides will let you Clearly mark the path for others to follow. Present our Business PowerPoint Templates because maximising sales of your product is the intended destination. Use our Shapes PowerPoint Templates because you know what it takes to keep it fit and healthy. Use our Finance PowerPoint Templates because you envisage some areas of difficulty in the near future. The overall financial situation could be a source of worry. Download our Symbol PowerPoint Templates because this helps you to put all your brilliant views to your audience.Use these PowerPoint slides for presentations relating to Background, Black, Blue, Business, Chart, Circle, Diagram, Drop, Financial, Green, Icon, Isolated, Overlapping, Process, Red, Round, Shadow, Shape, Three, Transparency, Vector, Venn, White. The prominent colors used in the PowerPoint template are Blue, Green, Black. We assure you our two layered venn diagram Cycle Chart PowerPoint Slides are Awesome. Customers tell us our Diagram PowerPoint templates and PPT Slides are Attractive. The feedback we get is that our two layered venn diagram Cycle Chart PowerPoint Slides are Luxuriant. We assure you our Business PowerPoint templates and PPT Slides are Amazing. People tell us our two layered venn diagram Cycle Chart PowerPoint Slides are Excellent. We assure you our Blue PowerPoint templates and PPT Slides are Tasteful.
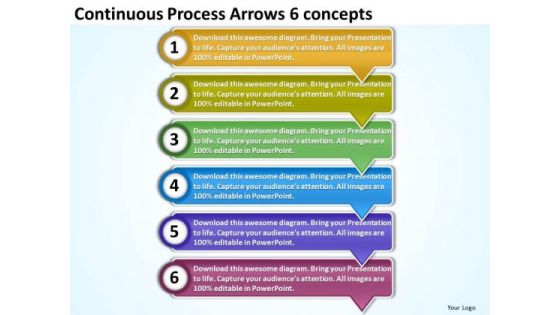
Continuous Process Arrows 6 Concepts Oil Flow Chart PowerPoint Slides
We present our continuous process arrows 6 concepts oil flow chart PowerPoint Slides. Use our Arrows PowerPoint Templates because, have always been a source of inspiration for us all. Use our Symbol PowerPoint Templates because, this template with an image of helps you chart the course of your presentation. Use our Business PowerPoint Templates because, Our Template designs are State of the Art. Use our Metaphor PowerPoint Templates because, Inspired by the indelible Olympic logo this graphic exemplifies the benefits of teamwork. Use our Process and Flows PowerPoint Templates because, you have the basic goal in mind. Use these PowerPoint slides for presentations relating to Arrow, Background, Business, Chart, Diagram, Financial, Graphic, Gray, Icon, Illustration, Management, Orange, Perspective, Planning, Process, Stages, Steps, Text. The prominent colors used in the PowerPoint template are Yellow, Green, and Purple

Leaning Circle Arrow Process 2 Flow Chart Slides PowerPoint
We present our leaning circle arrow process 2 flow chart Slides PowerPoint. Use our Arrows PowerPoint Templates because; amplify your views, ideas and thoughts from very basic aspects to the highly technical and complicated issues using this template as a tool. Use our Spheres PowerPoint Templates because, Goal Pie Chart Template: - You have a clear vision of the cake you want. Use our Symbol PowerPoint Templates because; heighten the anticipation of your audience with this slide listing. Use our Marketing PowerPoint Templates because, this one depicts the popular chart. Use our Process and Flows PowerPoint Templates because; educate your listeners on the means to keep it ticking over. Use these PowerPoint slides for presentations relating to Arrow, Business, Circle, Circular, Collection, Connection, Cursor, Decoration, Design, Dimensional, Direction, Element, Icon, Illustration, Information, Modern, Motion, Paper, Perspective, Plastic, Pointer, Pointing, Process, Recycle, Recycling, Reflective, Set, Shape, Shiny, Sign, Symbol, Technology. The prominent colors used in the PowerPoint template are Yellow, Orange, and Gray
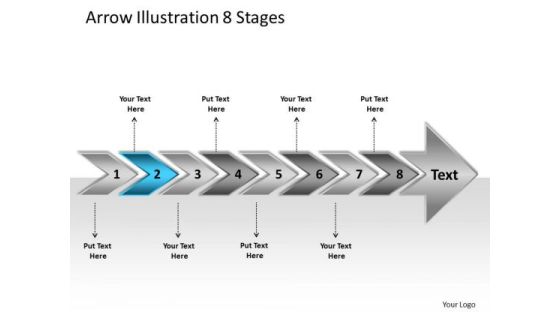
Arrow Illustration 8 Stages Business Flow Chart Slides PowerPoint
We present our arrow illustration 8 stages business flow chart Slides PowerPoint. Use our Arrows PowerPoint Templates because, the color coding of our templates are specifically designed to highlight you points. Use our Business PowerPoint Templates because, Now use this slide to bullet point your views. Use our Shapes PowerPoint Templates because; unravel the desired and essential elements of your overall strategy. Use our Finance PowerPoint Templates because, Goal Pie Chart Template: - You have a clear vision of the cake you want. Use our Process and Flows PowerPoint Templates because, you have the entire picture in mind. Use these PowerPoint slides for presentations relating to 3d arrow background bullet business chart checkmark chevron diagram drop eps10 financial five glass graphic gray icon illustration management point process project reflection set shadow stage text transparency vector white. The prominent colors used in the PowerPoint template are Blue, Gray, and Black

Hand Illustration 2 Stages Flow Charting PowerPoint Slides
We present our hand illustration 2 stages flow charting PowerPoint Slides. Use our Advertising PowerPoint Templates because, this template with an image of helps you chart the course of your presentation. Use our Shapes PowerPoint Templates because, this template with an image of helps you chart the course of your presentation. Use our Targets PowerPoint Templates because; Blaze a brilliant trail from point to point. Use our Process and Flows PowerPoint Templates because, you know what it takes to keep it fit and healthy. Use our Signs PowerPoint Templates because, which of late have been proving to be a hassle. Use these PowerPoint slides for presentations relating to Adult, alone, arranging, background, child, dirty, empty, family, handprint, hands, human, identity, illustration, isolated, love, messy, naked, objects, paint, painting, palm, set, shape, simple, stage, stained, stamp, toe, togetherness. The prominent colors used in the PowerPoint template are Blue, Black, and Gray
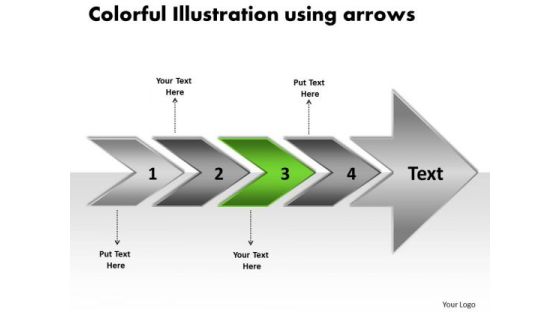
Colorful Illustration Using Arrows Sample Flow Charts PowerPoint Slides
We present our colorful illustration using arrows sample flow charts PowerPoint Slides.Use our Marketing PowerPoint Templates because,You can Explain the contribution of each of the elements and how they provide impetus to the next phase. Use our Arrows PowerPoint Templates because,This one depicts the popular chart. Use our Shapes PowerPoint Templates because,The colour coding of our templates are specifically designed to highlight you points. Use our Business PowerPoint Templates because,You are ready to flap your wings and launch off. All poised are you to touch the sky with glory Use our Targets PowerPoint Templates because,You know the path so show the way.Use these PowerPoint slides for presentations relating to Arrow, background, banner, business, chart, colorful, diagram, advertising, direction, element, financial, flow, gradient, illustration, isolated, marketing mirrored, placeholderm, presentation, process, success, steps. The prominent colors used in the PowerPoint template are Green, Gray, White
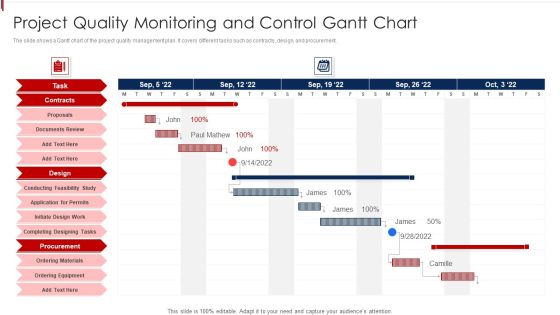
Project Quality Monitoring And Control Gantt Chart Clipart PDF
The slide shows a Gantt chart of the project quality management plan. It covers different tasks such as contracts, design, and procurement. Introducing our Project Quality Monitoring And Control Gantt Chart Clipart PDF that is designed to showcase some of the vital components that will help you create timelines, roadmaps, and project plans. In addition, also communicate your project durations, milestones, tasks, subtasks, dependencies, and other attributes using this well structured Project Quality Monitoring And Control Gantt Chart Clipart PDF template. You can also exhibit preeminence against time by deploying this easily adaptable slide to your business presentation. Our experts have designed this template in such a way that it is sure to impress your audience. Thus, download it and steer your project meetings, meetups, and conferences.

Monthly Content Calendar Roadmap With Gantt Chart Professional PDF
This slide covers a content calendar roadmap illustrating upcoming campaigns content. It also includes the progress chart to determine the current completion status of each enlisted activity. Introducing our Monthly Content Calendar Roadmap With Gantt Chart Professional PDF that is designed to showcase some of the vital components that will help you create timelines, roadmaps, and project plans. In addition, also communicate your project durations, milestones, tasks, subtasks, dependencies, and other attributes using this well structured Monthly Content Calendar Roadmap With Gantt Chart Professional PDF template. You can also exhibit preeminence against time by deploying this easily adaptable slide to your business presentation. Our experts have designed this template in such a way that it is sure to impress your audience. Thus, download it and steer your project meetings, meetups, and conferences.
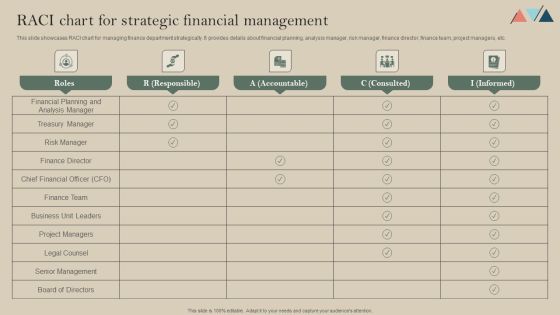
RACI Chart For Strategic Financial Management Diagrams PDF
This slide showcases RACI chart for managing finance department strategically. It provides details about financial planning, analysis manager, risk manager, finance director, finance team, project managers, etc. Here you can discover an assortment of the finest PowerPoint and Google Slides templates. With these templates, you can create presentations for a variety of purposes while simultaneously providing your audience with an eye-catching visual experience. Download RACI Chart For Strategic Financial Management Diagrams PDF to deliver an impeccable presentation. These templates will make your job of preparing presentations much quicker, yet still, maintain a high level of quality. Slidegeeks has experienced researchers who prepare these templates and write high-quality content for you. Later on, you can personalize the content by editing the RACI Chart For Strategic Financial Management Diagrams PDF.

Horizontal Steps Involved Production Processs Flowchart Fishbone Chart PowerPoint Templates
We present our horizontal steps involved production processs flowchart fishbone chart PowerPoint templates.Download our Arrows PowerPoint Templates because the gears of youthful minds are useful, therefore set them in motion. Download and present our Shapes PowerPoint Templates because this is Aesthetically designed to make a great first impression this template highlights . Download our Business PowerPoint Templates because you can Flutter your wings and enchant the world. Impress them with the innate attractiveness of your thoughts and words. Download and present our Boxes PowerPoint Templates because you will be able to Highlight the various ways in which we can maintain its efficiency. Present our Communication PowerPoint Templates because if making a mark is your obsession, then let others get Obsessed with you.Use these PowerPoint slides for presentations relating to abstract, arrow, blank, business, chart, circular, circulation, concept, conceptual, design, diagram, executive, flow, horizontal, icon, idea, illustration, management, model, numbers, organization, process, progression, resource, sequence, stages, steps, strategy. The prominent colors used in the PowerPoint template are Blue, Gray, Black. The feedback we get is that our horizontal steps involved production processs flowchart fishbone chart PowerPoint templates are Tasteful. PowerPoint presentation experts tell us our business PowerPoint templates and PPT Slides are Second to none. People tell us our horizontal steps involved production processs flowchart fishbone chart PowerPoint templates are Fun. Professionals tell us our blank PowerPoint templates and PPT Slides are Tasteful. You can be sure our horizontal steps involved production processs flowchart fishbone chart PowerPoint templates are specially created by a professional team with vast experience. They diligently strive to come up with the right vehicle for your brilliant Ideas. We assure you our chart PowerPoint templates and PPT Slides are Reminiscent.

Diagrams Certificate Templates PowerPoint Circular Flow Layout Chart
We present our diagrams certificate templates powerpoint Circular Flow Layout Chart.Use our Business PowerPoint Templates because you can Lead your flock steadily to greater heights. Look around at the vast potential of achievement around you. Use our Arrows PowerPoint Templates because you can Help your viewers automatically emphathise with your thoughts. Present our Spheres PowerPoint Templates because it outlines the process with this innovative graphic to authenticate your plan of achieving the goal of added value/profit. Use our Process and Flows PowerPoint Templates because it Shines the light on your thoughts and motivates your team to improve the quality of celebration for all around you. Download and present our Shapes PowerPoint Templates because they are Designed to attract the attention of your audience.Use these PowerPoint slides for presentations relating to 3d, Abstract, Arrow, Ball, Business, Button, Chart, Choice, Circle, Circular, Color, Colorful, Communication, Connection, Cycle, Design, Diagram, Direction, Eight, Element, Five, Four, Global, Globe, Graphic, Group, Icon, Illustration, Internet, Isolated, Media, Menu, Motion, Network, Numbers, Paint, Printer, Printing, Recycling, Round, Sign, Sphere, Symbol. The prominent colors used in the PowerPoint template are Blue, Orange, Green. We assure you our diagrams certificate templates powerpoint Circular Flow Layout Chart are Second to none. Customers tell us our Chart PowerPoint templates and PPT Slides help you meet deadlines which are an element of today's workplace. Just browse and pick the slides that appeal to your intuitive senses. The feedback we get is that our diagrams certificate templates powerpoint Circular Flow Layout Chart are Gorgeous. We assure you our Business PowerPoint templates and PPT Slides are Stylish. People tell us our diagrams certificate templates powerpoint Circular Flow Layout Chart are Bright. We assure you our Arrow PowerPoint templates and PPT Slides are Striking.
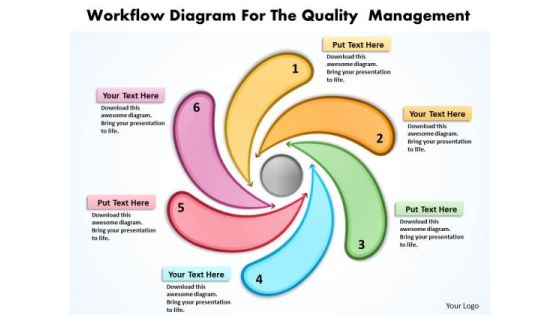
Workflow Diagram For The Quality Management Radial Chart PowerPoint Templates
We present our workflow diagram for the quality management Radial Chart PowerPoint templates.Present our Marketing PowerPoint Templates because Our PowerPoint Templates and Slides will let Your superior ideas hit the target always and everytime. Download and present our Business PowerPoint Templates because infrastructure growth is an obvious requirement of today.inform your group on how exactly this potential is tailor made for you. Download our Shapes PowerPoint Templates because you should Demonstrate how you think out of the box. Use our Finance PowerPoint Templates because you can see clearly through to the bigger bowl ahead. Time your jump to perfection and hit the nail on the head. Use our Symbol PowerPoint Templates because you can see In any endeavour people matter most.Use these PowerPoint slides for presentations relating to Arrow, Art, Business, Chart, Design, Development, Diagram, Flow, Flowchart, Graphic, Gray, Idea, Info, Management, Method, Model, Process, Quality, Rainbow, Research, Sign, Software, Strategy, Success, System, Template, Text, Vector, Work. The prominent colors used in the PowerPoint template are Red, Blue, Yellow. We assure you our workflow diagram for the quality management Radial Chart PowerPoint templates are incredible easy to use. Customers tell us our Flow PowerPoint templates and PPT Slides will make the presenter successul in his career/life. The feedback we get is that our workflow diagram for the quality management Radial Chart PowerPoint templates effectively help you save your valuable time. We assure you our Chart PowerPoint templates and PPT Slides are Splendid. People tell us our workflow diagram for the quality management Radial Chart PowerPoint templates are Classic. We assure you our Diagram PowerPoint templates and PPT Slides are Fabulous.

Business Circle Charts PowerPoint Templates Finance Comb Process Ppt Slides
Business Circle Charts PowerPoint Templates Finance Comb Process PPT Slides-There are certain key areas on which the internal value networks concentrate. Use this Finance Comb Process Design to explain these prime activities and other associations and methods that cross over the internal boundaries. -Business Circle Charts PowerPoint Templates Finance Comb Process PPT Slides-This template can be used for presentations relating to Abstract, Backdrop, Background, Biology, Cell, Chemistry, Computer, Connections, Construction, Design, Digital, Futuristic, Geometric, Graphic, Grid, Hexagon, Holes, Honeycomb, Illustration, Mesh, Modern, Network, Organization, Pattern, Rows, Science, Shape, Structure
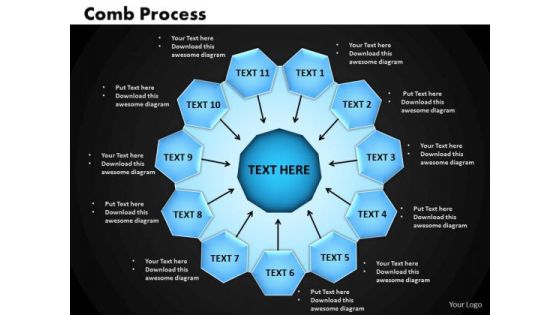
Business Circle Charts PowerPoint Templates Success Comb Process Ppt Slides
Business Circle Charts PowerPoint Templates Success Comb Process PPT Slides-Use this graphics to organize major factors like business methods, relevant inputs, business association and networking, quality services that will ascertain the height of achievement and can lead to success-Business Circle Charts PowerPoint Templates Success Comb Process PPT Slides-This template can be used for presentations relating to Abstract, Backdrop, Background, Biology, Cell, Chemistry, Computer, Connections, Construction, Design, Digital, Futuristic, Geometric, Graphic, Grid, Hexagon, Holes, Honeycomb, Illustration, Mesh, Modern, Network, Organization, Pattern, Rows, Science, Shape, Structure
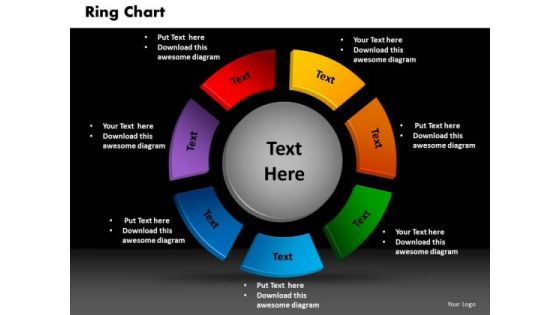
Business Cycle Process PowerPoint Templates Business Ring Chart Ppt Slides
Business Cycle Process PowerPoint Templates Business Ring Chart PPT Slides-This graphic exemplifies the benefits of teamwork. Different people with differing ideas and priorities perform together to score. Hence this diagram has the unique ability to drive home your ideas and show how they mesh to guarantee success-Business Cycle Process PowerPoint Templates Business Ring Chart PPT Slides-This template can be used for presentations relating to 3d, Abstract, Advertising, Art, Branding, Business, Circles, Clipart, Company, Corporate, Design, Dimensional, Drawings, Element, Entwined, Graphics, Icon, Illustrations, Images, Internet, Marketing, Online, Pictures, Professional, Ready, Rings, Site, Team, Teamwork
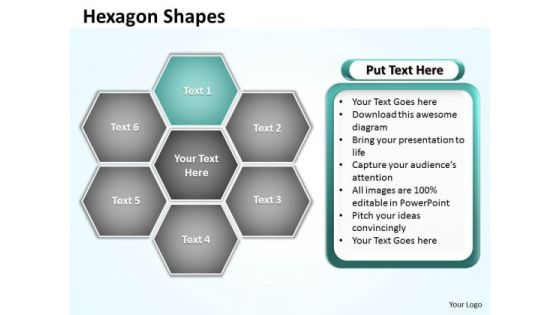
Ppt Hexagon Angles Chart Editable PowerPoint Templates 2010 Business
PPT hexagon angles chart editable powerpoint templates 2010 Business-Use this diagram as a method of graphically representing the flow of data as an information processing system. Use this PPT to represent data that is easy to comprehend and analyze. This PowerPoint diagram can be used in strategy, consulting and marketing presentations. You can apply other 3D Styles and shapes to the slide to enhance your presentations.-PPT hexagon angles chart editable powerpoint templates 2010 Business-Abstract, Background, Design, Digital, Elements, Graphic, Grey, Hexagon, Illustration, Light, Modern, Perspective, Triangles, Shapes, Shiny, Style, Technology, Template, Vector, Vertical, Virtual, Wallpaper, Web
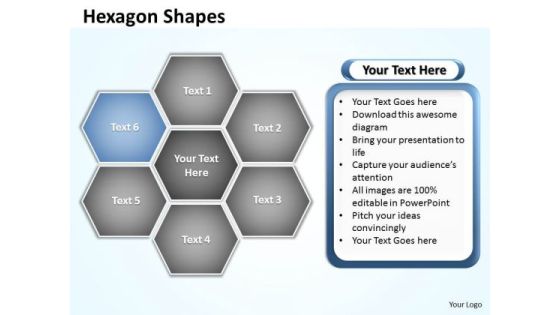
Ppt Hexagon Shapes Chart Editable PowerPoint Templates 2003 Business
PPT hexagon shapes chart editable powerpoint templates 2003 Business-Using this Business PowerPoint Diagram you can explain the relevance of the different layers and stages in getting down to your core competence, ability and desired result. There is a bucketful of brilliant ideas swirling around within your group. Hence this diagram has the unique ability to drive home your ideas and show how they mesh to guarantee success.-PPT hexagon shapes chart editable powerpoint templates 2003 Business-Abstract, Background, Design, Digital, Elements, Graphic, Grey, Hexagon, Illustration, Light, Modern, Perspective, Triangles, Shapes, Shiny, Style, Technology, Template, Vector, Vertical, Virtual, Wallpaper, Web

Company Product Sales Forecast Chart Ppt Inspiration Templates PDF
This slide shows the Product sales forecast table with Product names along with price per unit and total units sold for the current as well as the projected period till the year 2023. Deliver and pitch your topic in the best possible manner with this company product sales forecast chart ppt inspiration templates pdf. Use them to share invaluable insights on company product sales forecast chart and impress your audience. This template can be altered and modified as per your expectations. So, grab it now.

Agile Kanban Methodology Chart With Stories Professional PDF
This slide explains Kanban Methodology through a chart that shows User Story Details, Tasks to be done, Tasks in progress Product Development, Software Quality Check, Testing to be done Automation Processes, Cycle Time Analysis and the activities that are ready to be deployedz Deliver and pitch your topic in the best possible manner with this agile kanban methodology chart with stories professional pdf. Use them to share invaluable insights on product development, automation processes, task cycle time and impress your audience. This template can be altered and modified as per your expectations. So, grab it now.

Project Gantt Chart For Online Promotion Activities Graphics PDF
Introducing our project gantt chart for online promotion activities graphics pdf that is designed to showcase some of the vital components that will help you create timelines, roadmaps, and project plans. In addition, also communicate your project durations, milestones, tasks, subtasks, dependencies, and other attributes using this well structured project gantt chart for online promotion activities graphics pdf template. You can also exhibit preeminence against time by deploying this easily adaptable slide to your business presentation. Our experts have designed this template in such a way that it is sure to impress your audience. Thus, download it and steer your project meetings, meetups, and conferences.

Official Team Collaboration Plan Organizational Chart Implementation Timeline Information PDF
Mentioned slide shares a four day step by step timeline for creating and implementing organization hierarchy chart in company as a part of organizational team building program. This is a official team collaboration plan organizational chart implementation timeline information pdf template with various stages. Focus and dispense information on four stages using this creative set, that comes with editable features. It contains large content boxes to add your information on topics like implement and evaluate, design transformation. You can also showcase facts, figures, and other relevant content using this PPT layout. Grab it now.
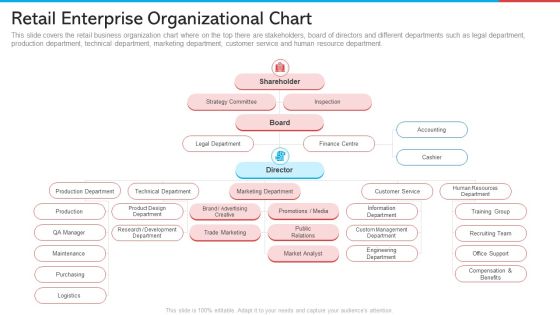
Retail Enterprise Organizational Chart Retail Marketing Demonstration PDF
This slide covers the retail business organization chart where on the top there are stakeholders, board of directors and different departments such as legal department, production department, technical department, marketing department, customer service and human resource department. Deliver an awe inspiring pitch with this creative retail enterprise organizational chart retail marketing demonstration pdf bundle. Topics like marketing department, trade marketing, development, strategy committee, accounting can be discussed with this completely editable template. It is available for immediate download depending on the needs and requirements of the user.

Project Timeline Gantt Chart For Weekly Themes PDF
Introducing our project timeline gantt chart for weekly themes pdf that is designed to showcase some of the vital components that will help you create timelines, roadmaps, and project plans. In addition, also communicate your project durations, milestones, tasks, subtasks, dependencies, and other attributes using this well structured project timeline gantt chart for weekly themes pdf template. You can also exhibit preeminence against time by deploying this easily adaptable slide to your business presentation. Our experts have designed this template in such a way that it is sure to impress your audience. Thus, download it and steer your project meetings, meetups, and conferences.
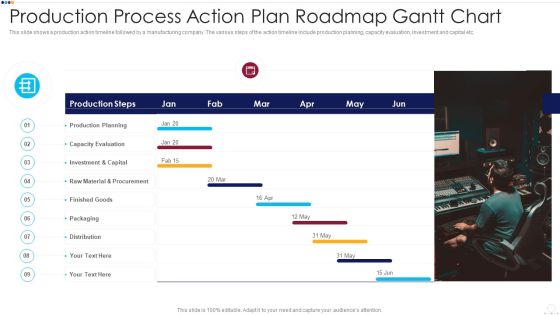
Production Process Action Plan Roadmap Gantt Chart Professional PDF
This slide shows a production action timeline followed by a manufacturing company. The various steps of the action timeline include production planning, capacity evaluation, investment and capital etc. Presenting production process action plan roadmap gantt chart professional pdf to provide visual cues and insights. Share and navigate important information on nine stages that need your due attention. This template can be used to pitch topics like production process action plan roadmap gantt chart. In addtion, this PPT design contains high resolution images, graphics, etc, that are easily editable and available for immediate download.

Project Budget Planning Audit Flow Chart Mockup PDF
This slide covers flow chart which will be helpful for doing regular financial audits. It includes a process steps such as project creation, assign task, conduct meeting and monitoring project status. Persuade your audience using this project budget planning audit flow chart mockup pdf. This PPT design covers one stages, thus making it a great tool to use. It also caters to a variety of topics including project, monitor project status, data warehouse, sign off process, assign task. Download this PPT design now to present a convincing pitch that not only emphasizes the topic but also showcases your presentation skills.

Cross Departmental Technology Skill Gaps Analysis Chart Introduction PDF
This slide covers the gaps in desired and actual skills scorecard of team members in various departments. It includes technical problem solving ability, updating to new innovation, required certification, meeting deadlines, etc. Pitch your topic with ease and precision using this cross departmental technology skill gaps analysis chart introduction pdf. This layout presents information on cross departmental technology skill gaps analysis chart. It is also available for immediate download and adjustment. So, changes can be made in the color, design, graphics or any other component to create a unique layout.
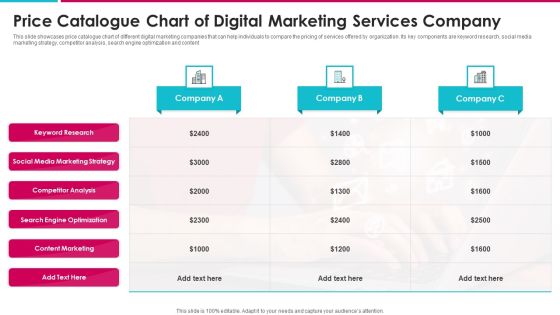
Price Catalogue Chart Of Digital Marketing Services Company Rules PDF
This slide showcases price catalogue chart of different digital marketing companies that can help individuals to compare the pricing of services offered by organization. Its key components are keyword research, social media marketing strategy, competitor analysis, search engine optimization and content Pitch your topic with ease and precision using this price catalogue chart of digital marketing services company rules pdf. This layout presents information on keyword research, social media marketing strategy, competitor analysis, search engine optimization, content marketing. It is also available for immediate download and adjustment. So, changes can be made in the color, design, graphics or any other component to create a unique layout.
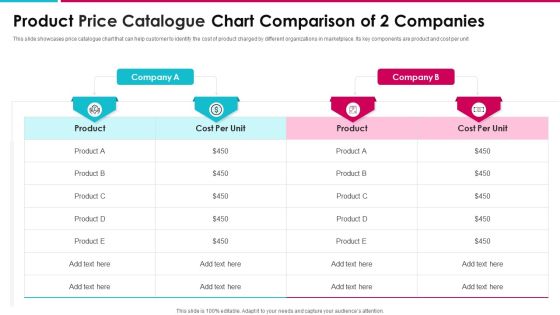
Product Price Catalogue Chart Comparison Of 2 Companies Elements PDF
This slide showcases price catalogue chart that can help customer to identify the cost of product charged by different organizations in marketplace. Its key components are product and cost per unit Showcasing this set of slides titled product price catalogue chart comparison of 2 companies elements pdf. The topics addressed in these templates are product, cost per unit, company. All the content presented in this PPT design is completely editable. Download it and make adjustments in color, background, font etc. as per your unique business setting.
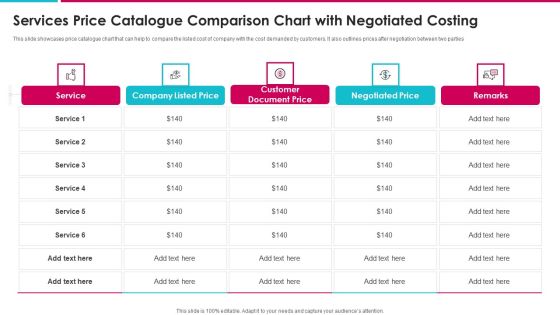
Services Price Catalogue Comparison Chart With Negotiated Costing Topics PDF
This slide showcases price catalogue chart that can help to compare the listed cost of company with the cost demanded by customers. It also outlines prices after negotiation between two parties Pitch your topic with ease and precision using this services price catalogue comparison chart with negotiated costing topics pdf. This layout presents information on service, company listed price, customer document price, negotiated price. It is also available for immediate download and adjustment. So, changes can be made in the color, design, graphics or any other component to create a unique layout.

Sales Techniques Playbook Different Products Price Comparison Chart Demonstration PDF
This slide provides information regarding product price comparison chart that captures information about price per unit, change over list price, reason for proposed price, volumes sold, forecasted growth. This is a sales techniques playbook different products price comparison chart demonstration pdf template with various stages. Focus and dispense information on two stages using this creative set, that comes with editable features. It contains large content boxes to add your information on topics like product, consumer, price, growth. You can also showcase facts, figures, and other relevant content using this PPT layout. Grab it now.

Project Time Scheduling Chart With Task Details Pictures PDF
This slide delineates project time management chart with task details that businesses can use during their routine projects . It also contains information about analysis, design, development and testing which can assist project managers in effective time management. Showcasing this set of slides titled project time scheduling chart with task details pictures pdf. The topics addressed in these templates are design, analysis, development. All the content presented in this PPT design is completely editable. Download it and make adjustments in color, background, font etc. as per your unique business setting.

Sales Techniques Playbook Different Products Price Comparison Chart Graphics PDF
This slide provides information regarding product price comparison chart that captures information about price per unit, change over list price, reason for proposed price, volumes sold, forecasted growth. This is a sales techniques playbook different products price comparison chart graphics pdf template with various stages. Focus and dispense information on one stage using this creative set, that comes with editable features. It contains large content boxes to add your information on topics like ensuring effective communication among sales management team You can also showcase facts, figures, and other relevant content using this PPT layout. Grab it now.
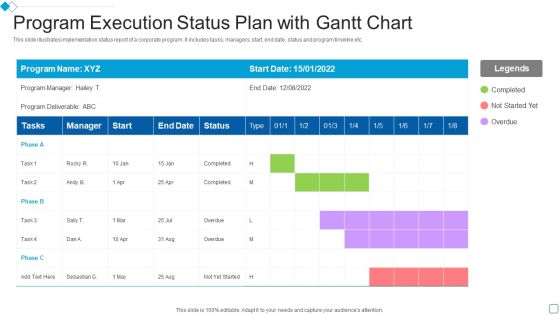
Program Execution Status Plan With Gantt Chart Designs PDF
Introducing our Program Execution Status Plan With Gantt Chart Designs PDF that is designed to showcase some of the vital components that will help you create timelines, roadmaps, and project plans. In addition, also communicate your project durations, milestones, tasks, subtasks, dependencies, and other attributes using this well structured Program Execution Status Plan With Gantt Chart Designs PDF template. You can also exhibit preeminence against time by deploying this easily adaptable slide to your business presentation. Our experts have designed this template in such a way that it is sure to impress your audience. Thus, download it and steer your project meetings, meetups, and conferences
New Service Introduction Gantt Chart With Milestones Icons PDF
This slide showcases gantt. chart that can help organization to keep track of each milestone of service launch process. Its key elements are positioning statement, go to market strategy, shareholder communication and launch day campaign. Pitch your topic with ease and precision using this New Service Introduction Gantt Chart With Milestones Icons PDF. This layout presents information on Milestones, Assign Roles For Launch, Conduct Satisfaction Survey. It is also available for immediate download and adjustment. So, changes can be made in the color, design, graphics or any other component to create a unique layout.
Stakeholder Gathering And Communication Planning Chart Icons PDF
This slide illustrates engagement schedule of companys stakeholders. It includes stakeholder name, type of engagement required, responsible manager, frequency and channel.Persuade your audience using this Stakeholder Gathering And Communication Planning Chart Icons PDF This PPT design covers five stages, thus making it a great tool to use. It also caters to a variety of topics including Stakeholder Gathering And Communication Planning Chart Download this PPT design now to present a convincing pitch that not only emphasizes the topic but also showcases your presentation skills.

Gantt Chart For Change Management Communication Plan Designs PDF
This slide showcases Gantt chart that can help organization to decide the delivery channels and set the timeline of change management communication plan to key stakeholders. It showcases progress for a period of 3 weeks Pitch your topic with ease and precision using this Gantt Chart For Change Management Communication Plan Designs PDF This layout presents information on Decide Delivery, Communicating, Medium Of Communication It is also available for immediate download and adjustment. So, changes can be made in the color, design, graphics or any other component to create a unique layout.

Insurance Services Firm Profile Organisation Chart Diagrams PDF
The slide depicts the company hierarchical chart to define the various management positions in organization. It depicts chief executive officer, chief financial officer, executive vice president, sales and marketing director, legal advisor, actuary and IT consultant. It also shows board of directors, risk management committee and office of compliance. Deliver an awe inspiring pitch with this creative Insurance Services Firm Profile Organisation Chart Diagrams PDF bundle. Topics like Executive Of Directors, Chief Executive Officer, Board Of Directors can be discussed with this completely editable template. It is available for immediate download depending on the needs and requirements of the user.
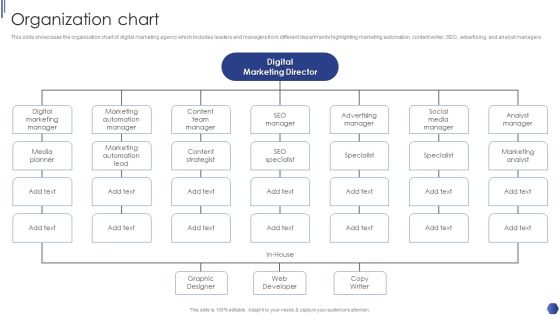
Digital Marketing Agency Business Profile Organization Chart Elements PDF
This slide showcases the organization chart of digital marketing agency which includes leaders and managers from different departments highlighting marketing automation, content writer, SEO, advertising, and analyst managers. Deliver and pitch your topic in the best possible manner with this Digital Marketing Agency Business Profile Organization Chart Elements PDF. Use them to share invaluable insights on Content Team Manager, Marketing Automation Manager, Digital Marketing Manager and impress your audience. This template can be altered and modified as per your expectations. So, grab it now.

Gantt Chart For Application Data Migration Project Elements PDF
This slide showcases gantt. chart that can help organization to keep track of key milestones of application migration project and ensure efficient implementation of whole process. Its key components are starts date, end date and duration in days. Pitch your topic with ease and precision using this Gantt Chart For Application Data Migration Project Elements PDF. This layout presents information on Data Migration Requirements, Application Dependencies, Application Installation. It is also available for immediate download and adjustment. So, changes can be made in the color, design, graphics or any other component to create a unique layout.

Sales Incentive Compensation Programs Plan Chart Template PDF
This slide represents sales incentive compensation policy plan chart illustrating on target earning, mix pay, base salary, annual target incentive etc. for employees of the organization. Pitch your topic with ease and precision using this Sales Incentive Compensation Programs Plan Chart Template PDF. This layout presents information on Sale Commission Cap, Performance Time Frame, Annual Target Incentive. It is also available for immediate download and adjustment. So, changes can be made in the color, design, graphics or any other component to create a unique layout.

Functional Chart Of Cyber Security Team Diagrams PDF
The purpose of this slide is to provide glimpse of cyber security team in the form of org chart. The key stakeholders mentioned in the slide are chief information security officer CISO, cyber risk committee, cyber security director, cyber risk manager, security operations manager etc.Deliver an awe inspiring pitch with this creative Functional Chart Of Cyber Security Team Diagrams PDF bundle. Topics like Access Monitoring, Security Architect, Security Information can be discussed with this completely editable template. It is available for immediate download depending on the needs and requirements of the user.

Gantt Chart Presenting Waterfall Project Management In Healthcare Pictures PDF
This slide shows the Gantt chart that is presenting waterfall project management in healthcare which covers name of the tasks such as analysis, designing, development, testing, implementation with on site meetings, documenting current system, designing database, etc. Showcasing this set of slides titled Gantt Chart Presenting Waterfall Project Management In Healthcare Pictures PDF. The topics addressed in these templates are Documenting Current System, Designing Database, Development. All the content presented in this PPT design is completely editable. Download it and make adjustments in color, background, font etc. as per your unique business setting.

Product FMEA Tool Chart Ppt PowerPoint Presentation Show Model PDF
This slide represents product FMEC chart which allows and helps teams to prepare and build process safeguards that will reduce or prevent the occurrence of operational downtime. It includes process, potential failure mode, cause, action recommended and action to be taken.Showcasing this set of slides titled Product FMEA Tool Chart Ppt PowerPoint Presentation Show Model PDF. The topics addressed in these templates are Current Controls, Potential Causes, Action Recommend. All the content presented in this PPT design is completely editable. Download it and make adjustments in color, background, font etc. as per your unique business setting.

Human Resource Value Chain Chart Showing Impact Slides PDF
This slide shows HR value chain chart to show value addition in organizational goals. It includes elements such as process, effectiveness, and impact. Persuade your audience using this Human Resource Value Chain Chart Showing Impact Slides PDF. This PPT design covers three stages, thus making it a great tool to use. It also caters to a variety of topics including Process, Effectivenes, Impact. Download this PPT design now to present a convincing pitch that not only emphasizes the topic but also showcases your presentation skills.

Enterprise Development Training Plan Chart With Target Employee Structure PDF
The following slide highlights the corporate development training chart for employees to upskill and reskill their skillset. It constitutes of elements such as target department, employee title and the number of people etc. Persuade your audience using this Enterprise Development Training Plan Chart With Target Employee Structure PDF. This PPT design covers three stages, thus making it a great tool to use. It also caters to a variety of topics including Department, Finance, Marketing And Sales. Download this PPT design now to present a convincing pitch that not only emphasizes the topic but also showcases your presentation skills.

Property And Casualties Insurance Business Profile Organisation Chart Sample PDF
The slide depicts the company hierarchical chart to define the various management positions in organization. It depicts chief executive officer, chief financial officer, executive vice president, sales and marketing director, legal advisor, actuary and IT consultant. It also shows board of directors, risk management committee and office of compliance. Deliver an awe inspiring pitch with this creative Property And Casualties Insurance Business Profile Organisation Chart Sample PDF bundle. Topics like Chief Executive Officer, Executive Of Directors, Board Of Directors can be discussed with this completely editable template. It is available for immediate download depending on the needs and requirements of the user.

Effective Hiring Plan Weekly Schedule Gantt Chart Plan Infographics PDF
This slide covers activities chart for recruitment program. It includes different tasks, duration, weekly schedule for determining vacancies, deciding job grade, salary structure, preparation of advertisement plan, candidate screening, etc. Pitch your topic with ease and precision using this Effective Hiring Plan Weekly Schedule Gantt Chart Plan Infographics PDF. This layout presents information on Determine, Advertisement Plan, Informtion. It is also available for immediate download and adjustment. So, changes can be made in the color, design, graphics or any other component to create a unique layout.

Automated New Staff Onboarding Process Flow Chart Themes PDF
This slide depicts a flow chart for streamlining the entire automated staff onboarding process. It includes various steps such as adding new employee names, preparing an onboarding checklist, task assignment, etc. Showcasing this set of slides titled Automated New Staff Onboarding Process Flow Chart Themes PDF. The topics addressed in these templates are Automatic Notification, Portal, Employees. All the content presented in this PPT design is completely editable. Download it and make adjustments in color, background, font etc. as per your unique business setting.

Project Performance Progress Monitoring Calendar Chart Pictures PDF
This slide covers the project performance measurement schedule chart. It includes the project details along with the project status, task assigned to, start date, end date, and duration of completing each task. Showcasing this set of slides titled Project Performance Progress Monitoring Calendar Chart Pictures PDF. The topics addressed in these templates are Plan Risk Management, Project Definition And Planning, Execution. All the content presented in this PPT design is completely editable. Download it and make adjustments in color, background, font etc. as per your unique business setting.

Weekly Project Monitoring Calendar Performance Gantt Chart Formats PDF
This template covers the project implementation chart with various project stages. It also includes the project task completion status with task start date, end date, target days, days taken to complete the task, percentage of the job finished, etc. Showcasing this set of slides titled Weekly Project Monitoring Calendar Performance Gantt Chart Formats PDF. The topics addressed in these templates are Plan, Execution, Analysis. All the content presented in this PPT design is completely editable. Download it and make adjustments in color, background, font etc. as per your unique business setting.

Organisation Chart Health And Property Insurance Company Profile Structure PDF
The slide depicts the company hierarchical chart to define the various management positions in organization. It depicts chief executive officer, chief financial officer, executive vice president, sales and marketing director, legal advisor, actuary and IT consultant. It also shows board of directors, risk management committee and office of compliance. Deliver an awe inspiring pitch with this creative Organisation Chart Health And Property Insurance Company Profile Structure PDF bundle. Topics like Board Of Directors, Executive Of Directors, Chief Executive Officer can be discussed with this completely editable template. It is available for immediate download depending on the needs and requirements of the user.

SEO Marketing Team Training And Development Gantt Chart Rules PDF
This slide represents the gantt chart showing the search engine optimization SEO training offered by an enterprise to its marketing team. It includes details related to training on keyword research, content planning, on-page and off-page SEO, you tube SEO, blog optimization, conversion tracking etc. Persuade your audience using this SEO Marketing Team Training And Development Gantt Chart Rules PDF. This PPT design covers one stages, thus making it a great tool to use. It also caters to a variety of topics including Keyword Research, Content Planning, SEO Competition Analysis. Download this PPT design now to present a convincing pitch that not only emphasizes the topic but also showcases your presentation skills.
Project Incremental Life Cycles Gantt Chart Icon Information PDF
This slide covers spiral model that puts focus on thorough risk assessment. It includes spiral iteration starting with four activities such as thorough planning, risk analysis, prototypes creation and evaluation of part previously delivered. Pitch your topic with ease and precision using this Project Incremental Life Cycles Gantt Chart Icon Information PDF. This layout presents information on Project Incremental, Life Cycles Gantt, Chart Icon. It is also available for immediate download and adjustment. So, changes can be made in the color, design, graphics or any other component to create a unique layout.

7 Step Workflow Chart For Software Deployment Introduction PDF
This slide consists of a seven step flow chart for deployment of a software program. The elements covered in the slide are software requirements analysis, resource planning, software maintenance and updates, designing and prototyping etc. Persuade your audience using this 7 Step Workflow Chart For Software Deployment Introduction PDF. This PPT design covers Seven stages, thus making it a great tool to use. It also caters to a variety of topics including Software Requirements Analysis, Resource Planning, Designing And Prototyping. Download this PPT design now to present a convincing pitch that not only emphasizes the topic but also showcases your presentation skills.
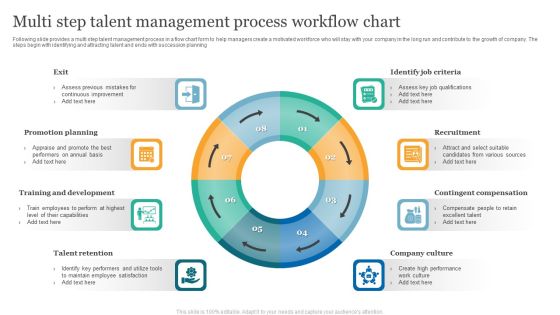
Multi Step Talent Management Process Workflow Chart Background PDF
Following slide provides a multi step talent management process in a flow chart form to help managers create a motivated workforce who will stay with your company in the long run and contribute to the growth of company. The steps begin with identifying and attracting talent and ends with succession planning. Presenting Multi Step Talent Management Process Workflow Chart Background PDF to dispense important information. This template comprises Eight stages. It also presents valuable insights into the topics including Promotion Planning, Training And Development, Talent Retention. This is a completely customizable PowerPoint theme that can be put to use immediately. So, download it and address the topic impactfully.

Gantt Chart For Stock Management Approach Slides PDF
This slide showcases gantt. chart that can help organization to track key milestones that are organizing and placing the order, order arrivals plus itinerary updates. It showcases progress for a period of three weeks. Pitch your topic with ease and precision using this Gantt Chart For Stock Management Approach Slides PDF. This layout presents information on Make Preliminary, Receive Approval, Arrived Accordingly. It is also available for immediate download and adjustment. So, changes can be made in the color, design, graphics or any other component to create a unique layout.

Action Management Chart For Project Status Progress Background PDF
This slide exhibits project action planning chart illustrating action steps, goal, department responsible etc that helps organization to monitor and track project progress and take immediate required steps to make procedure more efficient. Showcasing this set of slides titled Action Management Chart For Project Status Progress Background PDF. The topics addressed in these templates are Web Development, Marketing, Resources Required. All the content presented in this PPT design is completely editable. Download it and make adjustments in color, background, font etc. as per your unique business setting.
Project Task Management Chart For Tracking Progress Themes PDF
This slide exhibits project task planning chart for tracking progress illustrating task description, starting date, planned ending date, actual end date, planned work days etc that helps in tracking project progress. Showcasing this set of slides titled Project Task Management Chart For Tracking Progress Themes PDF. The topics addressed in these templates are Requirements Analysis, Business Case, Configuration Management. All the content presented in this PPT design is completely editable. Download it and make adjustments in color, background, font etc. as per your unique business setting.

Construction Project Administration Strategy With Gantt Chart Topics PDF
This slide covers a Gantt Chart which will help project leaders in tracking the status of the tasked involved in the project. It also includes project name, start date, end date, projects assigned to and percentage of task completion.Pitch your topic with ease and precision using this Construction Project Administration Strategy With Gantt Chart Topics PDF. This layout presents information on Estimate Complete, Basement Demolition, Contract Signed. It is also available for immediate download and adjustment. So, changes can be made in the color, design, graphics or any other component to create a unique layout.

Vehicle Management System Process Flow Chart Introduction PDF
This slide represents the flow chart for effectively tracking and managing activities of vehicles such as trucks, cards and construction equipment. It starts with planning, dispatching end ends with control unit and user interface. Showcasing this set of slides titled Vehicle Management System Process Flow Chart Introduction PDF. The topics addressed in these templates are Central Computer, Communication Device, Data Logging. All the content presented in this PPT design is completely editable. Download it and make adjustments in color, background, font etc. as per your unique business setting.

Software Implementation Project Gantt Chart Ppt Gallery Pictures PDF
This slide represents the Gantt chart showing effective implementation of software development project. It includes details related to analysis, design, development, testing, implementation etc. of the software development project. Make sure to capture your audiences attention in your business displays with our gratis customizable Software Implementation Project Gantt Chart Ppt Gallery Pictures PDF. These are great for business strategies, office conferences, capital raising or task suggestions. If you desire to acquire more customers for your tech business and ensure they stay satisfied, create your own sales presentation with these plain slides.

Strategic Performance Analysis And Management Meeting Chart Portrait PDF
This slide demonstrates strategic review meetings chart for organisations to achieve higher level of performance management. This slide includes three types of performance review meetings such as enterprise and department strategy and enterprise strategy refresh. Pitch your topic with ease and precision using this Strategic Performance Analysis And Management Meeting Chart Portrait PDF. This layout presents information on Enterprise Strategy, Review Meeting, Department Strategy. It is also available for immediate download and adjustment. So, changes can be made in the color, design, graphics or any other component to create a unique layout.

Input Process Output Chart Analysis In Recruitment Process Sample PDF
This slide covers the IPO chart analysis used in recruitment process by the human resource department. The purpose of this table is improve the hiring process of an organization. It includes information related to the input, process, output and HR. Showcasing this set of slides titled Input Process Output Chart Analysis In Recruitment Process Sample PDF. The topics addressed in these templates are Business Leaders, Manager, Recruiter, Agency. All the content presented in this PPT design is completely editable. Download it and make adjustments in color, background, font etc. as per your unique business setting.
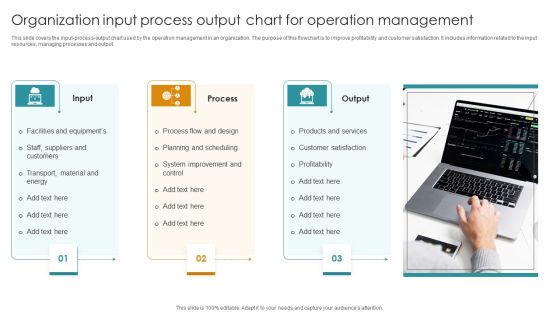
Organization Input Process Output Chart For Operation Management Designs PDF
This slide covers the input-process-output chart used by the operation management in an organization. The purpose of this flowchart is to improve profitability and customer satisfaction. It includes information related to the input resources, managing processes and output. Presenting Organization Input Process Output Chart For Operation Management Designs PDF to dispense important information. This template comprises Three stages. It also presents valuable insights into the topics including Process Flow And Design, Products And Services Transport, Material And Energy. This is a completely customizable PowerPoint theme that can be put to use immediately. So, download it and address the topic impactfully.
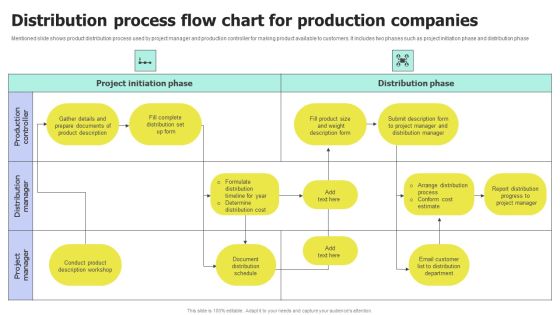
Distribution Process Flow Chart For Production Companies Portrait PDF
Mentioned slide shows product distribution process used by project manager and production controller for making product available to customers. It includes two phases such as project initiation phase and distribution phase. Showcasing this set of slides titled Distribution Process Flow Chart for Production Companies Portrait PDF. The topics addressed in these templates are Process Flow Chart, Production Companies. All the content presented in this PPT design is completely editable. Download it and make adjustments in color, background, font etc. as per your unique business setting.

Outbound Call Center Process Flow Chart Introduction PDF
This slide showcases Flowchart of the outbound call center process. It includes calling to make sale , addressing customers, trying to convince customer to purchase product , getting products information from agent etc. Presenting Outbound Call Center Process Flow Chart Introduction PDF to dispense important information. This template comprises one stages. It also presents valuable insights into the topics including Outbound Call Center, Process Flow Chart. This is a completely customizable PowerPoint theme that can be put to use immediately. So, download it and address the topic impactfully.

Gap Selling Methodology Problem Identification Chart Of Company Icons PDF
Following slide shows problem identification chart that helps to identify and understand company major selling issues. It include various problems such as rise in competition, decline in sales, weak lead generation etc. with impact and root causes. Presenting Gap Selling Methodology Problem Identification Chart Of Company Icons PDF to dispense important information. This template comprises three stages. It also presents valuable insights into the topics including Problem, Sales Department Gap Analysis, Root Causes . This is a completely customizable PowerPoint theme that can be put to use immediately. So, download it and address the topic impactfully.

Error Tracking With Priority And Status Analysis Chart Icons PDF
This template covers issues analysis reports based on problem status and priority level. It also includes KPIs such as department, reporting date, responsible person, the actual status of the issue, etc. Showcasing this set of slides titled Error Tracking With Priority And Status Analysis Chart Icons PDF. The topics addressed in these templates are Issue Description, Current Status Issues, Analysis Chart. All the content presented in this PPT design is completely editable. Download it and make adjustments in color, background, font etc. as per your unique business setting.

Employee Training And Development Plan Flow Chart Clipart PDF
This slide shows the flow chart process of training and development strategy. It includes stages such as analysis, design, development, implementation and assesment. Persuade your audience using this Employee Training And Development Plan Flow Chart Clipart PDF. This PPT design covers five stages, thus making it a great tool to use. It also caters to a variety of topics including Development, Implementation, Assessment. Download this PPT design now to present a convincing pitch that not only emphasizes the topic but also showcases your presentation skills.

New Product Launch Task Timeline Chart Demonstration PDF
This slide illustrates Gantt chart with new product release activities. It also includes process stages such as idea generation, idea screening, concept development, business analysis, beta testing, technical implementation, and commercialization. Showcasing this set of slides titled New Product Launch Task Timeline Chart Demonstration PDF. The topics addressed in these templates are Idea Generation, Idea Screening, Concept Development. All the content presented in this PPT design is completely editable. Download it and make adjustments in color, background, font etc. as per your unique business setting.

Flow Chart Of Software Release Procedure Professional PDF
This slide shows flow chart which can be used by organizations to release software. It includes various stages such as release awareness and assessment, SDS change, build approval, design, build, test, etc. Persuade your audience using this Flow Chart Of Software Release Procedure Professional PDF. This PPT design covers one stages, thus making it a great tool to use. It also caters to a variety of topics including Design, Patching Process, Development. Download this PPT design now to present a convincing pitch that not only emphasizes the topic but also showcases your presentation skills.

Big Data Analytics Process Flow Chart Topics PDF
Following slide provides big data handing flow chart which can be used by business to increase business productivity. It includes steps such as raw data collection, data processing, data validation, error free data storage, data filtration, etc. Showcasing this set of slides titled Big Data Analytics Process Flow Chart Topics PDF. The topics addressed in these templates are Conduct Data, Information, Evaluation. All the content presented in this PPT design is completely editable. Download it and make adjustments in color, background, font etc. as per your unique business setting.

Flow Chart Depicting Working Of Product Development Strategy Sample PDF
This slide showcases a flow chart depicting a product development strategy that assists in turning a concept into a product. It also includes stages such as analyzing current market, identifying potential new markets, getting new ideas, etc. Showcasing this set of slides titled Flow Chart Depicting Working Of Product Development Strategy Sample PDF. The topics addressed in these templates are Existing Market, Profitability, Production Cost. All the content presented in this PPT design is completely editable. Download it and make adjustments in color, background, font etc. as per your unique business setting.
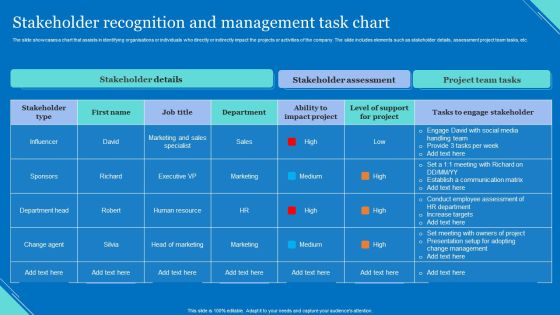
Stakeholder Recognition And Management Task Chart Clipart PDF
The slide showcases a chart that assists in identifying organisations or individuals who directly or indirectly impact the projects or activities of the company. The slide includes elements such as stakeholder details, assessment project team tasks, etc. Showcasing this set of slides titled Stakeholder Recognition And Management Task Chart Clipart PDF. The topics addressed in these templates are Stakeholder Details, Stakeholder Assessment, Project Team Tasks. All the content presented in this PPT design is completely editable. Download it and make adjustments in color, background, font etc. as per your unique business setting.

Web Design Development Project Strategy Gantt Chart Information PDF
The slide showcases a website design project Gantt chart help visualizing project plan over the course of several weeks or even months. It covers aspects such as key tasks, progress and assigned teams. Pitch your topic with ease and precision using this Web Design Development Project Strategy Gantt Chart Information PDF. This layout presents information on Content Design, Develop Content, Web Design Project. It is also available for immediate download and adjustment. So, changes can be made in the color, design, graphics or any other component to create a unique layout.
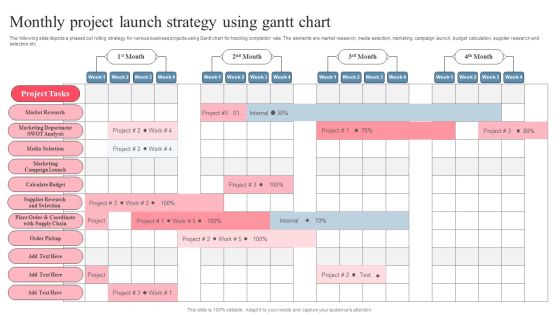
Monthly Project Launch Strategy Using Gantt Chart Introduction PDF
The following slide depicts a phased out rolling strategy for various business projects using Gantt chart for tracking completion rate. The elements are market research, media selection, marketing campaign launch, budget calculation, supplier research and selection etc. Showcasing this set of slides titled Monthly Project Launch Strategy Using Gantt Chart Introduction PDF. The topics addressed in these templates are Marketing Campaign Launch, Calculate Budget, Supplier Research And Selection. All the content presented in this PPT design is completely editable. Download it and make adjustments in color, background, font etc. as per your unique business setting.

Truck Succession Plan Chart With Estimated Cost Pictures PDF
This slide displays the replacement planning of trucks in an organisation for better transportation facilities and smooth functioning. It also includes the various types of vehicles with their building year , expected replacement and next replacement year and estimated cost incurred during this process. Pitch your topic with ease and precision using this Truck Succession Plan Chart With Estimated Cost Pictures PDF. This layout presents information on Cost, Truck, Chart. It is also available for immediate download and adjustment. So, changes can be made in the color, design, graphics or any other component to create a unique layout.

Digital Promotions Execution Plan Using Gantt Chart Mockup PDF
This slide presents a month wise digital marketing plan using gantt chart which provides useful insights to brand managers for managing interdependencies between marketing activities. Some of the marketing activities are paid advertising, giveaway contests, influencer collaboration etc. Showcasing this set of slides titled Digital Promotions Execution Plan Using Gantt Chart Mockup PDF. The topics addressed in these templates are Paid Advertising, Social Media Campaign, Marketing Strategies. All the content presented in this PPT design is completely editable. Download it and make adjustments in color, background, font etc. as per your unique business setting.

Cross Functional Hr And Accounting Procedure Flow Chart Sample PDF
This slide consists of a diagrammatical representation of cross functional flow chart which provides insights about the human resource and accounting process. The elements are closed payroll cycle, enter new employee information, enter correct information, verify, send for review etc. Showcasing this set of slides titled Cross Functional Hr And Accounting Procedure Flow Chart Sample PDF. The topics addressed in these templates are Correct Information, Employee Information, Overtime Approval. All the content presented in this PPT design is completely editable. Download it and make adjustments in color, background, font etc. as per your unique business setting.

Outstanding Accounting Payable Procedure Flow Chart Introduction PDF
This slide consists flow chart which shows the sequence of events to be followed by accounts payable department in order to complete a transaction. Key elements include complete purchase worksheet, forward invoice, purchase order sorting, delivery of mail, verification of accounting documents etc. Showcasing this set of slides titled Outstanding Accounting Payable Procedure Flow Chart Introduction PDF. The topics addressed in these templates are Purchase Department, Place Order, Accounting. All the content presented in this PPT design is completely editable. Download it and make adjustments in color, background, font etc. as per your unique business setting.
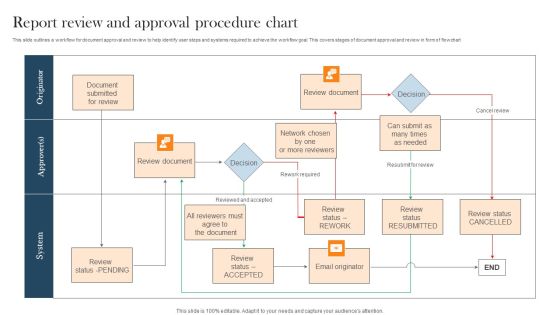
Report Review And Approval Procedure Chart Pictures PDF
This slide outlines a workflow for document approval and review to help identify user steps and systems required to achieve the workflow goal. This covers stages of document approval and review in form of flowchart Showcasing this set of slides titled Report Review And Approval Procedure Chart Pictures PDF. The topics addressed in these templates are Review Document, Chart, Decision. All the content presented in this PPT design is completely editable. Download it and make adjustments in color, background, font etc. as per your unique business setting.
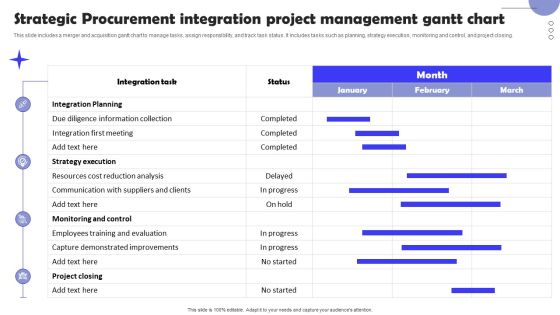
Strategic Procurement Integration Project Management Gantt Chart Summary PDF
This slide includes a merger and acquisition gantt chart to manage tasks, assign responsibility, and track task status. It includes tasks such as planning, strategy execution, monitoring and control, and project closing. Showcasing this set of slides titled Strategic Procurement Integration Project Management Gantt Chart Summary PDF. The topics addressed in these templates are Integration Planning, Monitoring And Control, Strategy Execution. All the content presented in this PPT design is completely editable. Download it and make adjustments in color, background, font etc. as per your unique business setting.
SIPOC Action Plan Chart For Fast Food Restaurant Sample PDF
This slide consists of a supplier, input, process, output, and customer action plan chart that can be implemented by restaurant staff in order to streamline processes. Key elements include supplier, input, process, output, and customer. Presenting SIPOC Action Plan Chart For Fast Food Restaurant Sample PDF to dispense important information. This template comprises five stages. It also presents valuable insights into the topics including Resources Required, Resource Providers, Customer. This is a completely customizable PowerPoint theme that can be put to use immediately. So, download it and address the topic impactfully.
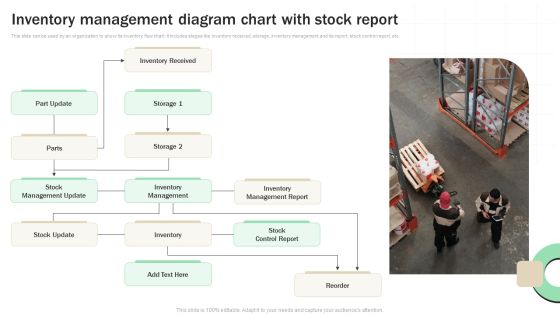
Inventory Management Diagram Chart With Stock Report Topics PDF
This slide can be used by an organization to show its inventory flow chart. It includes stages like inventory received, storage, inventory management and its report, stock control report, etc. Persuade your audience using this Inventory Management Diagram Chart With Stock Report Topics PDF. This PPT design covers one stages, thus making it a great tool to use. It also caters to a variety of topics including Inventory Management Report, Stock Control Report, Stock Report. Download this PPT design now to present a convincing pitch that not only emphasizes the topic but also showcases your presentation skills.

Executing Operation Administration Project Flow Chart Clipart PDF
This slide shows the flowchart for carrying out an operation management project which assist in enhancing process standardization. It passes through various stages such as establishing project team, communication charts, quality check, etc. Presenting Executing Operation Administration Project Flow Chart Clipart PDF to dispense important information. This template comprises one stages. It also presents valuable insights into the topics including Executing Security, Establish Project Team. This is a completely customizable PowerPoint theme that can be put to use immediately. So, download it and address the topic impactfully.
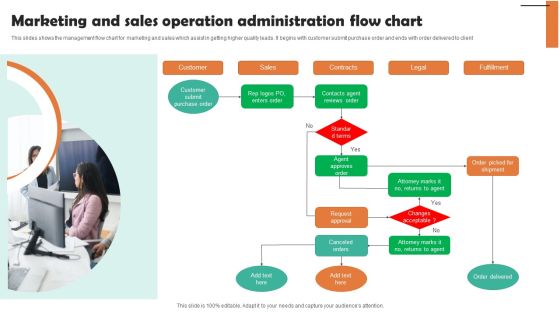
Marketing And Sales Operation Administration Flow Chart Ideas PDF
This slides shows the management flow chart for marketing and sales which assist in getting higher quality leads. It begins with customer submit purchase order and ends with order delivered to client. Presenting Marketing And Sales Operation Administration Flow Chart Ideas PDF to dispense important information. This template comprises one stages. It also presents valuable insights into the topics including Customer, Sales, Contracts. This is a completely customizable PowerPoint theme that can be put to use immediately. So, download it and address the topic impactfully.
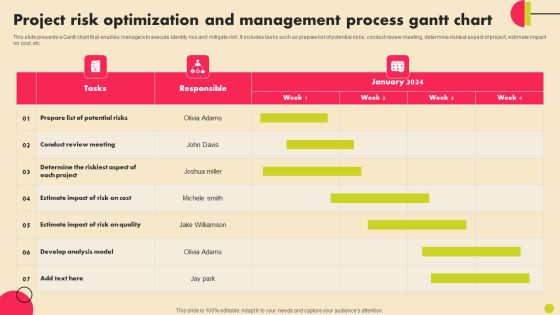
Project Risk Optimization And Management Process Gantt Chart Introduction PDF
This slide presents a Gantt chart that enables managers to execute identity risk and mitigate risk. It includes tasks such as prepare list of potential risks, conduct review meeting, determine riskiest aspect of project, estimate impact on cost, etc. Pitch your topic with ease and precision using this Project Risk Optimization And Management Process Gantt Chart Introduction PDF. This layout presents information on Determine, Develop Analysis Model, Potential Risks. It is also available for immediate download and adjustment. So, changes can be made in the color, design, graphics or any other component to create a unique layout.

Product Manufacturing Process Flow Chart With QA Framework Download PDF
This slide displays product development flow chart with quality inspection to determine quality defected at early production stage. It includes elements such as creating new product, raw material handling, quality inspection, documentation, product shipping, and product cycle complete. Pitch your topic with ease and precision using this Product Manufacturing Process Flow Chart With QA Framework Download PDF. This layout presents information on Quality Inspection, Requirements, Material Assembling. It is also available for immediate download and adjustment. So, changes can be made in the color, design, graphics or any other component to create a unique layout.

Modern Technology Stack Flow Chart For Manufacturing Busines Topics PDF
Mentioned slide displays three stages data stack flow chart with respective tools which can be sued by manufacturing firms to improve business performance. It includes stages such as ingestion, storage or warehouse and publication or serving. Pitch your topic with ease and precision using this Modern Technology Stack Flow Chart For Manufacturing Busines Topics PDF. This layout presents information on Database, Applications, Documents. It is also available for immediate download and adjustment. So, changes can be made in the color, design, graphics or any other component to create a unique layout.

Big Data Analytics Procedure Flow Chart Portrait PDF
This slide showcases big data analysis process to enable access of enormous information and extracting meaningful insights. It includes elements such as data gathering, data integration, data cleaning, extraction and transformation Pitch your topic with ease and precision using this Big Data Analytics Procedure Flow Chart Portrait PDF. This layout presents information on Raw Data, Flow Chart, Big Data. It is also available for immediate download and adjustment. So, changes can be made in the color, design, graphics or any other component to create a unique layout.
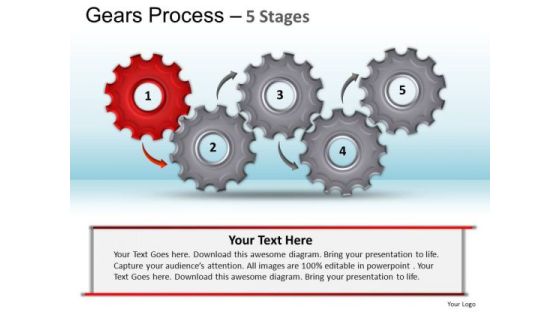
PowerPoint Design Slides Chart Gears Process Ppt Template
PowerPoint Design Slides Chart Gears Process PPT Template-The Circle of Life - a concept emmbedded in our minds and hence easy to comprehend. Life and Business is made up of processes comprising stages that flow from one to another. An excellent graphic to attract the attention of and understanding by your audience to improve earnings.
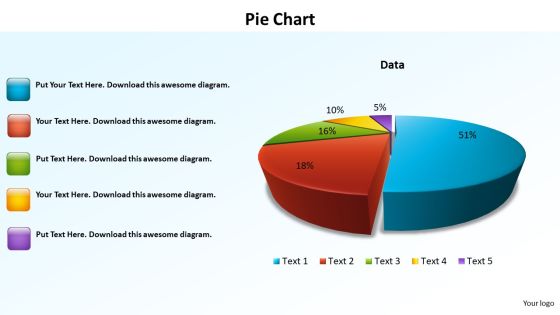
PowerPoint Templates Data Driven Pie Chart Ppt Themes
PowerPoint Templates Data Driven Pie Chart PPT Themes-The Circle of Life - a concept emmbedded in our minds and hence easy to comprehend. Life and Business is made up of processes comprising stages that flow from one to another. An excellent graphic to attract the attention of and understanding by your audience to improve earnings.
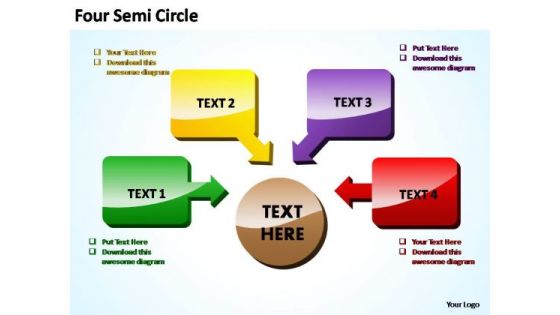
PowerPoint Templates Chart Four Steps To Meet Target Ppt Slide
PowerPoint Templates Chart Four steps to meet Target PPT Slide-The Circle of Life - a concept emmbedded in our minds and hence easy to comprehend. Life and Business is made up of processes comprising stages that flow from one to another. An excellent graphic to attract the attention of and understanding by your audience to improve earnings.
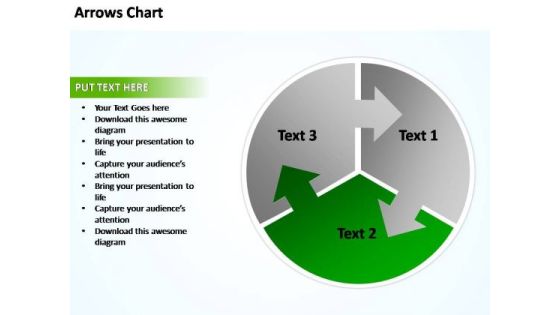
PowerPoint Templates Business Circular Plan With Arrows Chart Ppt Designs
PowerPoint Templates Business Circular Plan With Arrows Chart PPT Designs-Explore the various directions and layers existing in your in your plans and processes. Unravel the desired and essential elements of your overall strategy. Explain the relevance of the different layers and stages and directions in getting down to your core competence, ability and desired result.
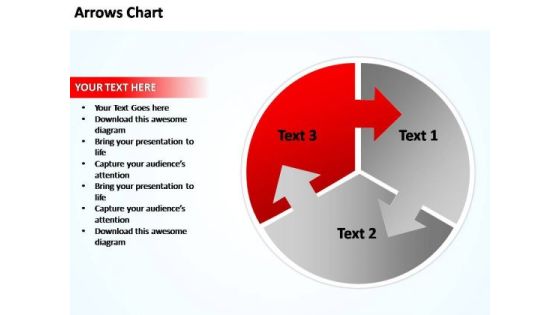
PowerPoint Templates Business Circular Plan With Arrows Chart Ppt Slides
PowerPoint Templates Business Circular Plan With Arrows Chart PPT Slides-Explore the various directions and layers existing in your in your plans and processes. Unravel the desired and essential elements of your overall strategy. Explain the relevance of the different layers and stages and directions in getting down to your core competence, ability and desired result.
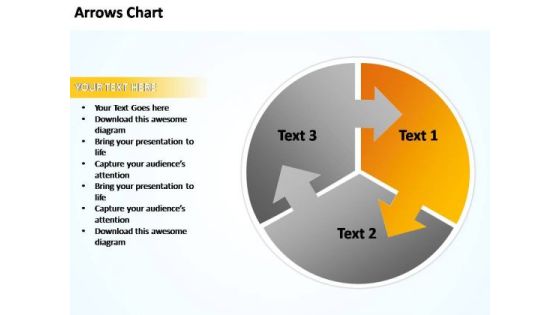
PowerPoint Templates Business Circular Plan With Arrows Chart Ppt Theme
PowerPoint Templates Business Circular Plan With Arrows Chart PPT Theme-Explore the various directions and layers existing in your in your plans and processes. Unravel the desired and essential elements of your overall strategy. Explain the relevance of the different layers and stages and directions in getting down to your core competence, ability and desired result.
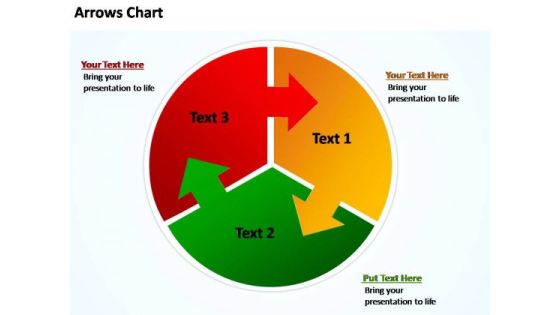
PowerPoint Templates Business Circular Plan With Arrows Chart Ppt Themes
PowerPoint Templates Business Circular Plan With Arrows Chart PPT Themes-Explore the various directions and layers existing in your in your plans and processes. Unravel the desired and essential elements of your overall strategy. Explain the relevance of the different layers and stages and directions in getting down to your core competence, ability and desired result.
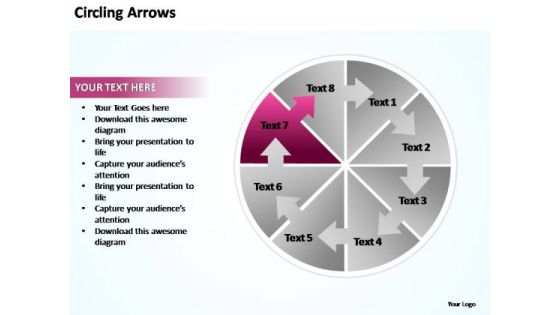
PowerPoint Templates Circling Arrows Flow Chart Ppt Backgrounds
PowerPoint Templates Circling Arrows Flow Chart PPT Backgrounds-Explore the various directions and layers existing in your in your plans and processes. Unravel the desired and essential elements of your overall strategy. Explain the relevance of the different layers and stages and directions in getting down to your core competence, ability and desired result.
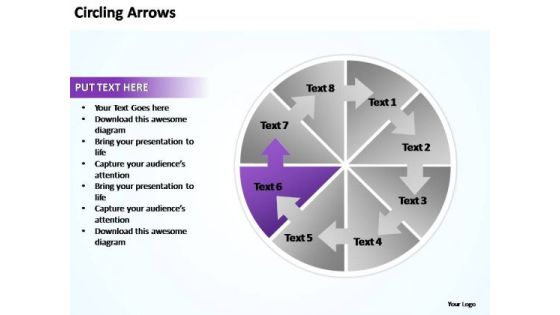
PowerPoint Templates Circling Arrows Flow Chart Ppt Design Slides
PowerPoint Templates Circling Arrows Flow Chart PPT Design Slides-Explore the various directions and layers existing in your in your plans and processes. Unravel the desired and essential elements of your overall strategy. Explain the relevance of the different layers and stages and directions in getting down to your core competence, ability and desired result.
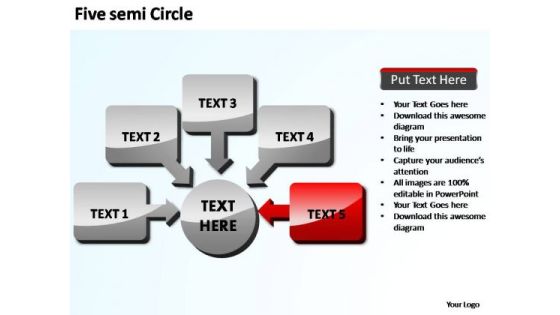
PowerPoint Backgrounds Chart Five New Concepts Ppt Slide
PowerPoint Backgrounds Chart Five New Concepts PPT Slide-Explore the various directions and layers existing in your in your plans and processes. Unravel the desired and essential elements of your overall strategy. Explain the relevance of the different layers and stages and directions in getting down to your core competence, ability and desired result.

PowerPoint Design Chart Five New Concepts Ppt Slide
PowerPoint Design Chart Five New Concepts PPT Slide-Explore the various directions and layers existing in your in your plans and processes. Unravel the desired and essential elements of your overall strategy. Explain the relevance of the different layers and stages and directions in getting down to your core competence, ability and desired result.
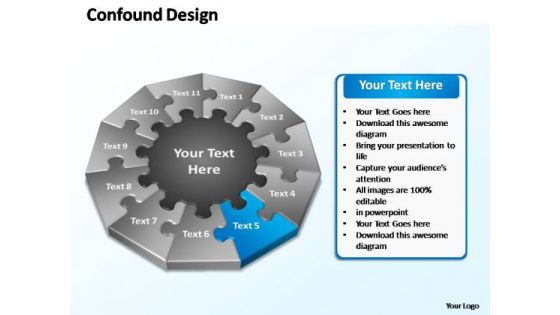
PowerPoint Slide Layout Chart Confound Design Ppt Slide
PowerPoint Slide layout Chart Confound Design PPT Slide-Puzzles PowerPoint templates being the perennial educational tool. Emphasize the process of your business/corporate growth. Highlight your ideas broad- based on strong fundamentals and illustrate how they step by step achieve the set growth factor.
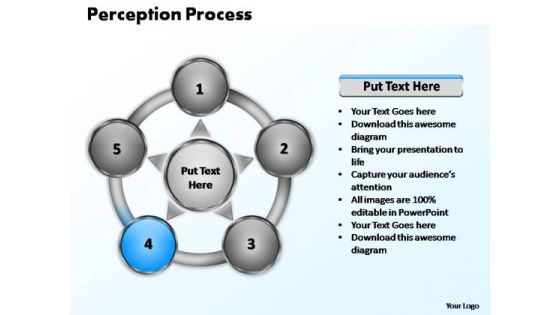
PowerPoint Slide Layout Chart Five Perception Ppt Design
PowerPoint Slide layout Chart Five Perception PPT Design-The Circle of Life - a concept emmbedded in our minds and hence easy to comprehend. Life and Business is made up of processes comprising stages that flow from one to another. An excellent graphic to attract the attention of and understanding by your audience to improve earnings.
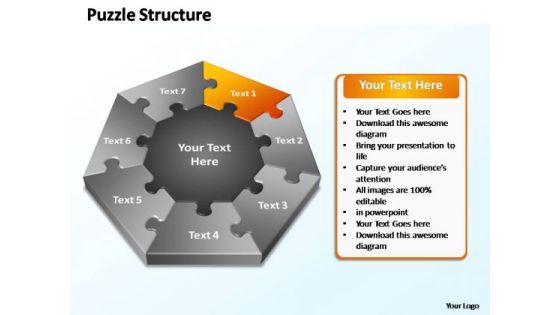
PowerPoint Slide Layout Chart Puzzle Structure Ppt Design Slides
PowerPoint Slide layout Chart Puzzle Structure PPT Design Slides-Puzzles PowerPoint templates being the perennial educational tool. Emphasize the process of your business/corporate growth. Highlight your ideas broad- based on strong fundamentals and illustrate how they step by step achieve the set growth factor.

PowerPoint Presentation Education Semi Circle Chart Ppt Theme
PowerPoint Presentation Education Semi Circle Chart PPT Theme-The Circle of Life - a concept emmbedded in our minds and hence easy to comprehend. Life and Business is made up of processes comprising stages that flow from one to another. An excellent graphic to attract the attention of and understanding by your audience to improve earnings.
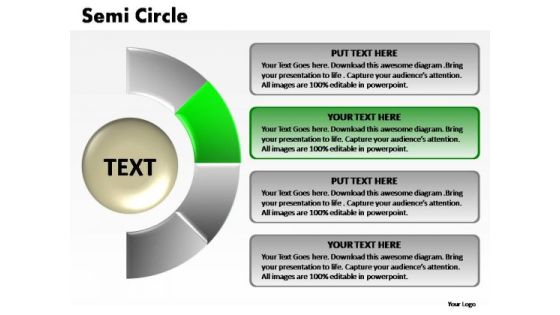
PowerPoint Presentation Strategy Semi Circle Chart Ppt Presentation
PowerPoint Presentation Strategy Semi Circle Chart PPT Presentation-The Circle of Life - a concept emmbedded in our minds and hence easy to comprehend. Life and Business is made up of processes comprising stages that flow from one to another. An excellent graphic to attract the attention of and understanding by your audience to improve earnings.
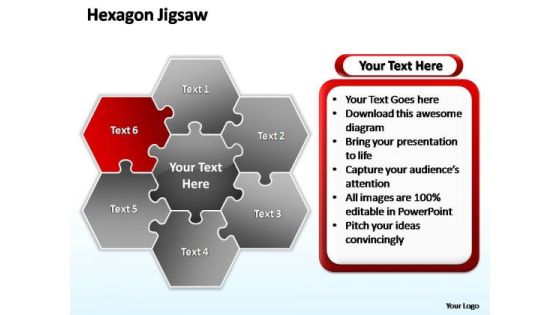
PowerPoint Process Chart Hexagon Jigsaw Ppt Presentation Designs
PowerPoint Process Chart Hexagon Jigsaw PPT Presentation Designs-Puzzles PowerPoint templates being the perennial educational tool. Emphasize the process of your business/corporate growth. Highlight your ideas broad- based on strong fundamentals and illustrate how they step by step achieve the set growth factor.
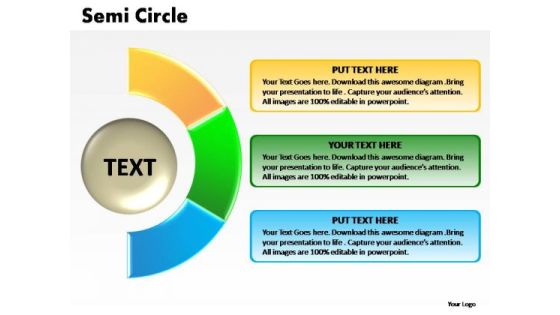
PowerPoint Process Image Semi Circle Chart Ppt Template
PowerPoint Process Image Semi Circle Chart PPT Template-The Circle of Life - a concept emmbedded in our minds and hence easy to comprehend. Life and Business is made up of processes comprising stages that flow from one to another. An excellent graphic to attract the attention of and understanding by your audience to improve earnings.
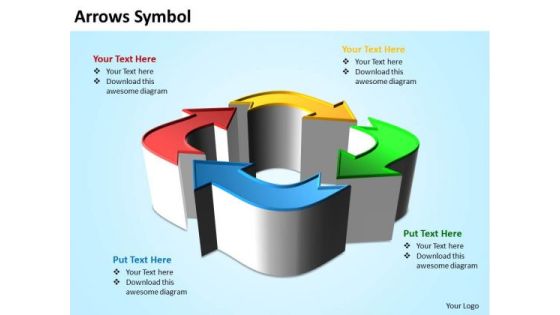
Business Charts PowerPoint Templates 3d Arrows Symbol Sales
Business Charts PowerPoint templates 3d arrows symbol Sales-This PowerPoint Diagram Shows 3D Arrows making Square like Object. This Colorful 3D Arrow Diagram will let you explain four different paths to reach the Destination. It signifies the Concept of Recycling, Reuse, Environment etc.

Business Charts PowerPoint Templates 4 Step Table Diagram Editable Sales
Business Charts PowerPoint templates 4 step table diagram editable Sales-Use this PowerPoint Diagram for step by step explanation of a Process. This diagram consists of step Table having four Steps. Each slide shows only one step with the highlighted color so that it looks more impressive and attracting.

Business Charts PowerPoint Templates Continuing Sequence Of Stages Sales
Business Charts PowerPoint templates continuing sequence of stages Sales-This Flower Based PowerPoint Diagram shows the continuous sequence of stages which may be used in Sales, Marketing, and Finance etc. It shows the description of each stage one by one that is by Highlighting one Petal at a time.
Business Charts PowerPoint Templates Design Of Confused Emoticon Sales
Business Charts PowerPoint templates design of confused emoticon Sales-This PowerPoint Diagram shows you the Designs of Confused emoticons expressing their Situation. This Diagram signifies the concept of frustration, fuddle, mess up, mislead, mortify, muddle, mystify, obscure, perplex, perturb, puzzle, shame, stir up, trouble, unhinge, unsettle, upset, and worry.
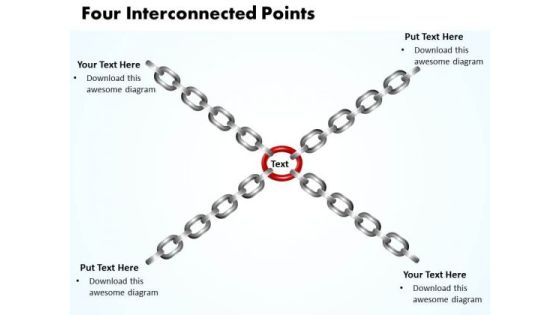
Business Charts PowerPoint Templates Four Interconnected Points Editable Sales
Business Charts PowerPoint templates four interconnected points editable Sales-This Powerpoint Diagram consists of four points connected to each other through a red Ring in the Middle. It can be used to symbolize four different Approaches which are inter-related to each other. This diagram will fit for Business Presentation
Business Charts PowerPoint Templates Naughty Emoticon Showing His Tongue Sales
Business Charts PowerPoint templates naughty emoticon showing his tongue Sales-Use this Naughty Emoticon PowerPoint Diagram to express beam, friendliness, tenderness, grin, laugh, amusement, delightful nature, happiness, pleasing nature, simper, and smirk. You can change color, size and orientation of any icon to your liking.

Santa Wishing Merry Christmas With Board Fishbone Chart PowerPoint Slides
We present our santa wishing merry christmas with board fishbone chart PowerPoint Slides.Use our Spheres PowerPoint Templates because,This structure meant to ensure smooth transition to the next level. Use our Events PowerPoint Templates because,You have the product you are very confident of and are very sure it will prove immensely popular with clients all over your target areas. Use our Festival PowerPoint Templates because, You have played a stellar role and have a few ideas. Use our Holidays PowerPoint Templates because,It shows how one can contribute to the overall feeling of well-being. Use our Spheres PowerPoint Templates because,Your listeners do not have to put on their thinking caps.Use these PowerPoint slides for presentations relating to Background, Business, Celebration, Christmas, Conceptual, Congratulation, Design, Element, Events, Graphic, Greeting, Holidays, Inscription, Invitation, Merry, Mistletoe, Phrase, Sign, Style, Wishes. The prominent colors used in the PowerPoint template are Blue, Yellow, Green. People tell us our santa wishing merry christmas with board fishbone chart PowerPoint Slides are Gorgeous. PowerPoint presentation experts tell us our Events PowerPoint templates and PPT Slides are the best it can get when it comes to presenting. PowerPoint presentation experts tell us our santa wishing merry christmas with board fishbone chart PowerPoint Slides will get their audience's attention. Professionals tell us our Celebration PowerPoint templates and PPT Slides are Attractive. Professionals tell us our santa wishing merry christmas with board fishbone chart PowerPoint Slides effectively help you save your valuable time. People tell us our Element PowerPoint templates and PPT Slides will get their audience's attention.

3 Components Required In Process Simple Flow Chart PowerPoint Slides
We present our 3 components required in process simple flow chart PowerPoint Slides.Use our Arrows PowerPoint Templates because,Very often it is important to reflect on the basics. Use our Shapes PowerPoint Templates because,It transmits this clarity of purpose onto the eager minds of your team. Use our Leadership PowerPoint Templates because,Forward thinking is the way to go. Use our Business PowerPoint Templates because,You have selected your team man for man Use our Process and Flows PowerPoint Templates because, It focuses the light on the path to sure shot success.Use these PowerPoint slides for presentations relating to advice, analysis, analyze, background, business, businessman, collaboration, component, concept, constrain, corporate, education, hand, human, limit, management, manager, meeting, method, plan, presentation, principle, project, requirement, resources, scheme, strategy, . The prominent colors used in the PowerPoint template are Green, Green dark , Red. People tell us our 3 components required in process simple flow chart PowerPoint Slides are No-nonsense. The feedback we get is that our businessman PowerPoint templates and PPT Slides are Wonderful. People tell us our 3 components required in process simple flow chart PowerPoint Slides are Great. Presenters tell us our concept PowerPoint templates and PPT Slides will make the presenter look like a pro even if they are not computer savvy. The feedback we get is that our 3 components required in process simple flow chart PowerPoint Slides are Energetic. Professionals tell us our collaboration PowerPoint templates and PPT Slides are Striking.
Professional Tutorial 4 Stages Make Flow Chart PowerPoint Templates
We present our professional tutorial 4 stages make flow chart PowerPoint templates.Use our Business PowerPoint Templates because, Infrastructure growth is an obvious requirement of today.Inform your group on how exactly this potential is tailor made for you Use our Arrows PowerPoint Templates because,This slide helps you to communicate your concerns and educate your team along the path to success. Use our Shapes PowerPoint Templates because,you can Break it all down to Key Result Areas. Use our Signs PowerPoint Templates because,This PPT slide helps you to measure key aspects of the current process and collect relevant data Use our Symbol PowerPoint Templates because, You have made significant headway in this field.Use these PowerPoint slides for presentations relating to arrow, background, bookmark, card, choice, concept, corporate, creative, design, direction, flow, illustration, instruction, label, layout, manual, modern, number, offer, one, options, order, page, paper, pointer, product, progress, promotion, retro, sequence, simple, special, step, symbol,. The prominent colors used in the PowerPoint template are Blue navy, Blue light, Green. People tell us our professional tutorial 4 stages make flow chart PowerPoint templates are Detailed. The feedback we get is that our creative PowerPoint templates and PPT Slides are Breathtaking. People tell us our professional tutorial 4 stages make flow chart PowerPoint templates are Romantic. Presenters tell us our concept PowerPoint templates and PPT Slides are Precious. The feedback we get is that our professional tutorial 4 stages make flow chart PowerPoint templates will save the presenter time. Professionals tell us our card PowerPoint templates and PPT Slides are Handsome.
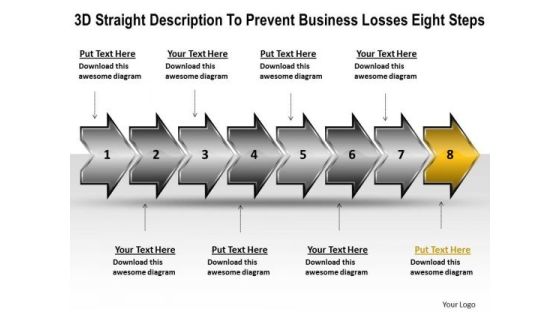
Business PowerPoint Presentation Losses Eight Steps Flow Chart Slides
We present our business powerpoint presentation losses eight steps flow chart Slides.Download our Finance PowerPoint Templates because they represent the proress in our lives. Download our Business PowerPoint Templates because watch the excitement levels rise as they realise their worth. Download our Process and Flows PowerPoint Templates because it demonstrates to your audience how the best and most refined ideas pass through. Present our Arrows PowerPoint Templates because you can Educate your listeners on the means to keep it ticking over. Present our Shapes PowerPoint Templates because this diagram depicts the essence of this chain reaction like sequence of events.Use these PowerPoint slides for presentations relating to 3d, Abstract, Around, Arrows, Business, Center, Circle, Circular, Concept, Connections, Curve, Cycle, Directions, Distribution, Illustration, Management, Middle, Objects, Plan, Process, Recycle, Rounded, Shadows, Space, System. The prominent colors used in the PowerPoint template are Yellow, Gray, Black. People tell us our business powerpoint presentation losses eight steps flow chart Slides provide great value for your money. Be assured of finding the best projection to highlight your words. PowerPoint presentation experts tell us our Circle PowerPoint templates and PPT Slides are Lush. Presenters tell us our business powerpoint presentation losses eight steps flow chart Slides are Nifty. The feedback we get is that our Circle PowerPoint templates and PPT Slides are Multicolored. You can be sure our business powerpoint presentation losses eight steps flow chart Slides are Romantic. Professionals tell us our Center PowerPoint templates and PPT Slides are Elegant.

PowerPoint Templates Losses Eight Steps Online Flow Chart Maker
We present our powerpoint templates losses eight steps online flow chart maker.Download our Success PowerPoint Templates because it is inspired by the indelible Olympic logo this graphic exemplifies the benefits of teamwork. Download our Business PowerPoint Templates because you have churned your mind and come upwith solutions. Use our Shapes PowerPoint Templates because you have good reasons to back up the strength of your belief. Download our Process and Flows PowerPoint Templates because it has inspired a whole new world of medical endeavour. Present our Arrows PowerPoint Templates because you can present your opinions in this field using our impressive templates.Use these PowerPoint slides for presentations relating to 3d, Abstract, Around, Arrows, Business, Center, Circle, Circular, Concept, Connections, Curve, Cycle, Directions, Distribution, Illustration, Management, Middle, Objects, Plan, Process, Recycle, Rounded, Shadows, Space, System. The prominent colors used in the PowerPoint template are Green, Gray, Black. People tell us our powerpoint templates losses eight steps online flow chart maker are Beautiful. PowerPoint presentation experts tell us our Business PowerPoint templates and PPT Slides are Fun. Presenters tell us our powerpoint templates losses eight steps online flow chart maker are Great. The feedback we get is that our Concept PowerPoint templates and PPT Slides are Flirty. You can be sure our powerpoint templates losses eight steps online flow chart maker are Attractive. Professionals tell us our Center PowerPoint templates and PPT Slides are Awesome.

1 Year Planning Gantt Chart PowerPoint Slides Gantt Ppt Templates
Blue Text Box For Defining Quote Radial Chart PowerPoint Templates
We present our blue text box for defining quote Radial Chart PowerPoint templates.Present our Business PowerPoint Templates because your ideas too are pinpointedly focused on you goals. Download and present our Boxes PowerPoint Templates because you require care and diligence to function well. Use our Shapes PowerPoint Templates because it has inspired a whole new world of medical endeavour. Use our Finance PowerPoint Templates because let this slide illustrates others piggyback on you to see well over the horizon. Download and present our Signs PowerPoint Templates because you can Employ the right colours for your brilliant ideas.Use these PowerPoint slides for presentations relating to Banner, Blank, Blue, Color, Design, Element, Empty, Frame, Glossy, Glow, Graphic, Green, Illustration, Label, Message, New, Offer, Orange, Page, Set, Shape, Shiny, Site, Style, Symbol, Template, Text, Vector, Web, Website. The prominent colors used in the PowerPoint template are Blue, Red, Black. We assure you our blue text box for defining quote Radial Chart PowerPoint templates are Flirty. Customers tell us our Empty PowerPoint templates and PPT Slides effectively help you save your valuable time. The feedback we get is that our blue text box for defining quote Radial Chart PowerPoint templates are Gorgeous. We assure you our Element PowerPoint templates and PPT Slides are Classic. People tell us our blue text box for defining quote Radial Chart PowerPoint templates are designed by professionals We assure you our Blue PowerPoint templates and PPT Slides are Exuberant.

Business Diagram Examples PowerPoint Presentations Process Chart Templates
We present our business diagram examples powerpoint presentations process chart templates.Download our Advertising PowerPoint Templates because you can Adorn them with your ideas and thoughts. Download our Business PowerPoint Templates because maximising sales of your product is the intended destination. Use our Marketing PowerPoint Templates because The marketplace is the merger of your dreams and your ability. Download our Finance PowerPoint Templates because you have a handle on all the targets, a master of the game, the experienced and consummate juggler. Present our Shapes PowerPoint Templates because this is Aesthetically designed to make a great first impression this template highlights .Use these PowerPoint slides for presentations relating to Analysis, Business, Concept, Design, Diagram, Direction, Goals, Guide, Icon, Idea, Management, Model, Opportunity, Organization, Performance, Plan, Process, Project, Representation, Resource, Strategy, Swot. The prominent colors used in the PowerPoint template are Blue, Black, Gray. PowerPoint presentation experts tell us our business diagram examples powerpoint presentations process chart templates are Efficacious. Professionals tell us our Diagram PowerPoint templates and PPT Slides are Endearing. People tell us our business diagram examples powerpoint presentations process chart templates provide great value for your money. Be assured of finding the best projection to highlight your words. We assure you our Diagram PowerPoint templates and PPT Slides are Attractive. PowerPoint presentation experts tell us our business diagram examples powerpoint presentations process chart templates are Graceful. Professionals tell us our Direction PowerPoint templates and PPT Slides are Splendid.
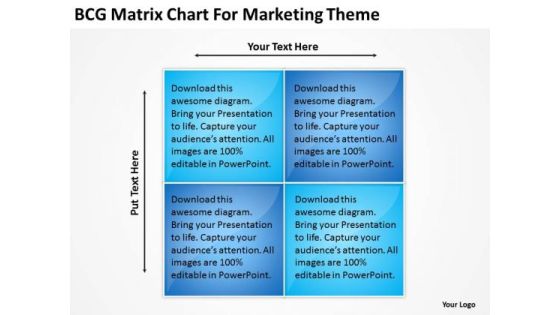
Bcg Matrix Chart For Marketing Theme Business Plan PowerPoint Slides
Drum out your message on our bcg matrix chart for marketing theme business plan PowerPoint Slides. It will be heard by all far and wide. Up the ante with our Boxes Powerpoint templates. Drum it up to a crescendo. However dry your topic maybe. Make it catchy with our Process and Flows Powerpoint templates.

Maintain Matrix Chart For Business Results Plan Sample PowerPoint Slides
Blend your views with our maintain matrix chart for business results plan sample PowerPoint Slides. They are made for each other. Our Boxes Powerpoint templates are duly appointed. They have all the facets you require. There is no subject too dull for our Process and Flows Powerpoint templates. They will always generate keenness.

Consulting PowerPoint Template Compare And Contrast Chart Business Strategy Slides
When in doubt use our consulting PowerPoint template compare and contrast chart business strategy Slides. The way ahead will become crystal clear. With our Leadership PowerPoint Templates you will be doubly sure. They possess that stamp of authority. Our Finance PowerPoint Templates do it in double quick time. Speed up the process in a tangible way.
Business Sales Chart PowerPoint Templates Ppt Backgrounds For Slides 0513
Doll up your thoughts with our Business Sales Chart PowerPoint Templates PPT Backgrounds For Slides. They will make a pretty picture. They say a dog is man's best friend. Our marketing PowerPoint Templates come a close second. Establish the dominance of your ideas. Our business PowerPoint Templates will put them on top.

Business Pie Chart PowerPoint Templates Ppt Backgrounds For Slides 0613
Brace yourself, arm your thoughts. Prepare for the hustle with our Business Pie Chart PowerPoint Templates PPT Backgrounds For Slides. Generate ecstasy with our business PowerPoint Templates. Your thoughts will delight your audience. Delight them with our people PowerPoint Templates. Your audience will be ecstatic.
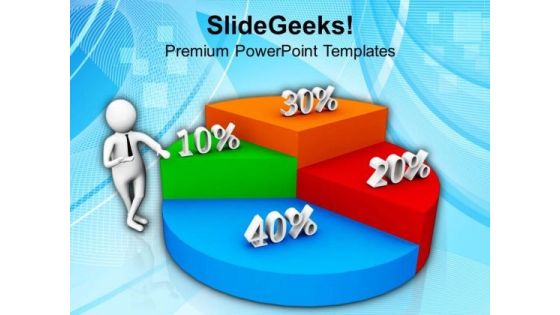
Business Growth Chart PowerPoint Templates Ppt Backgrounds For Slides 0813
Our Business Growth Chart PowerPoint Templates PPT Backgrounds For Slides deliver at your doorstep. Let them in for a wonderful experience. Dig out the dope with our Finance PowerPoint Templates. Your thoughts will expose the truth. Knock on the door to success with our People PowerPoint Templates. Be assured of gaining entry.
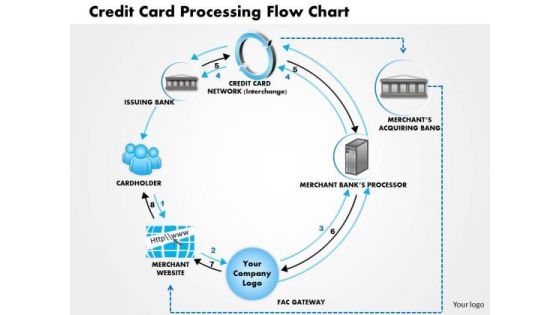
Business Framework Credit Card Processing Flow Chart PowerPoint Presentation
This innovative image slide has been designed to depict credit card processing flow chart. This business framework template may be used in banking presentations to express view on process of money transaction through credit card. This image slide will enhance the quality of your presentations.
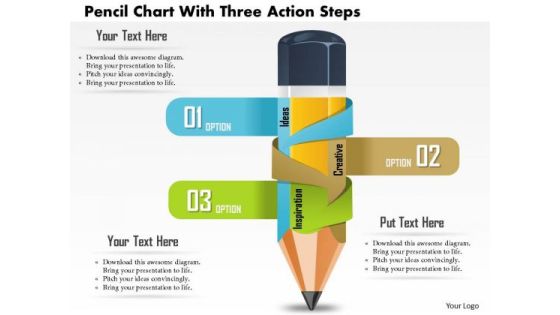
Business Diagram Pencil Chart With Three Action Steps Presentation Template
This image slide displays diagram of pencil chart with three action step. This image slide depicts one colorful pencil with three editable text options on it. Use this PowerPoint template, in your presentations to express ideas in business or may be used in education or learning presentations. This image slide will make your presentations colorful.

Business Diagram Swim Lane Process Flow Chart Presentation Template
This image slide displays diagram of swim lane process flow chart. This image slide has been made with swim lane flowchart that visually distinguishes responsibilities for sub-processes of a business process. Use this PowerPoint template, in your presentations to express views on growth, target, management and planning in any business. This image slide will make your presentations eye-catching.

Business Diagram Charts On Smartphone Modern Info Graphic Presentation Template
This image slide displays charts on smartphone with modern info graphic. This image slide depicts info graphic. Use this PowerPoint template, in your presentations to express various business views on achievements and targets or population related presentations. This image slide will help you reach the target audience.

Business Diagram Flow Chart For Order Processing Presentation Template
This image slide displays Business consulting diagram flow chart with text boxes. The text boxes in this image slide are editable. This image slide depicts order processing. Use this PowerPoint template, in your presentations to explain order processing in any business. This image slide will make your presentations precise.
Business Diagram Four Staged Comparative Chart Diagram Presentation Template
This business diagram has been designed with four staged comparative chart. This slide suitable for data representation. You can also use this slide to present four steps of any business process. Use this diagram to present your views in a wonderful manner.

Business Diagram Six Staged Comparative Chart Diagram Presentation Template
This business diagram has been designed with six staged comparative chart. This slide suitable for data representation. You can also use this slide to present four steps of any business process. Use this diagram to present your views in a wonderful manner.
Business Diagram Pie Chart With Icons For Finance Presentation Template
Our professionally designed business diagram is as an effective tool for communicating business ideas and strategies for corporate planning. It contains graphics of pie chart with icons. Convey your views with this diagram slide. It will amplify the strength of your logic.
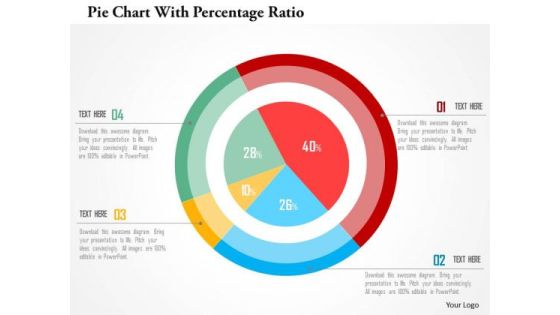
Business Diagram Pie Chart With Percentage Ratio Presentation Template
Our professionally designed business diagram is as an effective tool for communicating business ideas and strategies for corporate planning. It contains graphics of pie chart with percentage ratio. Convey your views with this diagram slide. It will amplify the strength of your logic.
Four Level Circles Flow Chart With Icons Powerpoint Template
Visually support your presentation with our above template containing graphic of circles flow chart with icons. This Powerpoint template helps to portray concepts like teamwork, planning and management. Etch your views in the brains of your audience with this diagram slide.
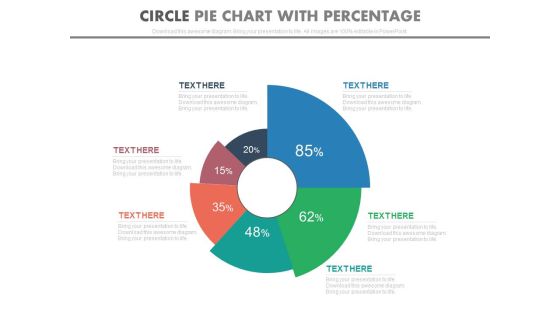
Pie Chart With Increasing Percentage Values Powerpoint Slides
This PowerPoint template has been designed with diagram of pie chart with increasing percentage values. This PPT slide can be used to prepare presentations for profit growth report and also for financial data analysis. You can download finance PowerPoint template to prepare awesome presentations.
Five Points Vertical Chart For Business Agenda Powerpoint Slides
This PowerPoint template has been designed with five point?s vertical chart. Download this PPT slide to depict list of items that are to be discussed in a meeting. The structure of our template allows you to effectively highlight the key issues concerning to your agenda.

Three Teams Skill Analysis Comparison Chart Powerpoint Slides
Create visually stunning and define your PPT presentations in a unique and inspiring manner using our above template. It contains graphics of comparison chart. This business slide helps to display teams skill analysis. Deliver amazing presentations to mesmerize your audience by using this PPT slide design.
Six Staged Pie Chart And Icons Diagram Powerpoint Template
Our above PPT slide has been designed with graphics of pie chart and icons. This PowerPoint template is suitable to present strategic management for business growth. Use this business diagram to present your work in a more smart and precise manner.

Chart Of Careers In Finance Ppt Sample Presentations
This is a chart of careers in finance ppt sample presentations. This is a ten stage process. The stages in this process are investment banking, fund management, trading, insurance, actuarial, compliance and risk, corporate law, management consultancy, accountancy and tax, retail banking, finance careers.

Business Planning And Evaluation Cycle Chart Ppt Templates
This is a business planning and evaluation cycle chart ppt templates. This is a four stage process. The stages in this process are understand what?s changed, determine how to adapt your model, implement your, changes, review your success, operational, social environmental impact, internal, factors, external factors.

Cash flow And Financial Independence Process Flow Chart Ppt Sample
This is a cash flow and financial independence process flow chart ppt sample. This is a five stage process. The stages in this process are risk management, business and benefits, cash flow and financial independence, investment planning, tax strategies, legacy and estate.
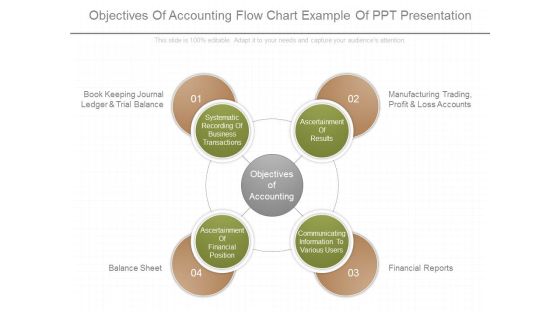
Objectives Of Accounting Flow Chart Example Of Ppt Presentation
This is a objectives of accounting flow chart example of ppt presentation. This is a four stage process. The stages in this process are book keeping journal ledger and trial balance, manufacturing trading profit and loss accounts, balance sheet, financial reports, systematic recording of business transactions, ascertainment of results, ascertainment of financial position, communicating information to various users, objectives of accounting.

Product Management Success Chart Sample Of Ppt Presentation
This is a product management success chart sample of ppt presentation. This is a four stage process. The stages in this process are sales driven, market driven, competitor driven, customer driven, technology driven, path to profitability, customer satisfaction, unit sales growth.

Reputation Marketing Strategy Chart Sample Of Ppt Presentation
This is a reputation marketing strategy chart sample of ppt presentation. This is a four stage process. The stages in this process are sales strategies, monitor and engage, educate and inspire, get reviews, market reputation, manage reputation, create culture, build the reputation.
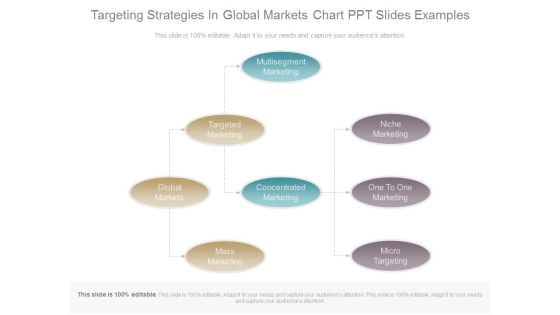
Targeting Strategies In Global Markets Chart Ppt Slides Examples
This is a targeting strategies in global markets chart ppt slides examples. This is a three stage process. The stages in this process are multisegment marketing, targeted marketing, global markets, concentrated marketing, mass marketing, niche marketing, one to one marketing, micro targeting.

Methods For Customer Satisfaction Charts Of Ppt Presentation
This is a methods for customer satisfaction charts of ppt presentation. This is a eight stage process. The stages in this process are perceived value for price paid, customer expectation, perceived image, customer satisfaction, increased profitability, increased market share, perceived quality, customer loyalty.
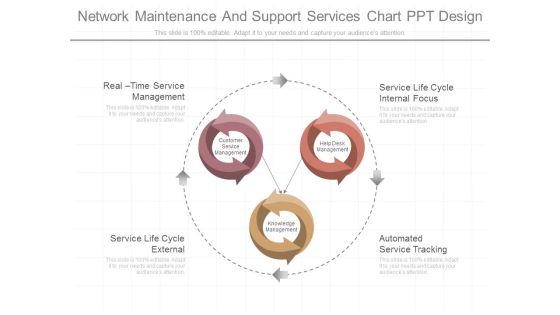
Network Maintenance And Support Services Chart Ppt Design
This is a network maintenance and support services chart ppt design. This is a four stage process. The stages in this process are real time service management, service life cycle external, service life cycle internal focus, automated service tracking, customer service management, help desk management, knowledge management.

Flow Chart For It Operation Diagram Presentation Background Images
This is a flow chart for it operation diagram presentation background images. This is a five stage process. The stages in this process are customer expectations, management perceptions of customer expectations, customer perceptions, service delivery, service standard, managing the evidence, understanding, the customer, services design, conformance.
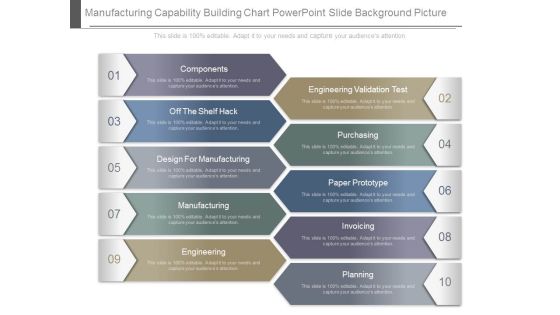
Manufacturing Capability Building Chart Powerpoint Slide Background Picture
This is a manufacturing capability building chart powerpoint slide background picture. This is a ten stage process. The stages in this process are components, off the shelf hack, design for manufacturing, manufacturing, engineering, engineering validation test, purchasing, paper prototype, invoicing, planning.
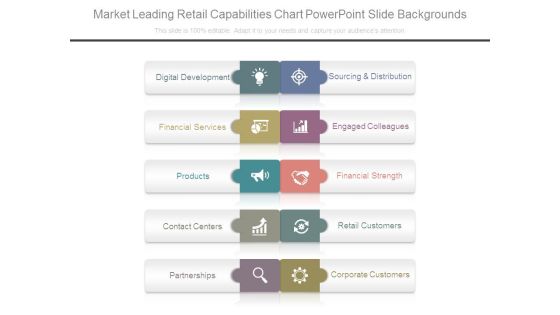
Market Leading Retail Capabilities Chart Powerpoint Slide Backgrounds
This is a market leading retail capabilities chart powerpoint slide backgrounds. This is a five stage process. The stages in this process are digital development, financial services, products, contact centers, partnerships, sourcing and distribution, engaged colleagues, financial strength, retail customers, corporate customers.
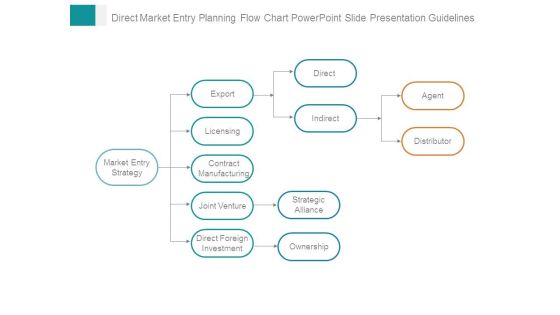
Direct Market Entry Planning Flow Chart Powerpoint Slide Presentation Guidelines
This is a direct market entry planning flow chart powerpoint slide presentation guidelines. This is a four stage process. The stages in this process are market entry strategy, export, licensing, contract manufacturing, joint venture, direct foreign investment, direct, indirect, strategic alliance, ownership, agent, distributor.

Organizational Chart Behavioral Segmentation Powerpoint Slide Presentation Examples
This is a organizational chart behavioral segmentation powerpoint slide presentation examples. This is a six stage process. The stages in this process are target market, aware, unaware, tried, not tried, repeated, not yet repeated, rejecter, favorable opinion, neutral, negative opinion, loyal to brand, switcher, loyal to other brand, heavy user, regular user, light user.

Flow Chart Market Entry Planning Example Ppt Presentation
This is a flow chart market entry planning example ppt presentation. This is a four stage process. The stages in this process are market entry strategy, export, licensing, contract manufacturing, joint venture, direct foreign investment, indirect, direct, agent, distributor, strategic alliance, ownership.

Loop Chart For Process Mapping Powerpoint Slide Deck Samples
This is a loop chart for process mapping powerpoint slide deck samples. This is a ten stage process. The stages in this process are issue order, process order, requested deposit, deposit, cancel order, refund order, complete order, requested submit order, deliver goods, re submit order.

Six Sigma Circular Chart With Down Arrows Powerpoint Slide Images
This is a six sigma circular chart with down arrows powerpoint slide images. This is a five stage process. The stages in this process are recognize, realize, measure, define, analyze, improve, control, voice of customer and voice of process, practical problem, statistical problem, statistical solution, practical solution, control plan, result.
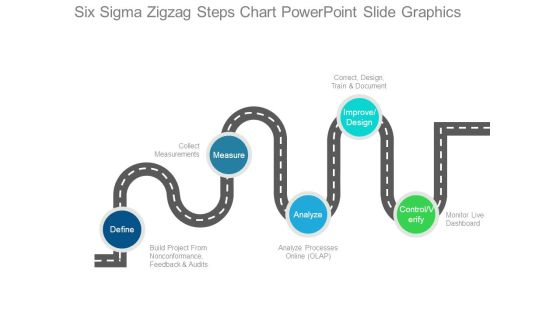
Six Sigma Zigzag Steps Chart Powerpoint Slide Graphics
This is a six sigma zigzag steps chart powerpoint slide graphics. This is a five stage process. The stages in this process are define, build project from nonconformance feedback and audits, collect measurements, measure, analyze, analyze processes online olap, improve design, correct design train and document, monitor live dashboard, control verify.

Market Size Analysis Pie Charts Ppt Background Images
This is a market size analysis pie charts ppt background images. This is a three stage process. The stages in this process are in team of users, in team of revenue from customers, target market, we are planning to acquire users first and then paid customer, advertisers, event organizers, mentors.
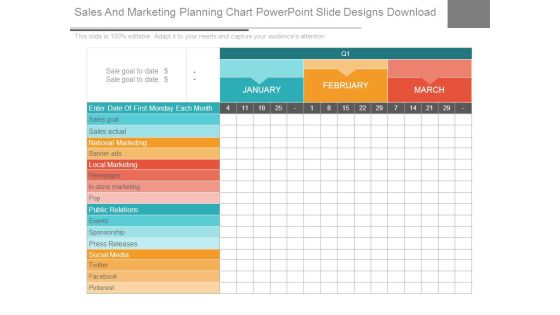
Sales And Marketing Planning Chart Powerpoint Slide Designs Download
This is a sales and marketing planning chart powerpoint slide designs download. This is a three stage process. The stages in this process are sales goal, sales actual, national marketing, banner ads, local marketing, newspaper, in store marketing, pop, public relations, events, sponsorship, press releases, social media, twitter, facebook.
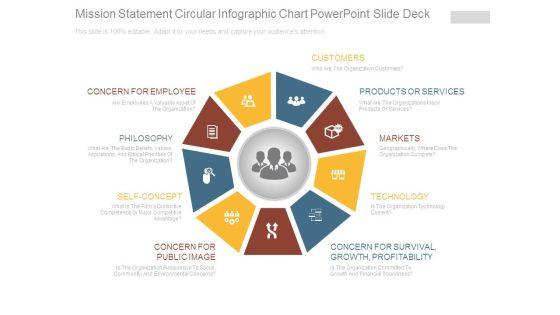
Mission Statement Circular Infographic Chart Powerpoint Slide Deck
This is a mission statement circular infographic chart powerpoint slide deck. This is a nine stage process. The stages in this process are customers, products or services, markets, technology, concern for survival growth profitability, concern for public image, self concept, philosophy, concern for employee.

Calculating Customer Lifetime Value Clv Chart Powerpoint Templates
This is a calculating customer lifetime value clv chart powerpoint templates. This is a five stage process. The stages in this process are complete clv year, average acquisition cost, average customer revenue, average customer costs, average customer profit, customer retention rate, cumulative retention rate, likely customer profit, discount rate, clv per year, cumulative clv.

Financials Base Plan Table Chart Ppt Slide Templates
This is a financials base plan table chart ppt slide templates. This is a five stage process. The stages in this process are kpi, revenue, cost of sales, gross profit, customer acquisition cost, other operating cost expense, operating profit, change in cash, ending cash, employees ftes.
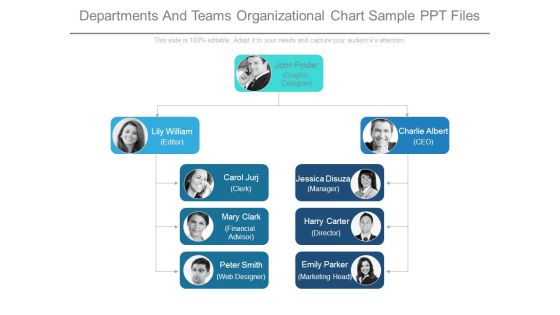
Departments And Teams Organizational Chart Sample Ppt Files
This is a departments and teams organizational chart sample ppt files. This is a three stage process. The stages in this process are john finder graphic designer, lily william editor, charlie albert ceo, carol jurj clerk, jessica disuza manager, mary clark financial advisor, harry carter director, peter smith web designer, emily parker marketing head.
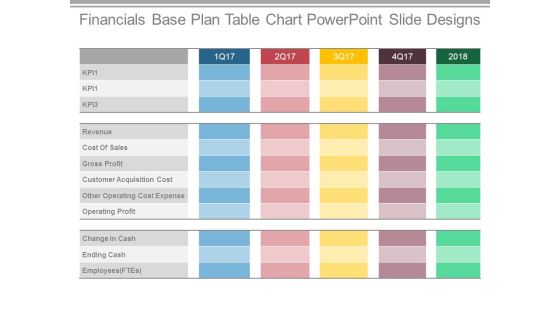
Financials Base Plan Table Chart Powerpoint Slide Designs
This is a financials base plan table chart powerpoint slide designs. This is a five stage process. The stages in this process are revenue, cost of sales, gross profit, customer acquisition cost, other operating cost expense, operating profit, change in cash, ending cash.

Customer Lifetime Value Analysis Chart Example Of Ppt Presentation
This is a customer lifetime value analysis chart example of ppt presentation. This is a three stage process. The stages in this process are inactive nonprofit able customer, active profitable customers, very active very profitable customers, lifetime value, average order value, number of repeat sales, average retention time.

Pie Charts For Lead Scoring Ppt Background Template
This is a pie charts for lead scoring ppt background template. This is a six stage process. The stages in this process are measurable roi on lead generation program, increased conversion rates from qualified lead to opportunity, increased sales productivity and effectiveness, better alignment of marketing and sales efforts, better forecast and pipeline visibility, shortened sales cycle.
