AI PPT Maker
Templates
PPT Bundles
Design Services
Business PPTs
Business Plan
Management
Strategy
Introduction PPT
Roadmap
Self Introduction
Timelines
Process
Marketing
Agenda
Technology
Medical
Startup Business Plan
Cyber Security
Dashboards
SWOT
Proposals
Education
Pitch Deck
Digital Marketing
KPIs
Project Management
Product Management
Artificial Intelligence
Target Market
Communication
Supply Chain
Google Slides
Research Services
 One Pagers
All Categories
-
Home
- Customer Favorites
- Bar Graph
Bar Graph
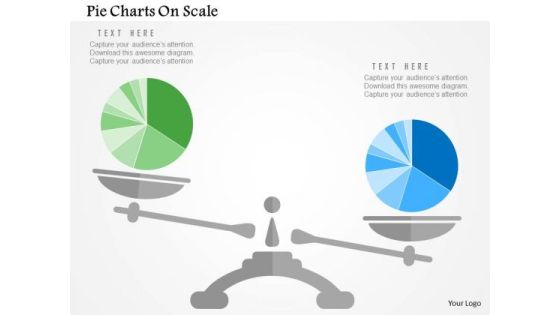
Business Diagram Pie Charts On Scale Presentation Template
Our above slide display graphics of pie chart on a scale. Download this diagram slide to display competitive analysis of business. Adjust the above diagram in your business presentations to visually support your content.
Business Diagram Icons Around Pie Chart Presentation Template
Strategy and planning can be displayed with this business diagram. This slide contains the graphic of icons around pie chart Use this editable slide to build quality presentation for your viewers.
Business Diagram Icons And Charts For Business Growth Presentation Template
Our above slide contains graphics of business charts and icons. It helps to display business reports and analysis. Use this diagram to impart more clarity to data and to create more sound impact on viewers.

Business Diagram Matrix Chart For Financial Review Presentation Template
Our above business diagram has been designed with graphics of matrix chart. This slide is suitable to present financial review. Use this business diagram to present your work in a more smart and precise manner.
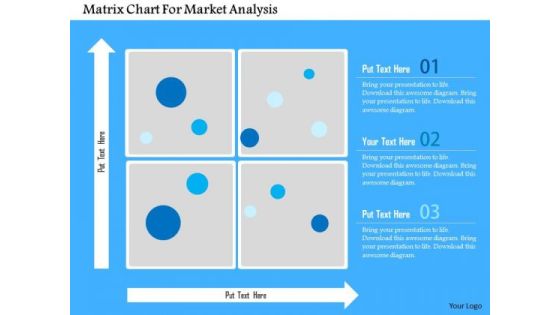
Business Diagram Matrix Chart For Market Analysis Presentation Template
This slide has been designed with graphics of matrix chart. This diagram is suitable to present market analysis. This professional slide helps in making an instant impact on viewers.

Pie Chart For Financial Ratio Analysis PowerPoint Template
Deliver amazing presentations with our above template showing pie chart. You may download this slide to display financial ratio analysis. Capture the attention of your audience using this diagram.

Pie Chart On Magnifying Glass For Business Analysis PowerPoint Template
Visually support your presentation with our above template showing pie chart on magnifying glass. This slide has been professionally designed to emphasize the concept of market research and analysis. Deliver amazing presentations to mesmerize your audience.

Three Ponits Chart For Demand Management Process PowerPoint Template
Demand management process can be displayed with this business diagram. It contains graphics of chart with three points. Present your views using this innovative slide and be assured of leaving a lasting impression.
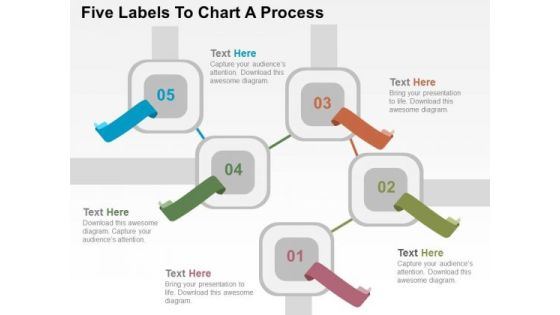
Five Labels To Chart A Process PowerPoint Templates
Our above slide contains graphics of five labels. This PPT label graphics may be used to chart a business process. The Powerpoint Templates can be customized as per requirements of business education or any other theme.
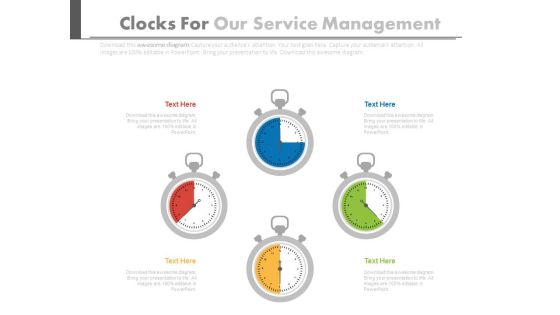
Four Stopwatches In Pie Chart Style Powerpoint Slides
This PPT slide has been designed with graphics of four stop watches in pie chart style. You may sue this PowerPoint template for time management. This dashboard slide may useful for multilevel status report creation and approval process.
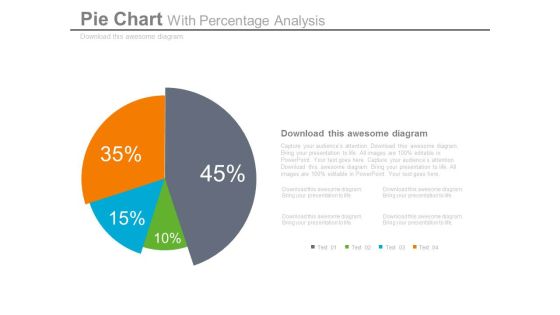
Pie Chart Dashboard Style For Percentage Analysis Powerpoint Slides
This dashboard PPT template contains graphics of pie chart. This dashboard PowerPoint template helps to display percentage analysis in a visual manner. Download this PPT slide for quick decision-making.
Pie Chart With Icons For Business Analysis Powerpoint Slides
This dashboard template contains graphics of pie chart with icons. This dashboard PowerPoint template helps to display business analysis in a visual manner. Download this template to make impressive presentations.
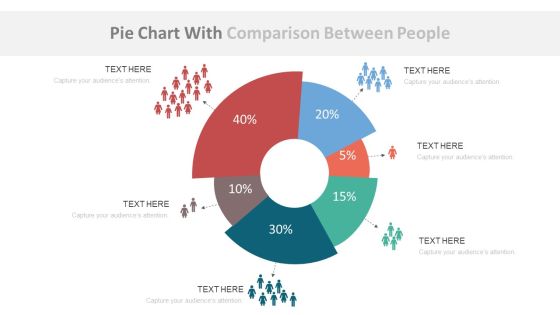
Pie Chart With Population Ratio Analysis Powerpoint Slides
This dashboard template contains graphics of pie chart with icons. This dashboard PowerPoint template helps to display population ratio analysis in a visual manner. Download this template to make impressive presentations.
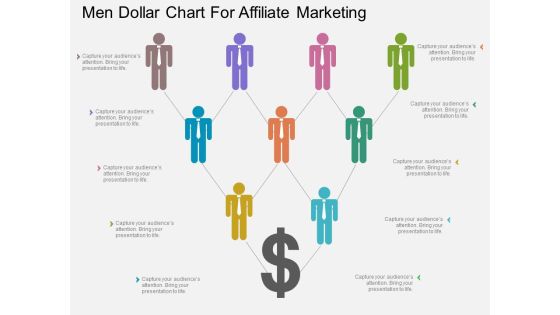
Men Dollar Chart For Affiliate Marketing Powerpoint Template
This PowerPoint template has been designed with dollar men dollar symbol chart. This business diagram helps to exhibit affiliate marketing. Download this diagram slide to build an exclusive presentation.
Pie Chart With Food And Health Icons Powerpoint Template
Our above business slide contains pie chart with food and health icons. This PowerPoint slide may be used to exhibit healthy diet plan. Capture the attention of your audience with this slide.

Gears With Arrows Activity Flow Chart Powerpoint Template
This PowerPoint slide contains gears arrow business design. This professional slide may be used as activity flow chart. Use this template to highlight the key issues of your presentation.
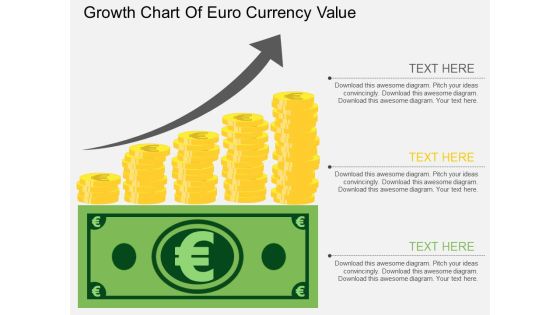
Growth Chart Of Euro Currency Value Powerpoint Template
The above PPT template displays growth chart of Euro currency. This diagram helps to exhibit Euro currency value growth. Adjust the above diagram in your business presentations to visually support your content.
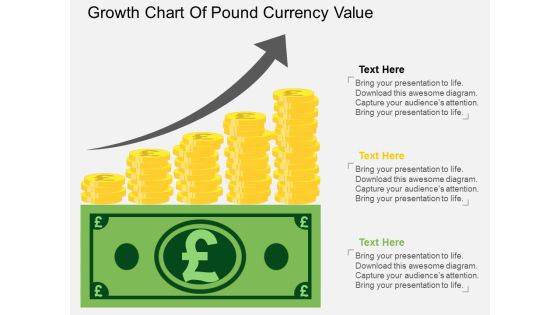
Growth Chart Of Pound Currency Value Powerpoint Template
The above PPT template displays growth chart of Pound currency. This diagram helps to exhibit Pound currency value growth. Adjust the above diagram in your business presentations to visually support your content.

Infographic Chart For Business Management Strategy Powerpoint Template
Our above PPT slide contains business infographic chart. This PowerPoint template helps to steps of business management strategy. Use this diagram to impart more clarity to subject and to create more sound impact on viewers.

Pie Gear Chart For Financial Ratio Analysis Powerpoint Templates
This PPT slide displays diagram of pie gear chart. This PowerPoint template has been designed to exhibit financial ratio analysis. You can present your opinions using this impressive slide

Abc Steps Chart For Data Analysis Powerpoint Slides
Our above PPT slide contains graphics of ABC steps chart. This business diagram helps to depict business information for strategic management. Use this diagram to impart more clarity to data and to create more sound impact on viewers.
Five Staged Process Chart And Icons Powerpoint Template
Develop competitive advantage with our above template which contains a five staged process chart with icons. This diagram provides an effective way of displaying business information. You can edit text, color, shade and style as per you need.

Human Brain With Bulb And Business Chart Powerpoint Template
This PowerPoint template has been designed with graphics of human brain with bulb and business chart. This diagram can be used to display creative thinking in business. Capture the attention of your audience with this slide.
Pencil Arrows Flow Chart With Icons Powerpoint Template
Visually support your presentation with our above template containing pencil arrows flow chart. This slide has been professionally designed to present strategic management. This template offers an excellent background to build impressive presentation.

Circular Arrow Chart With Business Icons Powerpoint Slides
Graphics of circular arrow chart with icons have been displayed in this business slide. This business diagram helps to exhibit strategy analysis and management. Use this PowerPoint template to visually support your content.

Circle Chart For Business Strategy Plan Powerpoint Slides
This PowerPoint template has been designed with four steps circle chart with finance icons. This PPT slide can be used to display business strategy plan. You can download finance PowerPoint template to prepare awesome presentations.

Funnel Chart For Joint Venture Marketing Powerpoint Slides
This PowerPoint template has been designed with graphics of funnel chart. This PPT slide can be used to display joint venture marketing. You can download finance PowerPoint template to prepare awesome presentations.

Percentage Chart For Good Marketing Strategy Powerpoint Slides
This PowerPoint template has been designed with pie chart and percentage values. The PowerPoint template has a high quality design. You can download this PowerPoint slide to make good marketing strategy and business plans.

Pie Chart For Financial Planning And Evaluation Powerpoint Slides
This PowerPoint template has been designed with diagram of pie chart. This PPT slide can be used to prepare presentations for financial planning and evaluation. You can download finance PowerPoint template to prepare awesome presentations.
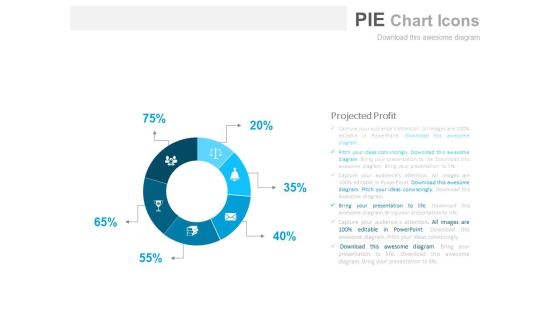
Pie Chart For Projected Profit Report Powerpoint Slides
This PowerPoint template has been designed with diagram of pie chart. This PPT slide can be used to prepare presentations for projected profit report. You can download finance PowerPoint template to prepare awesome presentations.
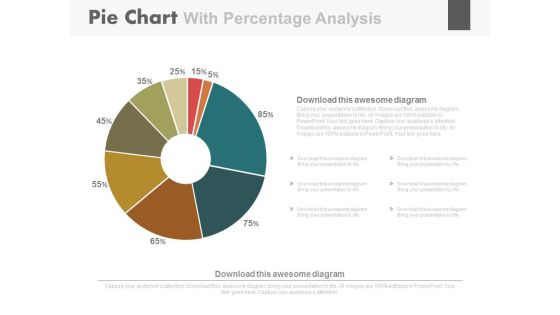
Pie Chart For Strategic Sales Plan Powerpoint Slides
This PowerPoint template has been designed with diagram of pie chart. This PPT slide can be used to prepare presentations on strategic sales plan. You can download finance PowerPoint template to prepare awesome presentations.

Pie Charts For Financial Ratio Analysis Powerpoint Slides
This PowerPoint template has been designed with diagram of pie charts. This PPT slide can be used to prepare presentations for profit growth report and also for financial data analysis. You can download finance PowerPoint template to prepare awesome presentations.
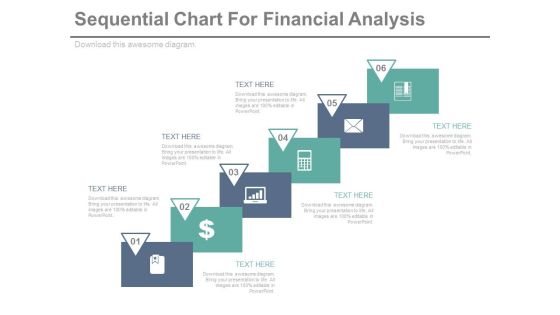
Sequential Steps Chart For Data Analysis Powerpoint Slides
This PowerPoint template has been designed sequential steps chart with icons. This PPT slide can be used to display corporate level financial strategy. You can download finance PowerPoint template to prepare awesome presentations.

Six Steps Funnel Chart For Business Powerpoint Slides
This PowerPoint template has been designed with professional graphics of funnel chart. This PPT slide can be used to display steps of sales process. You can download finance PowerPoint template to prepare awesome presentations.

Target Chart For Strategic Management Process Powerpoint Slides
This PowerPoint template has been designed with four steps target chart. The PowerPoint template may be used to display strategic management process. You can download this PowerPoint slide for corporate presentations or annual meeting and business plans.

Venn Business Chart With Percentage Value Powerpoint Template
This PPT slide contains Venn business chart with percentage values. This PPT diagram is suitable to present data comparison and analysis. Enlighten others on the process with this innovative PowerPoint template.
Four Pie Charts With Business Icons Powerpoint Templates
This PowerPoint template has been designed with four pie charts and icons. This diagram is suitable for sales and marketing presentations. This professional slide helps in making an instant impact on viewers.
Six Staged Business Chart With Icons Powerpoint Template
Our professionally designed business diagram is as an effective tool for communicating ideas and planning. It contains circular business chart with icons. Convey your views with this diagram slide. It will amplify the strength of your logic.
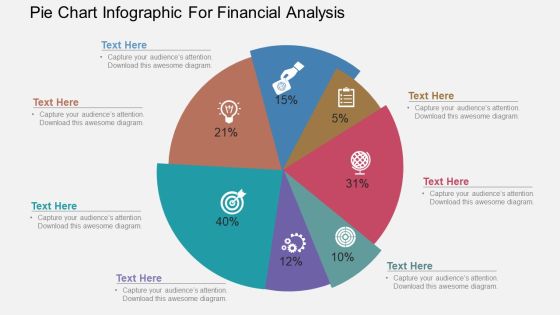
Pie Chart Infographic For Financial Analysis Powerpoint Template
Our above PowerPoint template has been designed with pie chart infographic. This slide is suitable to present financial analysis. Use this business diagram to present your work in a more smart and precise manner.

Money Growth Chart On Laptop With Mouse Powerpoint Template
This business slide displays money growth chart on laptop with mouse. This diagram is a data visualization tool that gives you a simple way to present statistical information. This slide helps your audience examine and interpret the data you present.
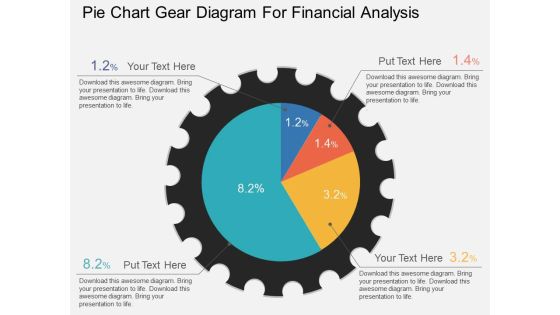
Pie Chart Gear Diagram For Financial Analysis Powerpoint Template
This PowerPoint template has been designed with graphic of pie chart gear diagram. This PPT slide can be used to display financial analysis. Download this PPT diagram slide to make your presentations more effective.

Table Chart For Balanced Scorecard Measures Powerpoint Slides
This PowerPoint template contains graphics of table chart. You may download this PPT slide design to display balanced scorecard measures. You can easily customize this template to make it more unique as per your need.

Two Table Charts For Business Data Powerpoint Slides
This PowerPoint template contains two tables chart. You may download this PPT slide to display statistical analysis. You can easily customize this template to make it more unique as per your need.
Four Steps Chart With Growth Icons Powerpoint Template
Growth planning for business can be defined with this business diagram. This slide depicts diagram of four steps chart with growth icons Present your views using this innovative slide and be assured of leaving a lasting impression

Arrow Process Chart For Market Strategy Powerpoint Template
This PowerPoint template has been designed with arrow process matrix chart. This diagram is useful to exhibit concepts related to market strategy. This diagram slide can be used to make impressive presentations.

Circular Chart With Icons For Value Chain Powerpoint Template
This PowerPoint template has been designed with circular chart and icons. This professional PPT slide is suitable to present value chain analysis. Capture the attention of your audience using this professional slide.
Sequential Chart With Financial Management Icons Powerpoint Template
This PowerPoint template has been designed with sequential chart with icons. This business slide may be used to display financial management steps. Present your views and ideas with this impressive design.
Pie Chart With Seven Business Icons Powerpoint Templates
Our compelling template consists with a design of pie chart with seven business icons. This slide has been professionally designed to exhibit financial ratio analysis. This template offers an excellent background to build impressive presentation.

Circle Arrow Chart For Corporate Level Strategies Powerpoint Template
Our above business slide has been designed with circle arrow chart. This slide is suitable to present corporate level strategy. Use this business diagram to present your work in a more smart and precise manner.

Circle Chart With Icons For Global Business Strategy Powerpoint Template
Our above PPT slide contains graphics of circle chart with icons. This business diagram helps to exhibit global business strategy. Use this diagram to impart more clarity to subject and to create more sound impact on viewers.
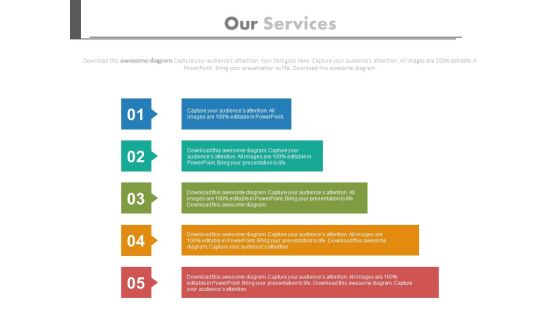
Five Steps Chart For Underlying Assumptions Powerpoint Template
Our above PPT slide contains graphics of five steps chart. This PowerPoint template helps to display steps of business management strategy. Use this diagram to impart more clarity to subject and to create more sound impact on viewers.

Four Arrows Circle Chart Process Strategy Powerpoint Template
This PowerPoint template slide contains graphics of four arrows circle chart. This PowerPoint diagram is suitable to present strategy process steps. Download this business slide to make impressive presentations.
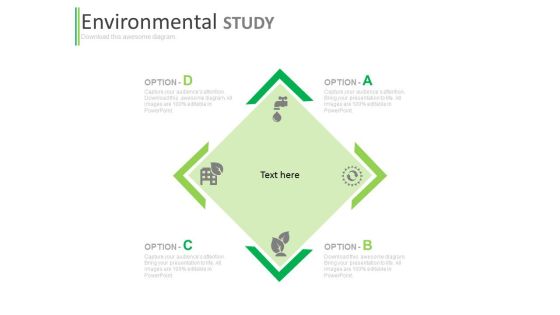
Four Options Chart For Environmental Study Powerpoint Template
Our above PPT slide contains graphics of four options chart. This PowerPoint template may be used for environmental study projects. Use this diagram to impart more clarity to subject and to create more sound impact on viewers.
Mountain Chart With Social Media Icons Powerpoint Slides
The above PPT template displays mountain chart with social media icons. This PowerPoint template has been designed to exhibit users of social media. Download this PPT slide to attract the attention of your audience.

Pie Chart For Financial Ratio Analysis Powerpoint Slides
This PPT slide contains graphics of eight stage pie chart. Download this PowerPoint template slide for financial ratio analysis. This diagram is editable you can edit text, color, shade and style as per you need.
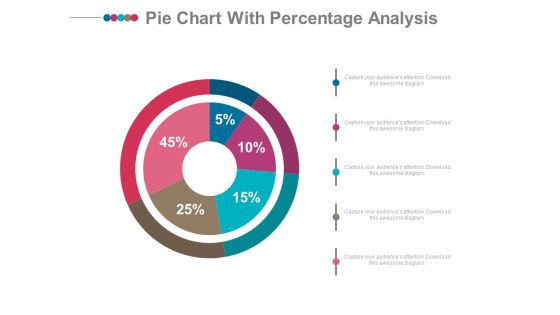
Pie Chart With Financial Data Comparison Powerpoint Slides
Emphatically define your message with our above template which contains graphics of pie chart. This PowerPoint template may be used to display financial data comparison. Grab the attention of your listeners with this slide.
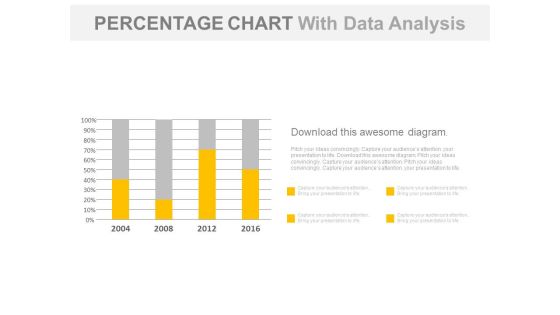
Year Based Chart With Percentage Data Analysis Powerpoint Slides
Our above business slide contains year based statistical chart. This PowerPoint template can be used to display percentage data analysis. Capture the attention of your audience with this slide.
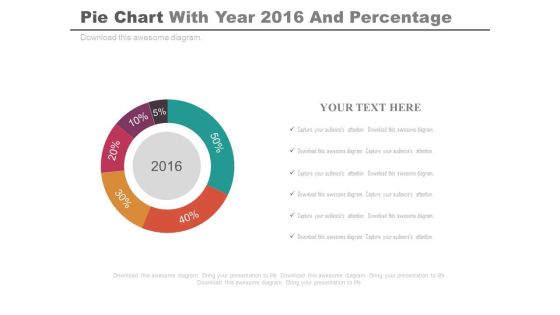
Pie Chart For Projected Profit Of 2016 Powerpoint Slides
Our above PPT slide displays graphics of Pie chart. This PowerPoint template may be used to display projected profit report of 2016. Download this template to leave permanent impression on your audience.
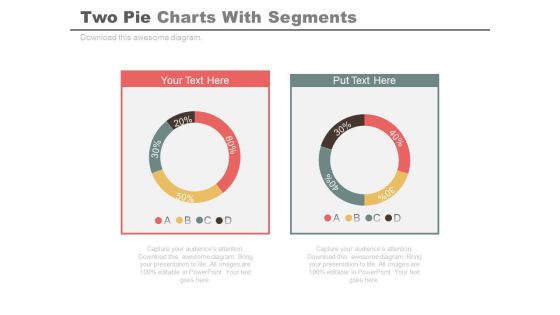
Two Pie Charts For Comparison And Analysis Powerpoint Slides
Develop competitive advantage with our above template of two pie charts. This PowerPoint diagram provides an effective way of displaying business information. You can edit text, color, shade and style as per you need.
Hexagonal Chart With Finance And Communication Icons Powerpoint Template
Our above slide contains hexagonal chart with finance and communication icons. This PowerPoint template helps to display communication steps. Use this diagram to impart more clarity to data and to create more sound impact on viewers.
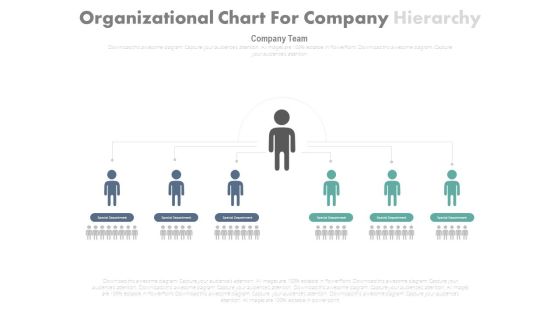
Organization Structure Chart With Two Levels Powerpoint Template
Our above business diagram has been designed with two levels organization chart. This PPT slide is suitable to present organization hierarchy. This template offers an excellent background to build impressive presentation.
Six Steps Business Chart With Icons Powerpoint Template
This PPT slide contains six steps business chart with icons. Download this diagram to display information in visual manner. Visual effect of this diagram helps in maintaining the flow of the discussion and provides more clarity to the subject.
Six Steps Spiral Chart With Business Icons Powerpoint Template
This PPT slide has been designed with graphics of six steps spiral chart with icons. This PowerPoint template is suitable to display business strategies and ideas. This professional slide helps in making an instant impact on viewers.

Circle Chart With Man And Woman Ratio Comparison Powerpoint Slides
This PowerPoint template has been designed with graphics of circle chart. You may download this PPT slide to depict man and woman ratio analysis. Add this slide to your presentation and impress your superiors.
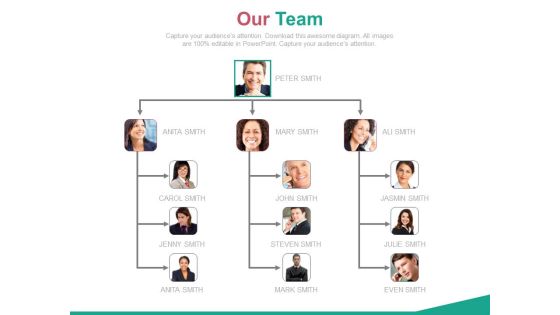
Organizational Chart For Business Intelligence Team Powerpoint Slides
Our above PowerPoint template displays an organizational chart with team pictures. This PPT slide may be used to display working of business intelligence team. You may download this PPT slide to present topics like team strategy and success.

Concentric Chart With Five Financial Steps Powerpoint Slides
This PowerPoint slide contains diagram of concentric chart with five financial steps This professional slide helps to exhibit financial planning for business. Use this PowerPoint template to make impressive presentations.

Pie Charts For Percentage Value Analysis Powerpoint Slides
Our above PPT slide displays graphics of Pie charts. This PowerPoint template may be used to display percentage value analysis. Download this template to leave permanent impression on your audience.

Data Driven Comparison Charts For Analysis Powerpoint Slides
You can download this PowerPoint template to display statistical data and analysis. This PPT slide contains data driven comparison charts. Draw an innovative business idea using this professional diagram.

Four Options Circle Chart With Percentage Powerpoint Slides
This PowerPoint template has been designed with graphics of four options circle chart. This PowerPoint template may be used to display four steps of financial analysis. Prove the viability of your ideas using this impressive slide.
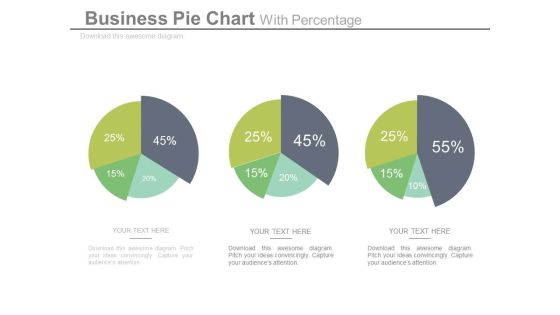
Pie Charts For Relative Comparison Study Powerpoint Slides
This power point template illustrates diagram of three pie charts with percentage values. This business slide can be used for relative comparison study. Present your views and ideas with this impressive slide.
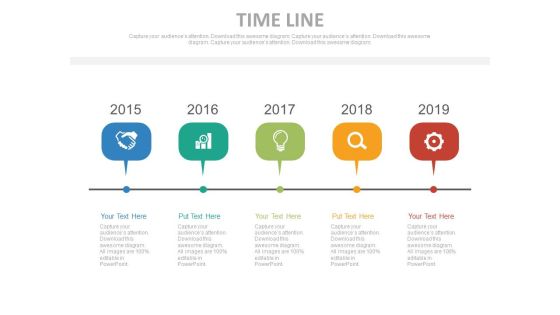
Infographic Timeline Chart For Business Process Powerpoint Slides
This PPT slide contains diagram of timeline infographic chart. This timeline template can be used to display business planning and success steps. Download this PowerPoint timeline template to make impressive presentations.
Timeline Chart With Business Growth And Success Icons Powerpoint Slides
This PowerPoint template has been designed with timeline chart. This timeline template may be used to display business growth and success. Download this PowerPoint timeline template to make impressive presentations.
Five Circles Sequential Chart With Icons Powerpoint Slides
This PowerPoint template contains sequential chart of five circles with icons. You may download this PPT slide to depict corporate vision, mission and strategy analysis. Add this slide to your presentation and impress your superiors.

Four Steps Chart For Business Planning Powerpoint Slides
Our professionally designed business diagram is as an effective tool for communicating business planning. It contains four steps charts with icons. Above slide is suitable to display process management steps.
Market Trends Chart With Percentage And Icons Powerpoint Slides
This PowerPoint template has been designed with graphics of chart with percentage values and icons. This PowerPoint template may be used to market trends and financial analysis. Prove the viability of your ideas using this impressive slide.
Six Steps Circular Chart With Icons Powerpoint Slides
This PowerPoint template has been designed with six steps circular chart with icons. This PPT slide may be used to display business and management functions. Download this slide to build unique presentation.

Skill Assessment Chart For Employee Performance Powerpoint Slides
Sliders with percentage values have been displayed in this business slide. This business diagram may be used as skill assessment chart. Download this PowerPoint template to build an exclusive presentation.

Four Employees Timeline Chart With Years Powerpoint Slides
This PowerPoint template has been designed with graphics of timeline with team pictures. You may download this timeline diagram slide to display team planning and management steps. Chart the course you intend to take with this slide.

Arrow Steps Chart For Business Success Powerpoint Template
This PowerPoint template has been designed with graphics of arrow steps chart. Download this slide for planning of financial targets. Grab the attention of your listeners with this PPT slide.

Flow Chart Of Five Business Operation Powerpoint Template
This PowerPoint template has been designed with business flow chart. You may use this PPT slide to display five operations of business management. This business diagram helps to bullet point your thoughts and ideas.

Business Team With Pie Chart For Comparison Powerpoint Template
This business slide contains graphics of pie chart with team members. This PowerPoint template is suitable to present comparison of teams performances. Use this business diagram to present your work in a more smart and precise manner.
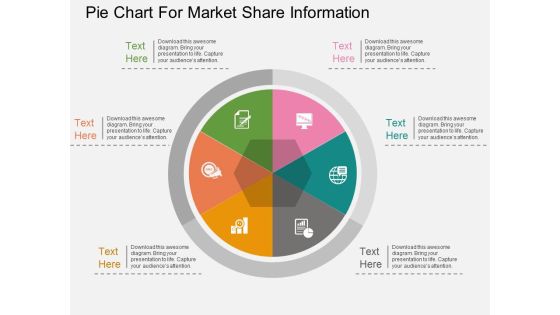
Pie Chart For Market Share Information Powerpoint Template
Our above PPT slide contains diagram of pie chart. This PowerPoint template helps to display market share information. Use this diagram to impart more clarity to information and to create more sound impact on viewers.
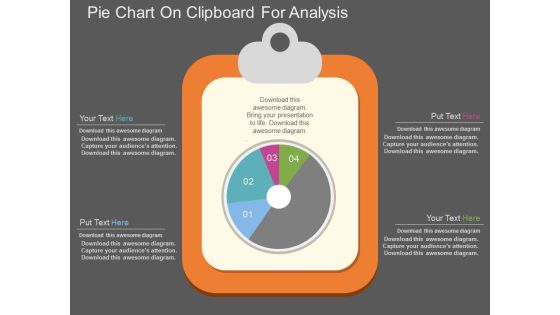
Pie Chart On Clipboard For Analysis Powerpoint Template
This PowerPoint template has been designed with graphics of pie chart on clipboard. Download this PPT slide for business and financial analysis. You may also use this professional template to depict statistical analysis.
Five Staged Semicircle Step Chart And Icons Powerpoint Template
This business slide has been designed with five staged semi circle chart and icons. This diagram is suitable to evaluate strategic planning. This professional slide helps in making an instant impact on viewers.
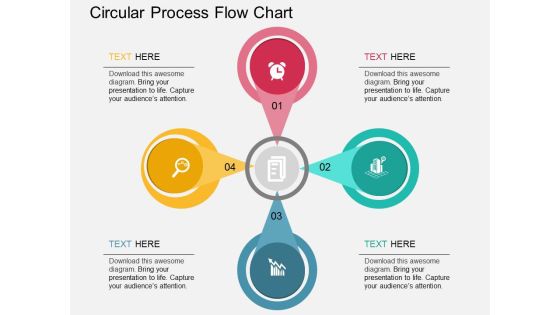
Four Staged Circular Process Flow Chart Powerpoint Template
This PowerPoint slide has been designed with graphics of four staged circular process flow chart. This diagram is designed to display four steps of option pricing. This professional slide helps in making an instant impact on viewers.
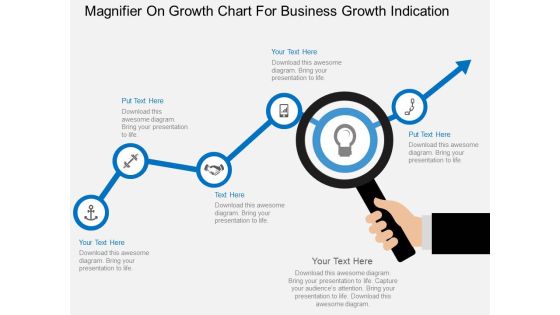
Magnifier On Growth Chart For Business Growth Indication Powerpoint Template
This business slide contains graphics of magnifier on growth chart. This PowerPoint template helps to display business planning and analysis. Use this diagram to impart more clarity to concept and to create more sound impact on viewers.

Seven Staged Circle Process Chart For Financial Planning Powerpoint Template
Our above PPT slide contains process chart with icons. This PowerPoint template may be used to display strategic planning methodology. This template is designed to attract the attention of your audience.
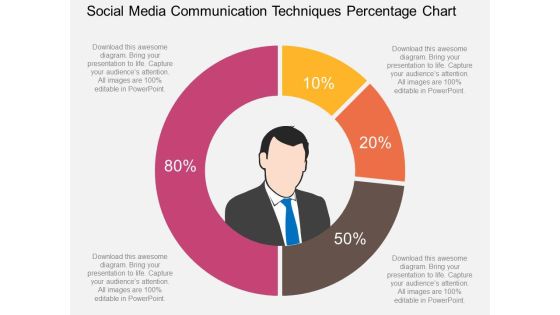
Social Media Communication Techniques Percentage Chart Powerpoint Template
This business slide displays percentage chart of social media communication techniques. Download this diagram to display information in visual manner. Visual effect of this diagram helps in maintaining the flow of the discussion and provides more clarity to the subject.
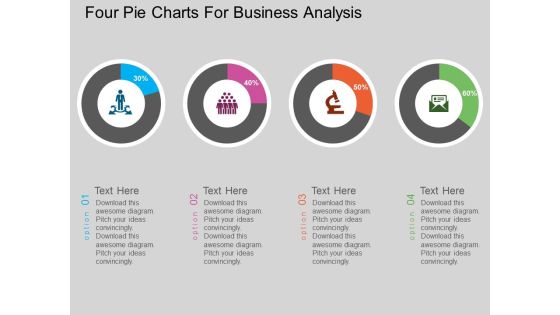
Four Pie Charts For Business Analysis Powerpoint Template
This PowerPoint template has been designed with graphics of four pie charts This diagram can be used to display financial planning and business analysis. Capture the attention of your audience with this slide.
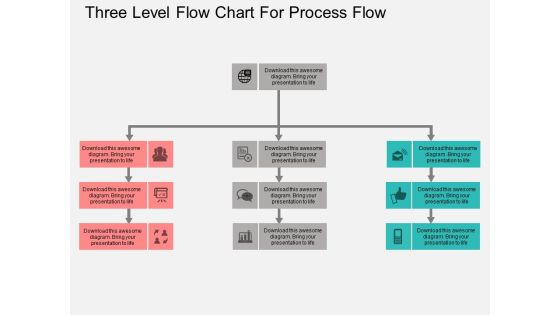
Three Level Flow Chart For Process Flow Powerpoint Template
Visually support your presentation with our above template of three level flow chart. This slide has been professionally designed to display business process flow. This template offers an excellent background to build impressive presentation.

Puzzle Pie Chart With Team For Financial Analysis Powerpoint Slides
This PPT slide contains graphics of puzzle pie chart with team icons. You may use this PowerPoint template to display team strategy and success. Download this professional slide design to deliver amazing presentations.
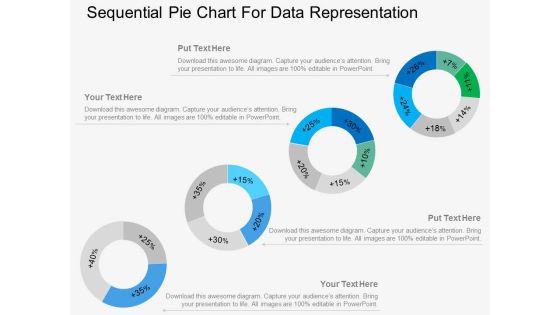
Four Sequential Pie Charts For Data Representation Powerpoint Template
Our above PowerPoint template displays infographic diagram of sequential pie chart. This diagram slide may be used for data representation in visual manner. Above slide provide ideal backdrop to make business presentations.

Customer Complaint Handling Process Flow Chart Ppt Model
This is a customer complaint handling process flow chart ppt model. This is a six stage process. The stages in this process are follow company procedure, follow company policy, customer satisfaction, be immediate, be effective, customer offer.
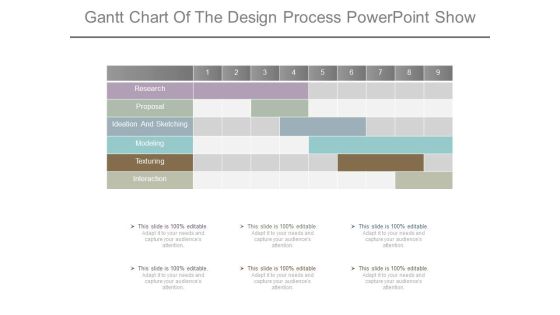
Gantt Chart Of The Design Process Powerpoint Show
This is a gantt chart of the design process powerpoint show. This is a one stage process. The stages in this process are research, proposal, ideation and sketching, modeling, texturing, interaction.
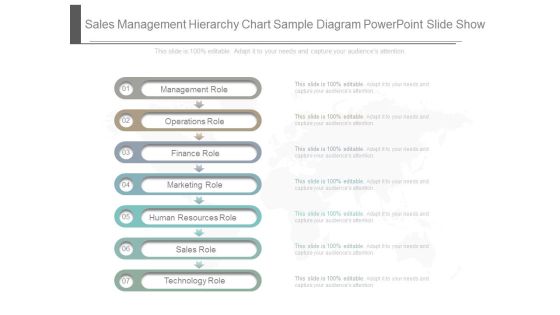
Sales Management Hierarchy Chart Sample Diagram Powerpoint Slide Show
This is a sales management hierarchy chart sample diagram powerpoint slide show. This is a seven stage process. The stages in this process are management role, operations role, finance role, marketing role, human resources role, sales role, technology role.
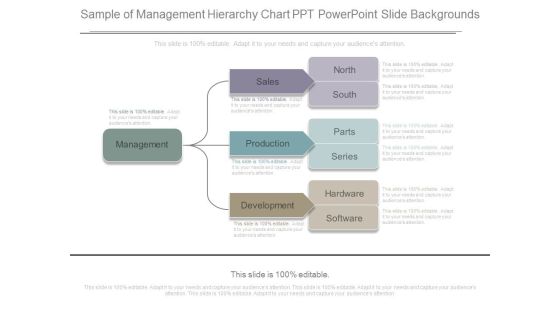
Sample Of Management Hierarchy Chart Ppt Powerpoint Slide Backgrounds
This is a sample of management hierarchy chart ppt powerpoint slide backgrounds. This is a one stage process. The stages in this process are management, sales, production, development, north, south, parts, series, hardware, software.

Five Factors Of Brand Equity Chart Presentation Images
This is a five factors of brand equity chart presentation images. This is a five stage process. The stages in this process are awareness, differentiation, consumer connection, accessibility, value. \n \n \n \n \n \n \n \n \n \n
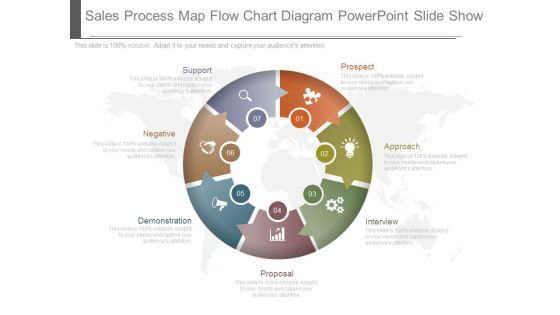
Sales Process Map Flow Chart Diagram Powerpoint Slide Show
This is a sales process map flow chart diagram powerpoint slide show. This is a seven stage process. The stages in this process are prospect, approach, interview, proposal, demonstration, negative, support.

Bid Management Team Organization Chart Powerpoint Slide Ideas
This is a bid management team organization chart powerpoint slide ideas. This is a four stage process. The stages in this process are bid team, key bid team, bid manager, proof reader, support.

Approve Leads Flow Chart Powerpoint Slide Presentation Tips
This is a approve leads flow chart powerpoint slide presentation tips. This is a seven stage process. The stages in this process are awareness, interest, decision, action, permission, engagement, call to action.
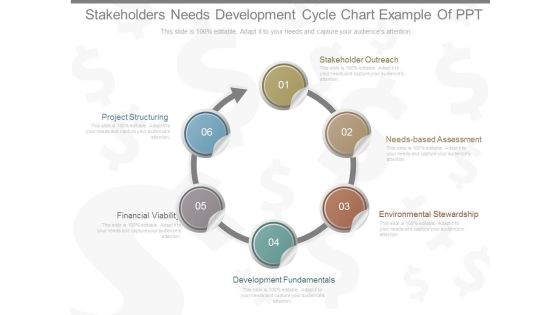
Stakeholders Needs Development Cycle Chart Example Of Ppt
This is a stakeholders needs development cycle chart example of ppt. This is a six stage process. The stages in this process are stakeholder outreach, needs based assessment, environmental stewardship,, development fundamentals, financial viability, project structuring.

Corporate Public Relation Puzzle Chart Powerpoint Slide Show
This is a corporate public relation puzzle chart powerpoint slide show. This is a nine stage process. The stages in this process are business partners, media, employees, customers, shareholders, investors, financial marketing, politics and state administration, pr.
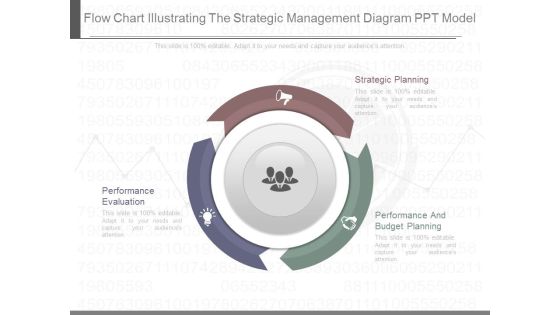
Flow Chart Illustrating The Strategic Management Diagram Ppt Model
This is a flow chart illustrating the strategic management diagram ppt model. This is a three stage process. The stages in this process are strategic planning, performance and budget planning, performance evaluation.

Operational Flow Of Financial Services Chart Example Of Ppt
This is a operational flow of financial services chart example of ppt. This is a five stage process. The stages in this process are customer, mobile, atm, employees, high finance trading.

Quality Policy And Quality Objectives Chart Powerpoint Slides
This is a quality policy and quality objectives chart powerpoint slides. This is a four stage process. The stages in this process are development and continuous improvement, plan, evaluation monitoring and control, performance and quality assurance.

Real Estate Investing Cash Flow Chart Powerpoint Templates
This is a real estate investing cash flow chart powerpoint templates. This is a four stage process. The stages in this process are cash flow, tax benefits, debt pay down, appreciation.

Management Vision And Policy Chart Powerpoint Slide Template
This is a management vision and policy chart powerpoint slide template. This is a three stage process. The stages in this process are long term strategy, group vision, medium term business plan.

Competence Cycle For Business Excellence Chart Powerpoint Layout
This is a competence cycle for business excellence chart powerpoint layout. This is a four stage process. The stages in this process are confidence competence cycle, competence, comfort, control, confidence.
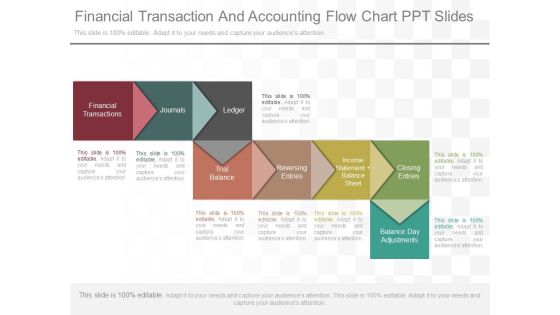
Financial Transaction And Accounting Flow Chart Ppt Slides
This is a financial transaction and accounting flow chart ppt slides. This is a eight stage process. The stages in this process are financial transactions, journals, ledger, trial balance, reversing entries, income statement balance sheet, closing entries, balance day adjustments.

Corporate Structure And Organization Chart Development Ppt Powerpoint Guide
This is a corporate structure and organization chart development ppt powerpoint guide. This is a six stage process. The stages in this process are relationship, structure, purpose, mechanisms, rewards, leadership.

Cycle Chart Of Mutual Funds Sample Diagram Ppt Images
This is a cycle chart of mutual funds sample diagram ppt images. This is a five stage process. The stages in this process are reinvestment, returns, investors, fund manager, financial securities.

Smart Business Solution Infographic Chart Example Of Ppt
This is a smart business solution infographic chart example of ppt. This is a nine stage process. The stages in this process are balance, vision, strategy, knowledge, mission, portfolio, precision, one touch, creativity.
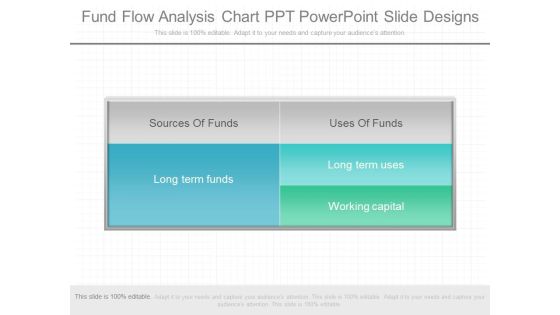
Fund Flow Analysis Chart Ppt Powerpoint Slide Designs
This is a fund flow analysis chart ppt powerpoint slide designs. This is a five stage process. The stages in this process are sources of funds, long term funds, uses of funds, long term uses, working capital.
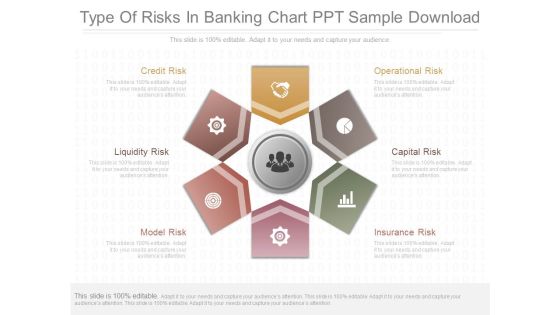
Type Of Risks In Banking Chart Ppt Sample Download
This is a type of risks in banking chart ppt sample download. This is a six stage process. The stages in this process are credit risk, liquidity risk, model risk, operational risk, capital risk, insurance risk.
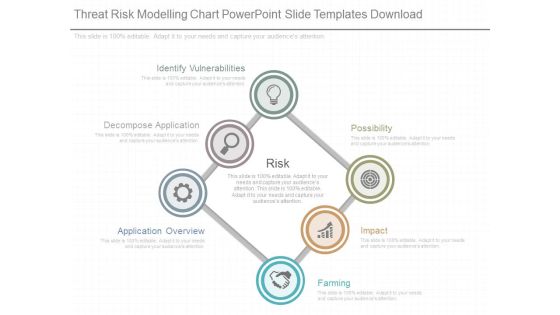
Threat Risk Modelling Chart Powerpoint Slide Templates Download
This is a threat risk modelling chart powerpoint slide templates download. This is a six stage process. The stages in this process are identify vulnerabilities, decompose application, application overview, possibility, impact, farming, risk.
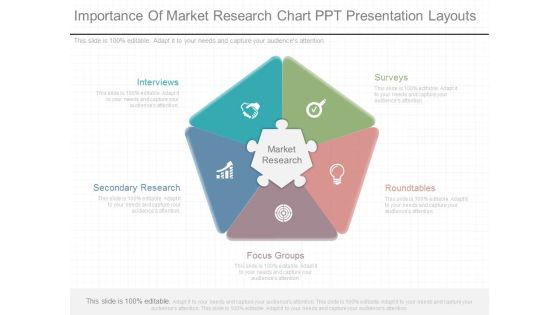
Importance Of Market Research Chart Ppt Presentation Layouts
This is a importance of market research chart ppt presentation layouts. This is a five stage process. The stages in this process are interviews, secondary research, market research, focus groups, surveys, roundtables.

Business Development Skills Business Development Skills Chart Slides
This is a business development skills business development skills chart slides. This is a eleven stage process. The stages in this process are entrepreneur, strategies, commercial, project, leadership, marketing, international, innovation, gestation, management, developer.
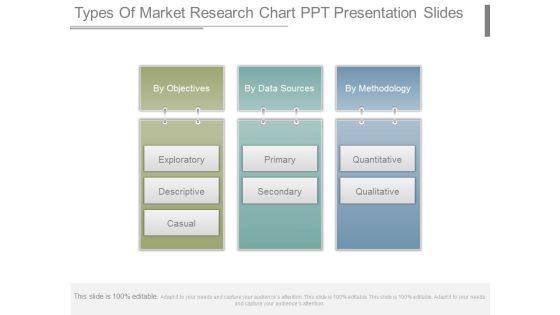
Types Of Market Research Chart Ppt Presentation Slides
This is a types of market research chart ppt presentation slides. This is a three stage process. The stages in this process are by objectives, exploratory, descriptive, causal, by data sources, primary, secondary, by methodology, quantitative, qualitative.

Economic Cooperation And Development Chart Powerpoint Slide Themes
This is a economic cooperation and development chart powerpoint slide themes. This is a five stage process. The stages in this process are partnership, participation, consultation, communication, identify, stakeholders.
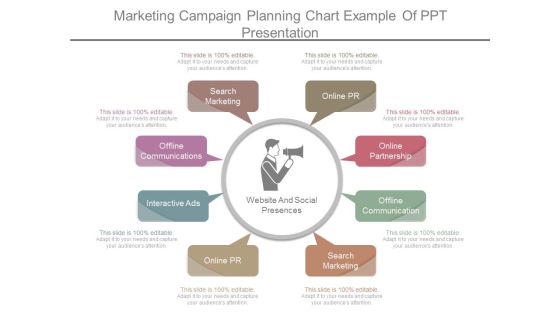
Marketing Campaign Planning Chart Example Of Ppt Presentation
This is a marketing campaign planning chart example of ppt presentation. This is a eight stage process. The stages in this process are search marketing, offline communications, interactive ads, online pr, online partnership, offline communication, search marketing.
Mutual Fund Operation Flow Chart Diagram Ppt Icon
This is a mutual fund operation flow chart diagram ppt icon. This is a four stage process. The stages in this process are return, securities, investors, fund, mutual fund operation.

Conversion Rate Optimization Flow Chart Sample Diagram Powerpoint Slides Images
This is a conversion rate optimization flow chart sample diagram powerpoint slides images. This is a five stage process. The stages in this process are gather insights, measure, unique, pitch, status, future.
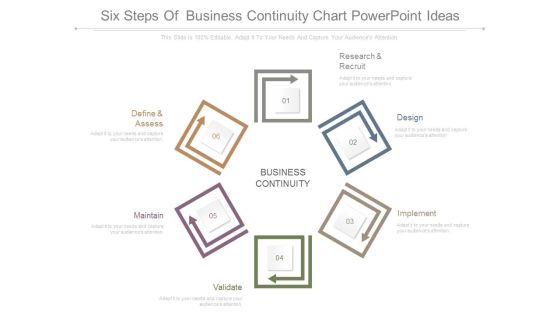
Six Steps Of Business Continuity Chart Powerpoint Ideas
This is a six steps of business continuity chart powerpoint ideas. This is a six stage process. The stages in this process are define and assess, research and recruit, design, implement, validate, maintain, business continuity.

Strategy Development Fro Effective Market Chart Powerpoint Guide
This is a strategy development fro effective market chart powerpoint guide. This is a six stage process. The stages in this process are customers, leading distributors, other competitors, suppliers to the target, local provincial governments, associations institutions, target company management.
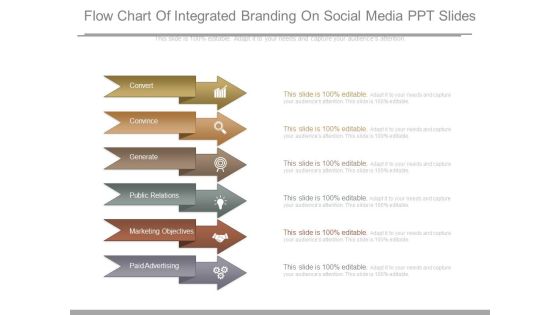
Flow Chart Of Integrated Branding On Social Media Ppt Slides
This is a flow chart of integrated branding on social media ppt slides. This is a six stage process. The stages in this process are convert, convince, generate, public relations, marketing objectives, paid advertising.
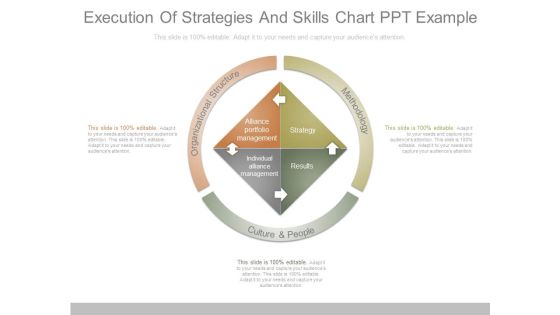
Execution Of Strategies And Skills Chart Ppt Example
This is a execution of strategies and skills chart ppt example. This is a three stage process. The stages in this process are methodology, culture and people, organizational structure, alliance portfolio management, strategy, individual alliance management, results.
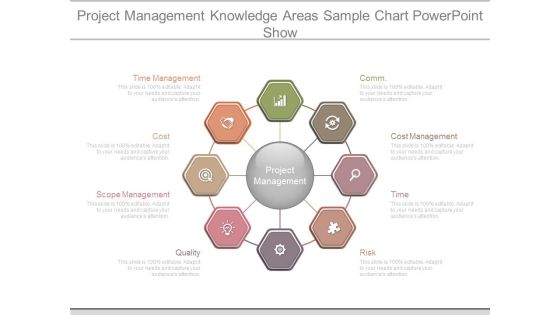
Project Management Knowledge Areas Sample Chart Powerpoint Show
This is a project management knowledge areas sample chart powerpoint show. This is a eight stage process. The stages in this process are comm, cost management, time, risk, quality, scope management, cost, time management, project management.

Conversion Rate Optimization Flow Chart Sample Diagram Example Ppt
This is a conversion rate optimization flow chart sample diagram example ppt. This is a four stage process. The stages in this process are measure, gather insights, test, form hypothesis.

Customer Awareness Process Flow Chart Ppt Presentation Deck
This is a customer awareness process flow chart ppt presentation deck. This is a seven stage process. The stages in this process are loyalty, public relation, sales promotion, advertising, purchase, preference, awareness.
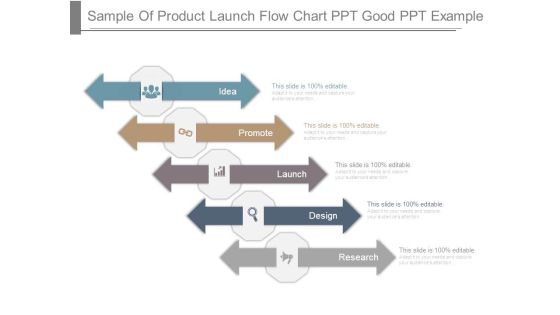
Sample Of Product Launch Flow Chart Ppt Good Ppt Example
This is a sample of product launch flow chart ppt good ppt example. This is a five stage process. The stages in this process are idea, promote, launch, design, research.

Decision Support And Knowledge Based Systems Chart Powerpoint Images
This is a decision support and knowledge based systems chart powerpoint images. This is a eight stage process. The stages in this process are situation, operational management, tactical management, options, state problem, analyse, strategic management, action.
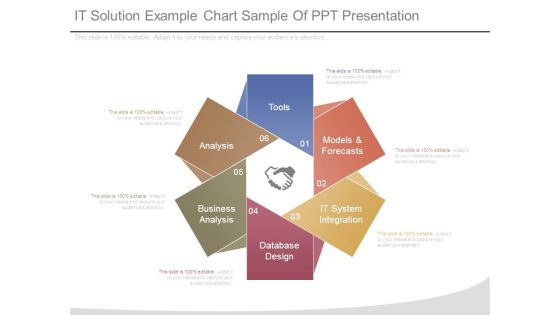
It Solution Example Chart Sample Of Ppt Presentation
This is a it solution example chart sample of ppt presentation. This is a six stage process. The stages in this process are tools, models and forecasts, it system integration, database design, business analysis, analysis.
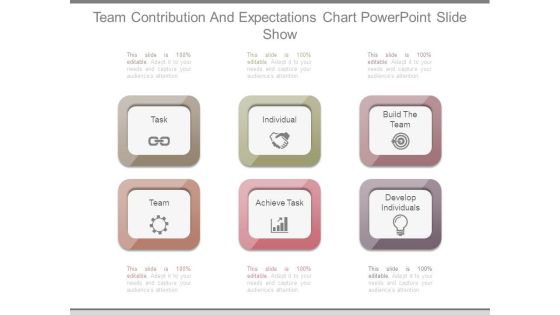
Team Contribution And Expectations Chart Powerpoint Slide Show
This is a team contribution and expectations chart powerpoint slide show. This is a six stage process. The stages in this process are task, individual, build the team, team, achieve task, develop individuals.

Network Planning And Analysis Chart Powerpoint Slides Designs Download
This is a network planning and analysis chart powerpoint slides designs download. This is a six stage process. The stages in this process are equipment planning, proof of concept, project execution, configuration, installation, gap and root cause analysis.

Conversion Rate Optimization Flow Chart Diagram Powerpoint Slide
This is a conversion rate optimization flow chart diagram powerpoint slide. This is a four stage process. The stages in this process are measure, gather insights, from hypothesis, test, conversion rate optimization.

Business Intelligence Ecosystem Chart Example Of Ppt Presentation
This is a business intelligence ecosystem chart example of ppt presentation. This is a eight stage process. The stages in this process are strategy, data mining, customers, market, business outcome, leadership skills, suppliers, competition.

Enterprise Value Timing Factors Chart Ppt Examples Professional
This is a enterprise value timing factors chart ppt examples professional. This is a four stage process. The stages in this process are industry dynamics, company performance, organic growth, strategic acquisitions.
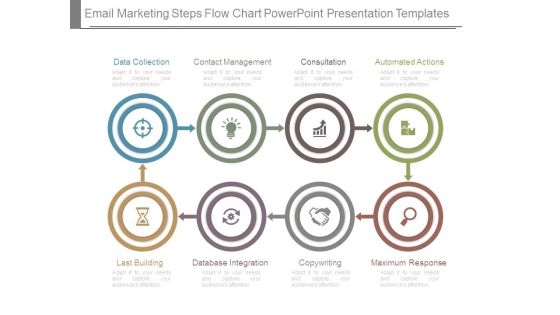
Email Marketing Steps Flow Chart Powerpoint Presentation Templates
This is a email marketing steps flow chart powerpoint presentation templates. This is a eight stage process. The stages in this process are data collection, contact management, consultation, automated actions, last building, database integration, copywriting, maximum response.
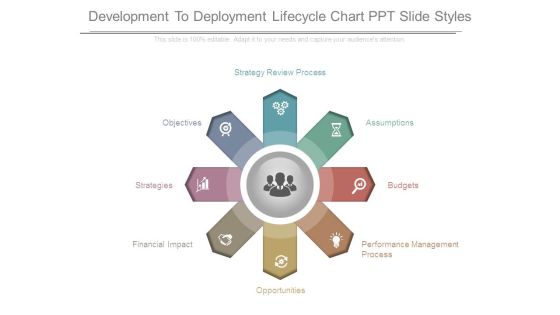
Development To Deployment Lifecycle Chart Ppt Slide Styles
This is a development to deployment lifecycle chart ppt slide styles. This is a eight stage process. The stages in this process are performance management process, opportunities, financial impact, strategies, objectives, strategy review process, assumptions, budgets.

Business Development Action Plan Chart Template Powerpoint Topics
This is a business development action plan chart template powerpoint topics. This is a six stage process. The stages in this process are review science, making plans, implementing plans, monitoring, evaluation, monitor implementation.
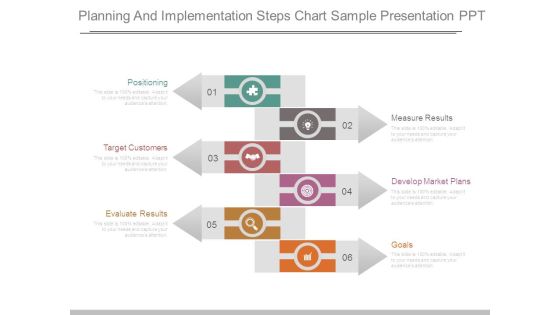
Planning And Implementation Steps Chart Sample Presentation Ppt
This is a planning and implementation steps chart sample presentation ppt. This is a six stage process. The stages in this process are positioning, target customers, evaluate results, measure results, develop market plans, goals.
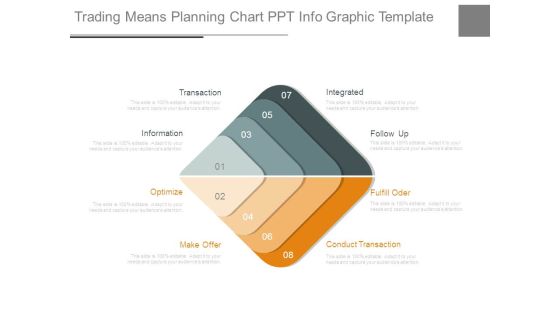
Trading Means Planning Chart Ppt Info Graphic Template
This is a trading means planning chart ppt info graphic template. This is a eight stage process. The stages in this process are transaction, information, optimize, make offer, integrated, follow up, fulfill order, conduct transaction.
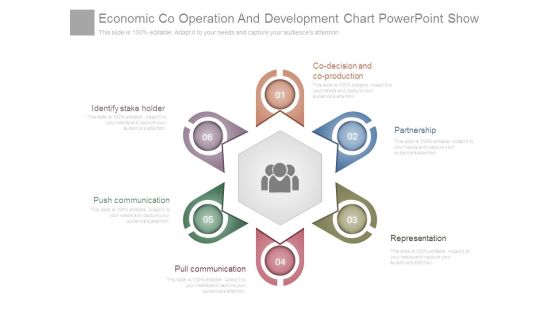
Economic Co Operation And Development Chart Powerpoint Show
This is a economic co operation and development chart powerpoint show. This is a six stage process. The stages in this process are co decision and co production, partnership, representation, pull communication, push communication, identify stake holder.

Process Flow Chart Project Execution Analysis Ppt Ideas
This is a process flow chart project execution analysis ppt ideas. This is a six stage process. The stages in this process are functional design, testing, test plan, user requirements, implementation, commissioning and start up.

Sample Of User Guide Flow Chart Diagram Powerpoint Ideas
This is a sample of user guide flow chart diagram powerpoint ideas. This is a five stage process. The stages in this process are data, process, decision, document, sored data.
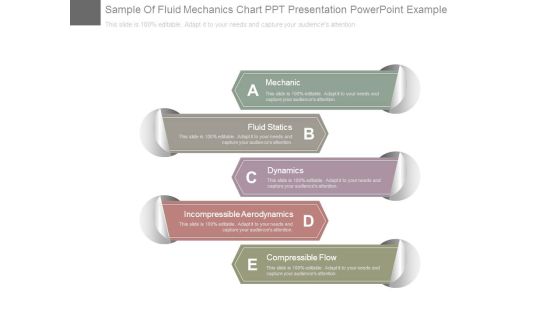
Sample Of Fluid Mechanics Chart Ppt Presentation Powerpoint Example
This is a sample of fluid mechanics chart ppt presentation powerpoint example. This is a five stage process. The stages in this process are mechanic, fluid statics, dynamics, incompressible aerodynamics, compressible flow.

Change Management Approaches Chart Powerpoint Slides Background Image
This is a change management approaches chart powerpoint slides background image. This is a eight stage process. The stages in this process are facilitation coaching, training, operational improvement, strategy, business readiness, technology, communication, rewards.

Marketing Org Chart Example Powerpoint Slide Design Ideas
This is a marketing org chart example powerpoint slide design ideas. This is a four stage process. The stages in this process are strategic marketing, product marketing, interactive marketing, marketing organization.
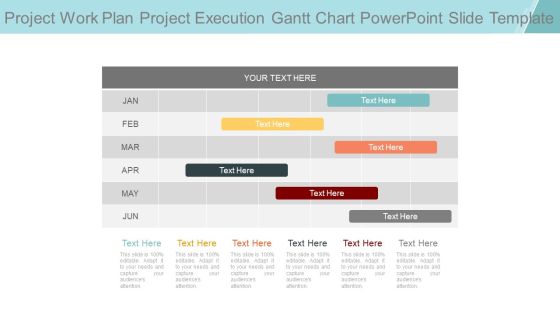
Project Work Plan Project Execution Gantt Chart Powerpoint Slide Template
This is a project work plan project execution gantt chart powerpoint slide template. This is a six stage process. The stages in this process are jan, feb, mar, apr, may, jun.

90 Day Plan Horizontal Chart Ppt Sample Presentations
This is a 90 day plan horizontal chart ppt sample presentations. This is a eight stage process. The stages in this process are 20 days, 30 days, 40 days, 50 days, 60 days, 70 days, 80 days, 90 days.

Risk Management Approach And Plan Chart Ppt Images Gallery
This is a risk management approach and plan chart ppt images gallery. This is a four stage process. The stages in this process are almost certain, likely, possible, unlikely, rare, insignificant, minor, moderate, major, severe, high, low, medium, critical.
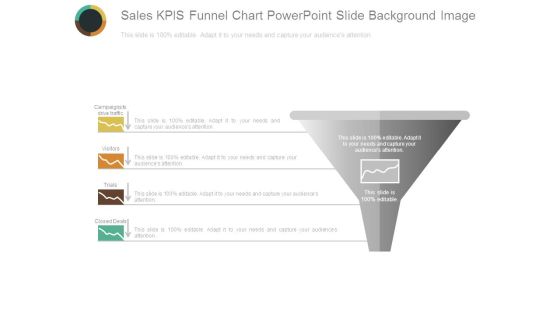
Sales Kpis Funnel Chart Powerpoint Slide Background Image
This is a sales kpis funnel chart powerpoint slide background image. This is a one stage process. The stages in this process are campaigns to drive traffic, visitors, trials, closed deals, sales.

Break Point Chart For Quality Analysis Powerpoint Slide Show
This is a break point chart for quality analysis powerpoint slide show. This is a one stage process. The stages in this process are total variable costs, fixed costs, quality sold.

90 Day Plan Description Chart Powerpoint Presentation Examples
This is a 90 day plan description chart powerpoint presentation examples. This is a eight stage process. The stages in this process are 20 days, 30 days, 40 days, 50 days, 60 days, 70 days, 80 days, 90 days.

Our Market Research Plan Gantt Chart Powerpoint Slide Backgrounds
This is a our market research plan gantt chart powerpoint slide backgrounds. This is a nine stage process. The stages in this process are jan, feb, mar, apr, may.

Our Product Vs Competition Analysis Chart Powerpoint Slide Background Designs
This is a our product vs competition analysis chart powerpoint slide background designs. This is a four stage process. The stages in this process are business, marketing, success, strategy, compare.
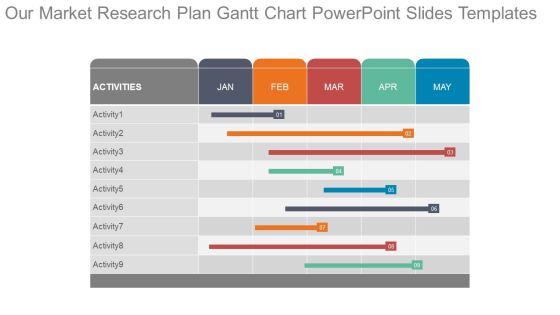
Our Market Research Plan Gantt Chart Powerpoint Slides Templates
This is a our market research plan gantt chart powerpoint slides templates. This is a nine stage process. The stages in this process are activities, jan, feb, mar, apr, may.
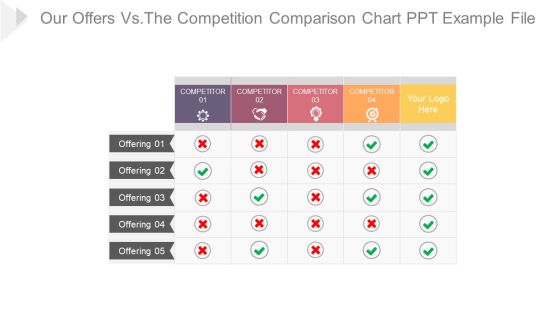
Our Offers Vs The Competition Comparison Chart Ppt Example File
This is a our offers vs the competition comparison chart ppt example file. This is a five stage process. The stages in this process are compare, table, management, business, strategy.

Value Stream Mapping Steps Chart Ppt Presentation Examples
This is a value stream mapping steps chart ppt presentation examples. This is a four stage process. The stages in this process are years, time planning, business, marketing, future.
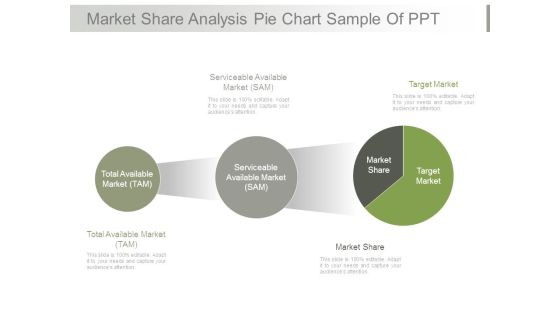
Market Share Analysis Pie Chart Sample Of Ppt
This is a market share analysis pie chart sample of ppt. This is a three stage process. The stages in this process are serviceable available market sam, target market, total available market tam, market share.

And R Chart For Six Sigma Powerpoint Slide Background Designs
This is a and r chart for six sigma powerpoint slide background designs. This is a two stage process. The stages in this process are subtitle, option, lcl, ucl.

Cost Benefit Analysis Chart With Icons Powerpoint Layout
This is a cost benefit analysis chart with icons powerpoint layout. This is a two stage process. The stages in this process are balance scale, compare, business, marketing, management.
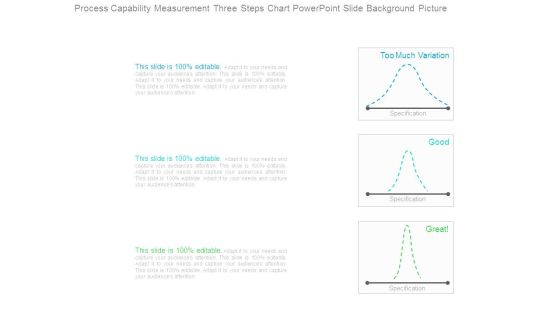
Process Capability Measurement Three Steps Chart Powerpoint Slide Background Picture
This is a process capability measurement three steps chart powerpoint slide background picture. This is a three stage process. The stages in this process are too much variation, specification, good, great.

Approaches Of Market Targeting Chart Ppt Images Gallery
This is a approaches of market targeting chart ppt images gallery. This is a three stage process. The stages in this process are undifferentiated approaches, differentiated approaches, concentrated approaches.
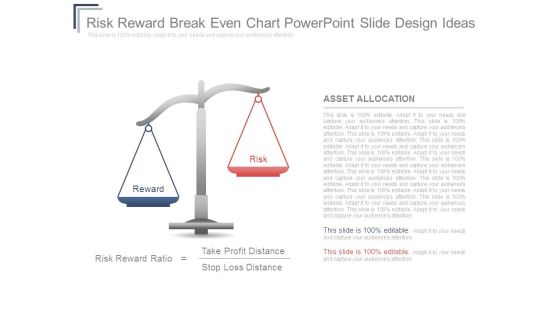
Risk Reward Breakeven Chart Powerpoint Slide Design Ideas
This is a risk reward breakeven chart powerpoint slide design ideas. This is a two stage process. The stages in this process are reward, risk, asset allocation, risk reward ratio, take profit distance, stop loss distance.
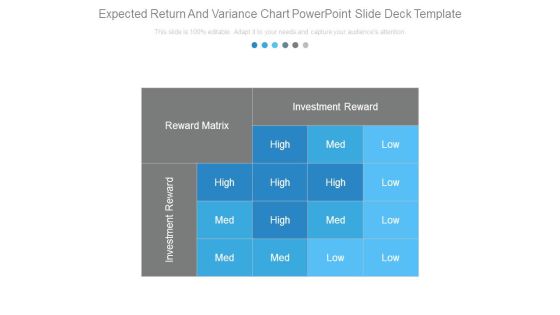
Expected Return And Variance Chart Powerpoint Slide Deck Template
This is a expected return and variance chart powerpoint slide deck template. This is a one stage process. The stages in this process are investment reward, reward matrix, high, med, low.

Investment Management Process Steps Arrow Chart Powerpoint Slide Backgrounds
This is a investment management process steps arrow chart powerpoint slide backgrounds. This is a five stage process. The stages in this process are define, analyze, control, measure, improve.

Financial Planning Steps Infographic Chart Ppt Samples Download
This is a financial planning steps infographic chart ppt samples download. This is a five stage process. The stages in this process are investments, retirement, estate planning, risk management, cash flow.
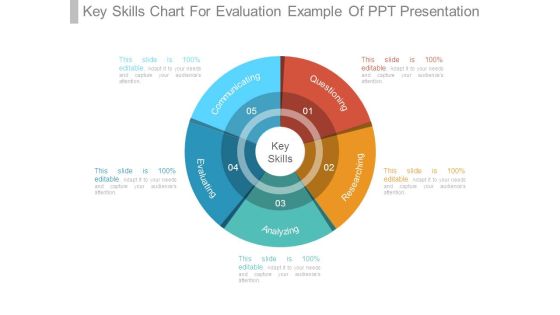
Key Skills Chart For Evaluation Example Of Ppt Presentation
This is a key skills chart for evaluation example of ppt presentation. This is a five stage process. The stages in this process are communicating, questioning, researching, analyzing, evaluating, key skills.

Customer Loyalty Circle Chart Powerpoint Slide Templates Download
This is a customer loyalty circle chart powerpoint slide templates download. This is a six stage process. The stages in this process are grow, engage, attract, reward, retain, loyalty.
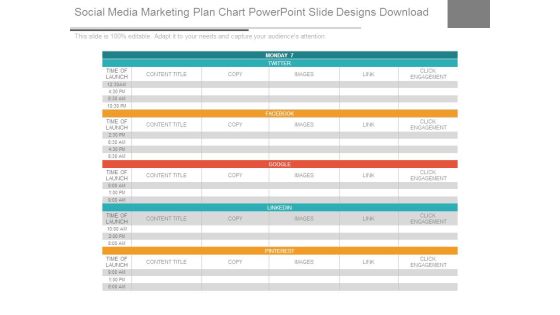
Social Media Marketing Plan Chart Powerpoint Slide Designs Download
This is a social media marketing plan chart powerpoint slide designs download. This is a five stage process. The stages in this process are content title, copy, images, link, click engagement.

Sales And Marketing Plan Gantt Chart Ppt Examples Slides
This is a sales and marketing plan gantt chart ppt examples slides. This is a three stage process. The stages in this process are sales goal, sales actual, banner ads, newspaper, in store marketing.
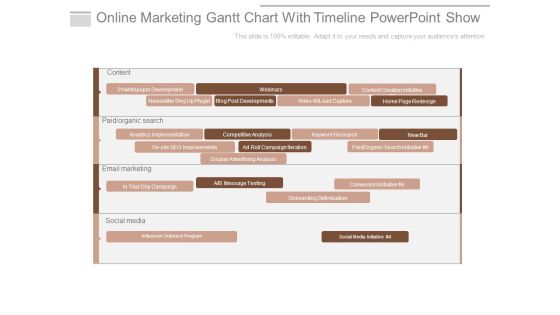
Online Marketing Gantt Chart With Timeline Powerpoint Show
This is a online marketing gantt chart with timeline powerpoint show. This is a four stage process. The stages in this process are content, whitepaper development, webinars, email marketing, social media, content creation initiative, conversion initiative.

Brand Trade Show Calendar Gantt Chart Example Ppt Presentation
This is a brand trade show calendar gantt chart example ppt presentation. This is a one stage process. The stages in this process are jan, feb, mar, apr, may, jun, jul, aug, sep, oct, nov, dec.

Competition Competitor Identification Charts Powerpoint Slide Presentation Examples
This is a competition competitor identification charts powerpoint slide presentation examples. This is a four stage process. The stages in this process are key national competitors, substitutes, new entrants, competitor.

Competitor Analysis 2 X 2 Matrix Chart Powerpoint Slide Show
This is a competitor analysis 2 x 2 matrix chart powerpoint slide show. This is a four stage process. The stages in this process are competitor, your company, competitor, complex, simple, fast, slow.

Four Steps Chart For Formation Of Strategy Powerpoint Templates
This is a four steps chart for formation of strategy powerpoint templates. This is a four stage process. The stages in this process are corporate strategy, business strategy, functional area strategies, operating strategies.
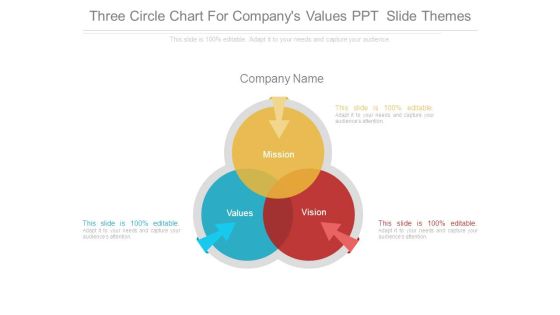
Three Circle Chart For Companys Values Ppt Slide Themes
This is a three circle chart for companys values ppt slide themes. This is a three stage process. The stages in this process are mission, company name, values, vision.

Curve Chart For Product Life Cycle Presentation Outline
This is a curve chart for product life cycle presentation outline. This is a five stage process. The stages in this process are sales over time, product extension, introduction, growth, maturity, decline, time.

Product Roadmap Product Launch Deliverables Gantt Chart Ppt Example
This is a product roadmap product launch deliverables gantt chart ppt example. This is a three stage process. The stages in this process are product launch deliverables, product family, product.
