Bar Graph

Column Chart Ppt PowerPoint Presentation Background Designs
This is a column chart ppt powerpoint presentation background designs. This is a two stage process. The stages in this process are bar graph, finance, marketing, strategy, analysis, business.

Combo Chart Ppt PowerPoint Presentation Infographics Infographics
This is a combo chart ppt powerpoint presentation infographics infographics. This is a three stage process. The stages in this process are bar graph, growth, finance, marketing, strategy, business.

Combo Chart Ppt PowerPoint Presentation Show Deck
This is a combo chart ppt powerpoint presentation show deck. This is a three stage process. The stages in this process are growth rate, market size, product, bar graph, growth.
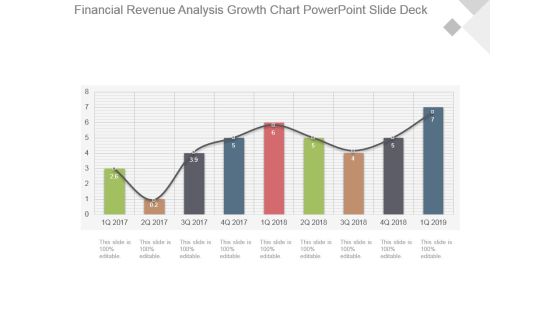
Financial Revenue Analysis Growth Chart Powerpoint Slide Deck
This is a financial revenue analysis growth chart powerpoint slide deck. This is a nine stage process. The stages in this process are growth, success, business, marketing, bar graph.
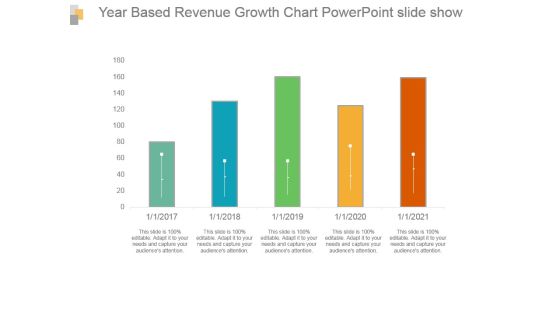
Year Based Revenue Growth Chart Powerpoint Slide Show
This is a year based revenue growth chart powerpoint slide show. This is a five stage process. The stages in this process are bar graph, growth, revenue, year, success.

Combo Chart Ppt PowerPoint Presentation Ideas Visual Aids
This is a combo chart ppt powerpoint presentation ideas visual aids. This is a three stage process. The stages in this process are product, sales, bar graph, business, marketing.

Column Chart Ppt PowerPoint Presentation Model Graphics Download
This is a column chart ppt powerpoint presentation model graphics download. This is a two stage process. The stages in this process are product, financial year, sales in percentage, bar graph, success.

Column Chart Ppt PowerPoint Presentation Gallery Slide Portrait
This is a column chart ppt powerpoint presentation gallery slide portrait. This is a two stage process. The stages in this process are sales in percentage, financial year, product, bar graph, growth.

Data Collection And Analysis Control Chart Ppt PowerPoint Presentation Example File
This is a data collection and analysis control chart ppt powerpoint presentation example file. This is a four stage process. The stages in this process are business, strategy, marketing, bar graph, growth strategy.

Clustered Column Line Ppt PowerPoint Presentation Professional
This is a clustered column line ppt powerpoint presentation professional. This is a three stage process. The stages in this process are clustered column line, product, bar graph, marketing, finance.

Clustered Column Line Ppt PowerPoint Presentation Slide
This is a clustered column line ppt powerpoint presentation slide. This is a three stage process. The stages in this process are bar graph, growth, finance, product, sales in percentage.

Clustered Column Line Ppt PowerPoint Presentation Summary Styles
This is a clustered column line ppt powerpoint presentation summary styles. This is a four stage process. The stages in this process are bar graph, business, marketing, growth, success.

Clustered Column Line Ppt PowerPoint Presentation Summary Slides
This is a clustered column line ppt powerpoint presentation summary slides. This is a four stage process. The stages in this process are bar graph, growth, success, business, marketing.

Portfolio Evaluation Ppt PowerPoint Presentation Infographics Objects
This is a portfolio evaluation ppt powerpoint presentation infographics objects. This is a two stage process. The stages in this process are business, finance, bar graph, pie chart, marketing, analysis, investment.
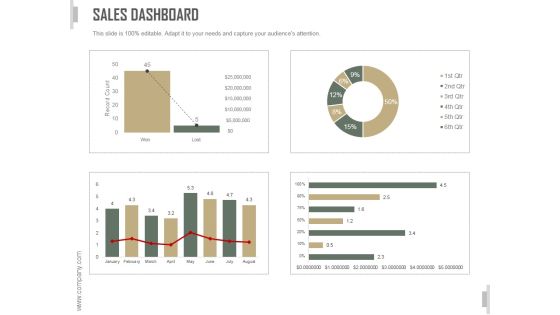
Sales Dashboard Slide Ppt PowerPoint Presentation Template
This is a sales dashboard slide ppt powerpoint presentation template. This is a three stage process. The stages in this process are business, strategy, marketing, analysis, bar graph, growth strategy.
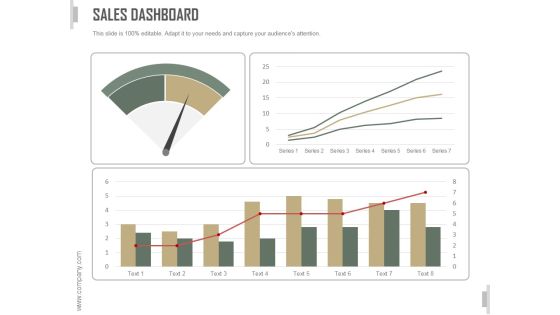
Sales Dashboard Ppt PowerPoint Presentation Design Templates
This is a sales dashboard ppt powerpoint presentation design templates. This is a four stage process. The stages in this process are business, strategy, marketing, analysis, bar graph, growth strategy.

Lead Scoring Template Ppt PowerPoint Presentation Model
This is a lead scoring template ppt powerpoint presentation model. This is a four stage process. The stages in this process are business, marketing, success, bar graph, lead scoring.

Competitor Revenue And Profit Template 1 Ppt PowerPoint Presentation Infographic Template Designs Download
This is a competitor revenue and profit template 1 ppt powerpoint presentation infographic template designs download. This is a five stage process. The stages in this process are revenue, profit, competitor, bar graph, growth.
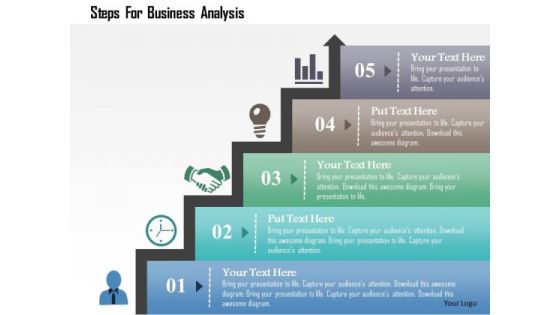
Business Diagram Steps For Business Analysis Presentation Template
Concept of time management has been defined in this power point template diagram. This diagram contains the graphic of bar graph. Amplify your thoughts via this appropriate business template.

Business Diagram Thermometer Graphics Indicating Progress Presentation Template
This power point template diagram has been designed with graphic of thermometer and bar graph. This PPT contains the concept of growth analysis. Use this PPT for business and marketing related presentations.

Customer Trends Template 1 Ppt PowerPoint Presentation Diagrams
This is a customer trends template 1 ppt powerpoint presentation diagrams. This is a five stage process. The stages in this process are business, marketing, bar graph, finance, management.

Crowdfunding Statistics Template 1 Ppt PowerPoint Presentation Good
This is a crowdfunding statistics template 1 ppt powerpoint presentation good. This is a two stage process. The stages in this process are business, location, geographical, finance, bar graph, marketing.
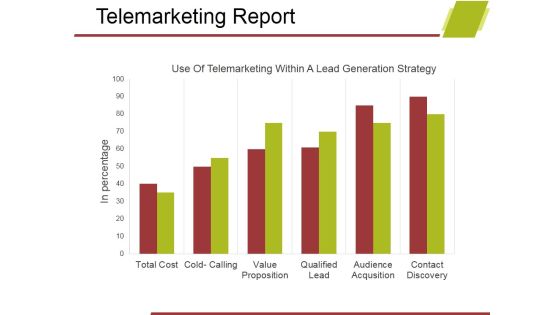
Telemarketing Report Template 1 Ppt PowerPoint Presentation Show Design Ideas
This is a telemarketing report template 1 ppt powerpoint presentation show design ideas. This is a six stage process. The stages in this process are business, bar graph, marketing, analysis, growth, strategy.

World Sector Growth Ppt PowerPoint Presentation Gallery Template
This is a world sector growth ppt powerpoint presentation gallery template. This is a four stage process. The stages in this process are business, bar graph, finance, marketing, strategy.

Adjusted Roce Template 1 Ppt PowerPoint Presentation Styles Background Designs
This is a adjusted roce template 1 ppt powerpoint presentation styles background designs. This is a seven stage process. The stages in this process are bar graph, finance, year, business, marketing.

Adjusted Roce Template 2 Ppt PowerPoint Presentation Icon Pictures
This is a adjusted roce template 2 ppt powerpoint presentation icon pictures. This is a five stage process. The stages in this process are bar graph, finance, percentage, business, marketing.
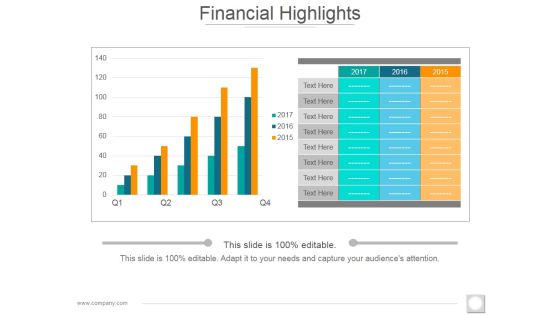
Financial Highlights Template 2 Ppt PowerPoint Presentation Slides Ideas
This is a financial highlights template 2 ppt powerpoint presentation slides ideas. This is a two stage process. The stages in this process are bar graph, growth, success, business, marketing.
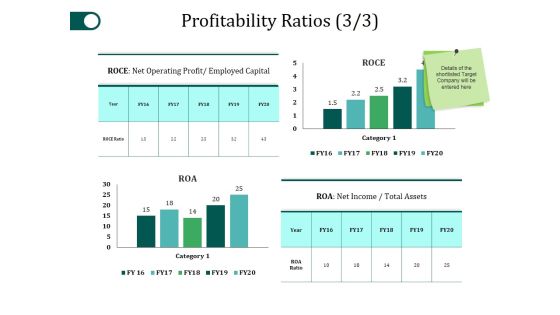
Profitability Ratios Template 3 Ppt PowerPoint Presentation Gallery Slide Portrait
This is a profitability ratios template 3 ppt powerpoint presentation gallery slide portrait. This is a four stage process. The stages in this process are category, roce, net income, business, bar graph.

Business Diagram Brand Equity And Brand Value Presentation Template
Explain the concept of brand equity and brand value with this unique business diagram. This diagram slide contains the graphic of multiple bar graphs. Download this awesome diagram to capture your audiences attention.

Crm Dashboard Current Lead Status Ppt PowerPoint Presentation Infographic Template Visual Aids
This is a crm dashboard current lead status ppt powerpoint presentation infographic template visual aids. This is a six stage process. The stages in this process are bar graph, finance, marketing, strategy, business, analysis.
Revenue Split By Product Segment Template 1 Ppt PowerPoint Presentation Ideas Icons
This is a revenue split by product segment template 1 ppt powerpoint presentation ideas icons. This is a four stage process. The stages in this process are business, marketing, success, bar graph, product.

Gap Between Current And Required Staff Ppt PowerPoint Presentation Infographic Template Microsoft
This is a gap between current and required staff ppt powerpoint presentation infographic template microsoft. This is a five stage process. The stages in this process are business, bar graph, finance, marketing, strategy, analysis.
Monthly Recurring Revenue Churn Template 1 Ppt PowerPoint Presentation Icon Microsoft
This is a monthly recurring revenue churn template 1 ppt powerpoint presentation icon microsoft. This is a four stage process. The stages in this process are bar graph, growth, success, business, marketing.

Monthly Recurring Revenue Churn Template 2 Ppt PowerPoint Presentation Diagram Images
This is a monthly recurring revenue churn template 2 ppt powerpoint presentation diagram images. This is a eleven stage process. The stages in this process are bar graph, growth, success, business, marketing.
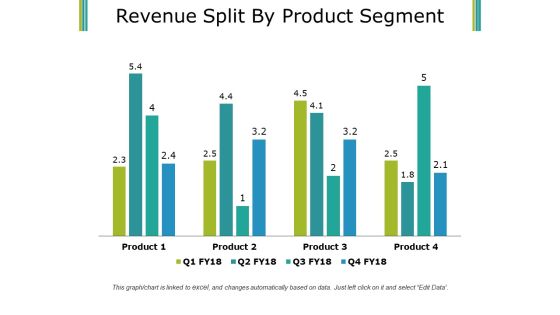
Revenue Split By Product Segment Template 1 Ppt PowerPoint Presentation Infographics Smartart
This is a revenue split by product segment template 1 ppt powerpoint presentation infographics smartart. This is a four stage process. The stages in this process are business, finance, marketing, bar graph, product.
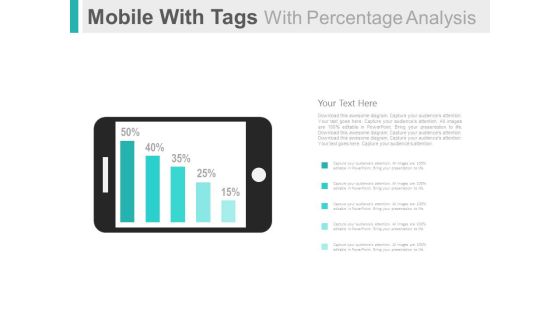
Mobile For Online Survey And Analysis Powerpoint Slides
This PowerPoint template has been designed with graphics of mobile and percentage bar graph. This PPT slide can be used to display online survey and analysis. You can download finance PowerPoint template to prepare awesome presentations.
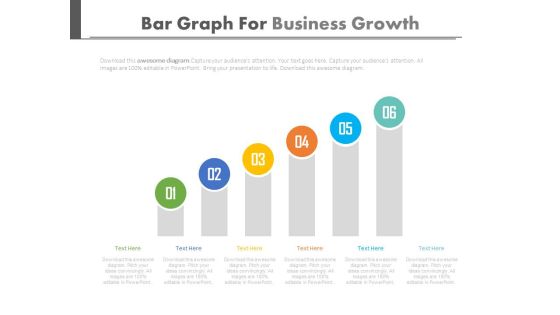
Setting Goals And Developing Strategies Powerpoint Slides
This PowerPoint template is useful for setting goals and developing strategies. This PPT background has a design of six steps bar graph. This PPT slide is suitable for topics like corporate strategic planning.
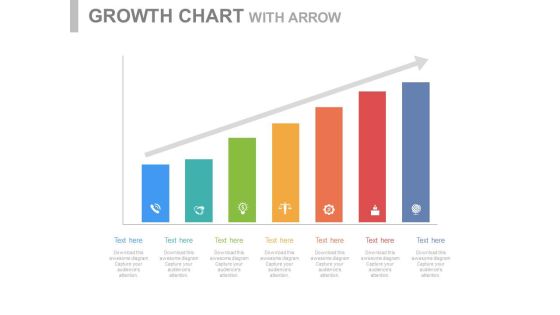
Steps For Developing Strategic Plan Powerpoint Slides
This PowerPoint template is useful for setting goals and developing strategies. This PPT background has a design of seven steps bar graph. This PPT slide is suitable for topics like corporate strategic planning.
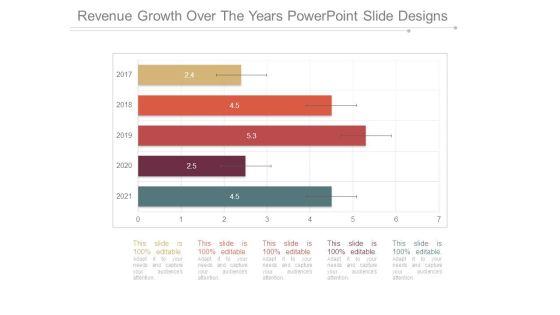
Revenue Growth Over The Years Powerpoint Slide Designs
This is a revenue growth over the years powerpoint slide designs. This is a five stage process. The stages in this process are bar graph, years, business, growth, marketing.

Corporate Growth Over The Years Ppt PowerPoint Presentation Good
This is a corporate growth over the years ppt powerpoint presentation good. This is a five stage process. The stages in this process are business, strategy, marketing, growth, bar graph.

Crm Dashboard Deals By Expected Close Date Ppt PowerPoint Presentation Background Images
This is a crm dashboard deals by expected close date ppt powerpoint presentation background images. This is a five stage process. The stages in this process are bar graph, aug, sep, oct, growth.

Cycle Time By Month Ppt PowerPoint Presentation Guidelines
This is a cycle time by month ppt powerpoint presentation guidelines. This is a twelve stage process. The stages in this process are business, strategy, marketing, process, arrow, finance, bar graph.

Projected Sales Volume Ppt PowerPoint Presentation Pictures
This is a projected sales volume ppt powerpoint presentation pictures. This is a five stage process. The stages in this process are business, strategy, marketing, analysis, liner process, bar graph.
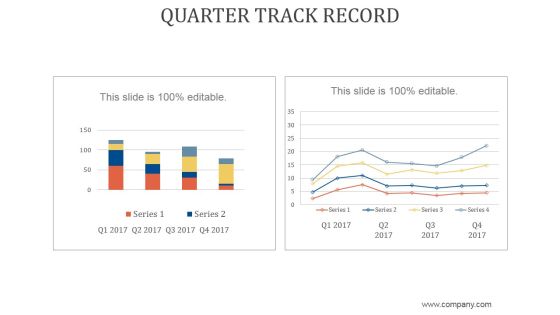
Quarter Track Record Ppt PowerPoint Presentation Samples
This is a quarter track record ppt powerpoint presentation samples. This is a two stage process. The stages in this process are business, strategy, marketing, analysis, growth strategy, bar graph.
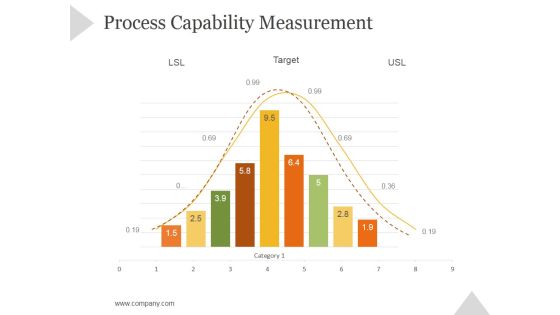
Process Capability Measurement Ppt PowerPoint Presentation Rules
This is a process capability measurement ppt powerpoint presentation rules. This is a nine stage process. The stages in this process are business, strategy, marketing, success, bar graph, growth strategy.

Current Quarter Portfolio Ppt PowerPoint Presentation Visual Aids
This is a current quarter portfolio ppt powerpoint presentation visual aids. This is a two stage process. The stages in this process are business, strategy, marketing, finance, growth strategy, bar graph.

Pareto Analysis Tamplate 2 Ppt PowerPoint Presentation Graphics
This is a pareto analysis tamplate 2 ppt powerpoint presentation graphics. This is a twelve stage process. The stages in this process are bar graph, finance, marketing, strategy, analysis, business.

Crm Dashboard Deals By Expected Close Date Ppt PowerPoint Presentation Portfolio Icons
This is a crm dashboard deals by expected close date ppt powerpoint presentation portfolio icons. This is a three stage process. The stages in this process are bar graph, finance, marketing, strategy, business, analysis, growth.

Crm Dashboard Top Customers Ppt PowerPoint Presentation Styles Designs
This is a crm dashboard top customers ppt powerpoint presentation styles designs. This is a ten stage process. The stages in this process are business, customer, finance, bar graph, marketing, strategy, analysis.

Advertising Spent On Different Mediums Ppt PowerPoint Presentation Infographics Show
This is a advertising spent on different mediums ppt powerpoint presentation infographics show. This is a five stage process. The stages in this process are business, finance, marketing, strategy, bar graph, growth.

Data Analytics Ppt PowerPoint Presentation Icon Master Slide
This is a data analytics ppt powerpoint presentation icon master slide. This is a five stage process. The stages in this process are bar graph, growth, success, business, marketing.
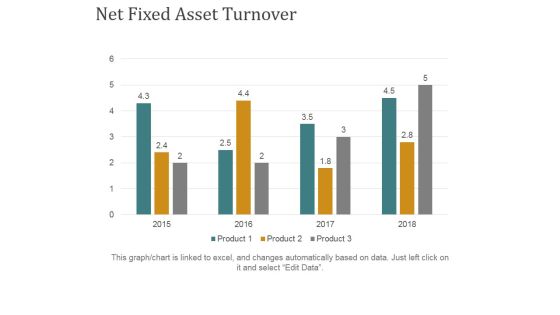
Net Fixed Asset Turnover Ppt PowerPoint Presentation Ideas Grid
This is a net fixed asset turnover ppt powerpoint presentation ideas grid. This is a four stage process. The stages in this process are business, finance, marketing, bar graph, strategy.

Annual Run Rate Ppt PowerPoint Presentation Gallery Mockup
This is a annual run rate ppt powerpoint presentation gallery mockup. This is a four stage process. The stages in this process are bar graph, growth, success, business, marketing.

Stacked Area Clustered Column Ppt PowerPoint Presentation Show Guidelines
This is a stacked area clustered column ppt powerpoint presentation show guidelines. This is a four stage process. The stages in this process are in percentage, product, bar graph, growth, success.

Clustered Column Ppt PowerPoint Presentation File Slide
This is a clustered column ppt powerpoint presentation file slide. This is a two stage process. The stages in this process are product, financial year, sales in percentage, bar graph.

Stacked Area Clustered Column Ppt PowerPoint Presentation Summary Professional
This is a stacked area clustered column ppt powerpoint presentation summary professional. This is a three stage process. The stages in this process are product, bar graph, growth, success, in percentage.
Product Launch Budget Plan Ppt PowerPoint Presentation Icon Slide
This is a product launch budget plan ppt powerpoint presentation icon slide. This is a seven stage process. The stages in this process are bar graph, icons, percentage, finance, business.

Competitors Average Price Product Ppt PowerPoint Presentation File Pictures
This is a competitors average price product ppt powerpoint presentation file pictures. This is a five stage process. The stages in this process are bar graph, business, marketing, finance, company.
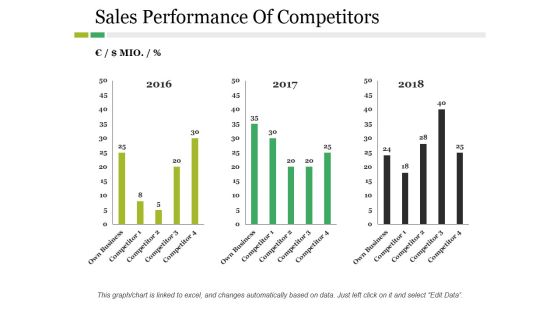
Sales Performance Of Competitors Ppt PowerPoint Presentation Inspiration Example
This is a sales performance of competitors ppt powerpoint presentation inspiration example. This is a three stage process. The stages in this process are business, marketing, year, bar graph, finance.

Clustered Column Ppt PowerPoint Presentation Gallery Structure
This is a clustered column ppt powerpoint presentation gallery structure. This is a two stage process. The stages in this process are product, sales in percentage, financial year, bar graph, finance.

Market Potential Ppt PowerPoint Presentation Complete Deck With Slides
This is a market potential ppt powerpoint presentation complete deck with slides. This is a one stage process. The stages in this process are market, potential, business, management, bar graph.

Competitors Average Price Product Ppt PowerPoint Presentation Icon Layout
This is a competitors average price product ppt powerpoint presentation icon layout. This is a five stage process. The stages in this process are company, bar graph, finance, business, marketing.
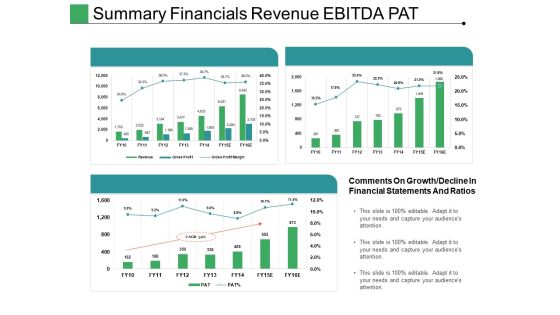
Summary Financials Revenue Ebitda Pat Ppt PowerPoint Presentation Ideas Tips
This is a summary financials revenue ebitda pat ppt powerpoint presentation ideas tips. This is a three stage process. The stages in this process are comments on growth, bar graph, growth, success, business.

Clustered Column Ppt PowerPoint Presentation Icon Objects
This is a clustered column ppt powerpoint presentation icon objects. This is a two stage process. The stages in this process are clustered column, product, growth, finance, bar graph.
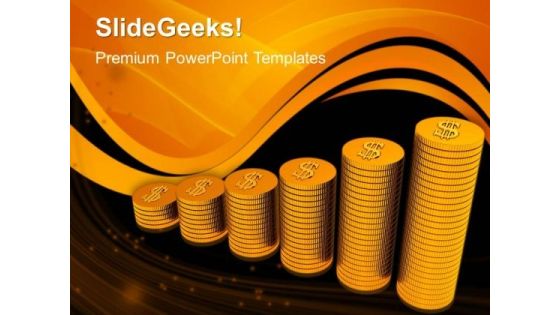
Coins Investment PowerPoint Templates And PowerPoint Themes 1012
Coins Investment PowerPoint Templates And PowerPoint Themes 1012-Use this PowerPoint Template to signify the concept of Bar graph. It consists of the coins forming the Bar graph. This image has been conceived to enable you to emphatically communicate your ideas in your Business PPT presentation. Original thinking is the need of the hour. We provide the means to project your views.-Coins Investment PowerPoint Templates And PowerPoint Themes 1012-This PowerPoint template can be used for presentations relating to-Gold coins, business, money, finance, success, signs

Bull Vs Bear Metaphor PowerPoint Templates And PowerPoint Backgrounds 0111
Microsoft PowerPoint Template and Background with bull vs bear graph bars formed of two rows of american quarter coin piles

Victory Business PowerPoint Templates And PowerPoint Backgrounds 0811
Microsoft PowerPoint Template and Background with business man standing on top of graph bars while the competition is being defeated

Victory Business PowerPoint Themes And PowerPoint Slides 0811
Microsoft PowerPoint Theme and Slide with business man standing on top of graph bars while the competition is being defeated

0814 Business Diagram For Planning Image Graphics For PowerPoint
Define the concepts of planning with this unique image. This image of charts and graphs depicts planning for year 2015. In this image pie chart and bar graph is displayed with year 2015. Use this image in business, marketing and sales related presentations.
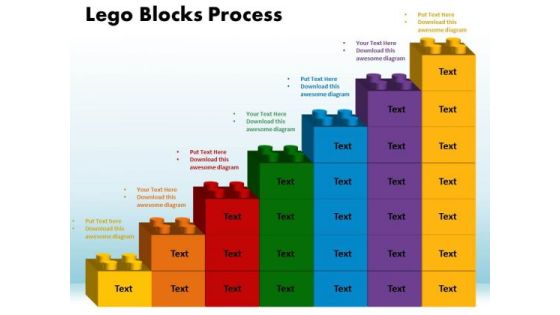
PowerPoint Template Lego Blocks Process Business Ppt Template
PowerPoint Template Lego Blocks Process Business PPT template-This PowerPoint diagram Consists of Lego Bar Graph which is Monotonically Increasing. Lego is a children's toy used for building models with small colorful plastic bricks that fit together and come apart again. It signifies action figure, balloon, beanbag, brick, building block, cap, catapult, Dinky Toy, dollhouse, doll

PowerPoint Template Lego Blocks Process Business Ppt Themes
PowerPoint Template Lego Blocks Process Business PPT Themes-Use This Lego Bar Graph which is Monotonically Increasing. This PowerPoint diagram imitates children's toy used for building models with small colorful plastic bricks that fit together and come apart again.-PowerPoint Template Lego Blocks Process Business PPT Themes
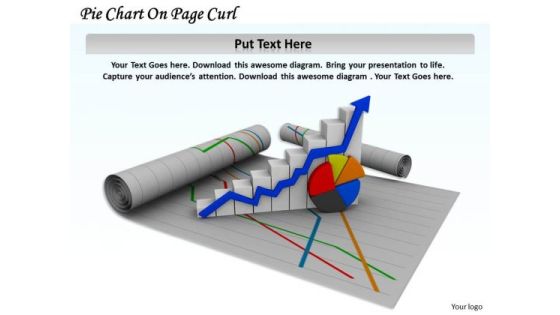
Stock Photo Pie Chart On Page Curl Arrow PowerPoint Slide
This image slide displays pie chart and growth bar graph on page curl. Use this image slide, in your presentations to express views on progress, growth and achievements. This image slide may also be used to depict strategic business planning. Make professional presentations using this image slide.

Stock Photo Pie Chart On Page Curl PowerPoint Slide
This image slide displays pie chart and growth bar graph on page curl on blue shaded background. Use this image slide, in your presentations to express views on progress, growth and achievements. This image slide may also be used to depict strategic business planning. Make professional presentations using this image slide.

0814 Business Diagram 2015 For Planning Image Graphics For PowerPoint
Define the concepts of target and success with this unique image. This image depicts planning for year 2015. In this image pie chart and bar graph is displayed with year 2015. Use this image in business, marketing and sales related presentations.
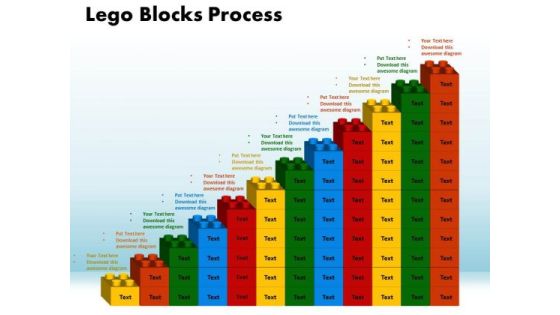
PowerPoint Process Lego Blocks Process Success Ppt Slides
PowerPoint Process Lego Blocks Process Success PPT Slides-This Business PowerPoint diagram consists of bar Graph of Lego blocks which is monotonically increasing. It refers to the Financial Growth of the Business. It Portrays the concept of Construction, Manufacturing, Design, Retail Market and Business Consultants.-PowerPoint Process Lego Blocks Process Success PPT Slides
Finance Manager Vector Icon Ppt PowerPoint Presentation Professional Structure PDF
Presenting this set of slides with name finance manager vector icon ppt powerpoint presentation professional structure pdf. This is a one stage process. The stage in this process is finance manager vector icon with bar graph and gear. This is a completely editable PowerPoint presentation and is available for immediate download. Download now and impress your audience.

Maximizing Value Business Existing Customers Ppt PowerPoint Presentation Complete Deck
Presenting this set of slides with name maximizing value business existing customers ppt powerpoint presentation complete deck. The topics discussed in these slides are bar graph increasing, business, existing customers, strategies, customer base. This is a completely editable PowerPoint presentation and is available for immediate download. Download now and impress your audience.
Stacked Area Clustered Column Ppt PowerPoint Presentation Icon Aids
This is a stacked area clustered column ppt powerpoint presentation icon aids. This is a three stage process. The stages in this process are business, marketing, finance, bar, graph.

Combo Chart Ppt PowerPoint Presentation Gallery Sample
This is a combo chart ppt powerpoint presentation gallery sample. This is a three stage process. The stages in this process are market size, product, growth rate, bar, graph.

Profit Graph01 Business PowerPoint Templates And PowerPoint Themes 0512
Microsoft Powerpoint Templates and Background with bar chart growth-Profit Graph01 Business PowerPoint Templates And PowerPoint Themes 0512-These PowerPoint designs and slide layouts can be used for themes relating to -Bar chart growth, shapes, business, finance, success, marketing

Clustered Column Line Analysis Ppt PowerPoint Presentation Portfolio Objects
Presenting this set of slides with name clustered column line analysis ppt powerpoint presentation portfolio objects. The topics discussed in these slides are bar graph, finance, marketing, analysis, investment. This is a completely editable PowerPoint presentation and is available for immediate download. Download now and impress your audience.
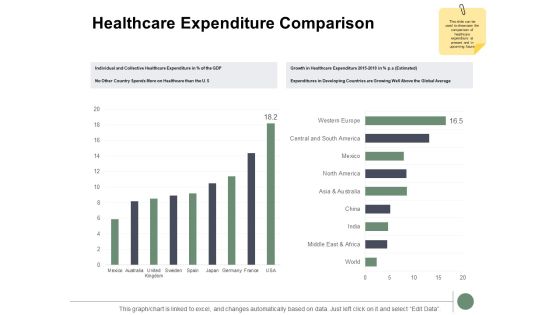
Healthcare Expenditure Comparison Ppt PowerPoint Presentation Gallery Examples
Presenting this set of slides with name healthcare expenditure comparison ppt powerpoint presentation gallery examples. The topics discussed in these slides are bar graph, finance, marketing, analysis, investment. This is a completely editable PowerPoint presentation and is available for immediate download. Download now and impress your audience.

Healthcare Financial Report Ppt PowerPoint Presentation Portfolio Slide Download
Presenting this set of slides with name healthcare financial report ppt powerpoint presentation portfolio slide download. The topics discussed in these slides are bar graph, finance, marketing, analysis, investment. This is a completely editable PowerPoint presentation and is available for immediate download. Download now and impress your audience.

Healthcare Industry Key Stats Ppt PowerPoint Presentation File Deck
Presenting this set of slides with name healthcare industry key stats ppt powerpoint presentation file deck. The topics discussed in these slides are bar graph, finance, marketing, analysis, investment. This is a completely editable PowerPoint presentation and is available for immediate download. Download now and impress your audience.
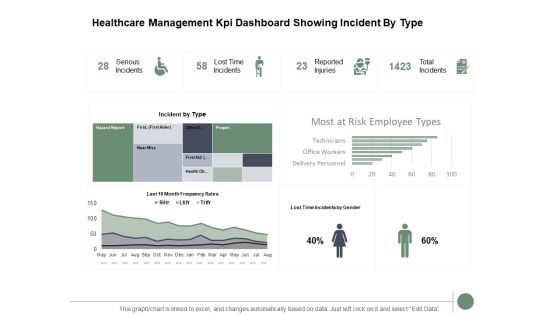
Healthcare Management Kpi Dashboard Showing Incident By Type Ppt PowerPoint Presentation Gallery Slide Download
Presenting this set of slides with name healthcare management kpi dashboard showing incident by type ppt powerpoint presentation gallery slide download. The topics discussed in these slides are bar graph, finance, marketing, analysis, investment. This is a completely editable PowerPoint presentation and is available for immediate download. Download now and impress your audience.
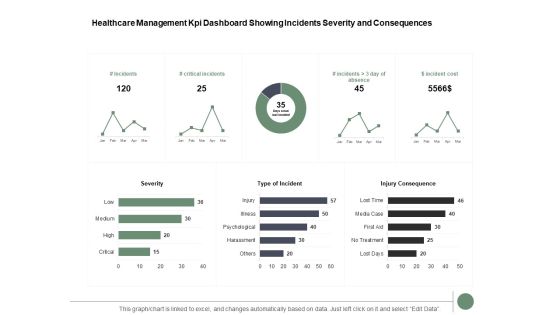
Healthcare Management Kpi Dashboard Showing Incidents Severity And Consequences Ppt PowerPoint Presentation Inspiration Summary
Presenting this set of slides with name healthcare management kpi dashboard showing incidents severity and consequences ppt powerpoint presentation inspiration summary. The topics discussed in these slides are bar graph, finance, marketing, analysis, investment. This is a completely editable PowerPoint presentation and is available for immediate download. Download now and impress your audience.
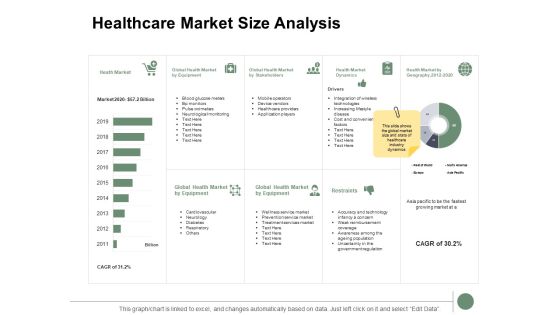
Healthcare Market Size Analysis Ppt PowerPoint Presentation Summary Examples
Presenting this set of slides with name healthcare market size analysis ppt powerpoint presentation summary examples. The topics discussed in these slides are bar graph, finance, marketing, analysis, investment. This is a completely editable PowerPoint presentation and is available for immediate download. Download now and impress your audience.
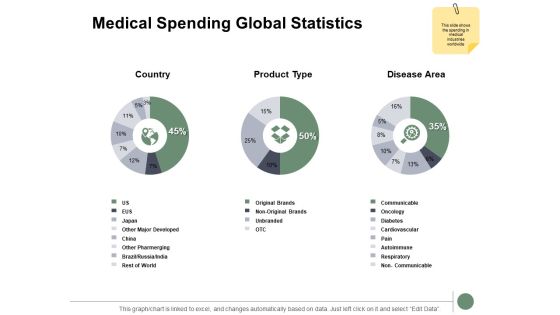
Medical Spending Global Statistics Ppt PowerPoint Presentation Visual Aids Background Images
Presenting this set of slides with name medical spending global statistics ppt powerpoint presentation visual aids background images. The topics discussed in these slides are bar graph, finance, marketing, analysis, investment. This is a completely editable PowerPoint presentation and is available for immediate download. Download now and impress your audience.

Competition Market Share Analysis Business Ppt PowerPoint Presentation Show Design Inspiration
Presenting this set of slides with name competition market share analysis business ppt powerpoint presentation show design inspiration. The topics discussed in these slides are bar graph, finance, marketing, analysis, investment. This is a completely editable PowerPoint presentation and is available for immediate download. Download now and impress your audience.

Total Addressable Market Forecasting Ppt PowerPoint Presentation Model Slideshow
Presenting this set of slides with name total addressable market forecasting ppt powerpoint presentation model slideshow. The topics discussed in these slides are bar graph, finance, marketing, analysis, investment. This is a completely editable PowerPoint presentation and is available for immediate download. Download now and impress your audience.
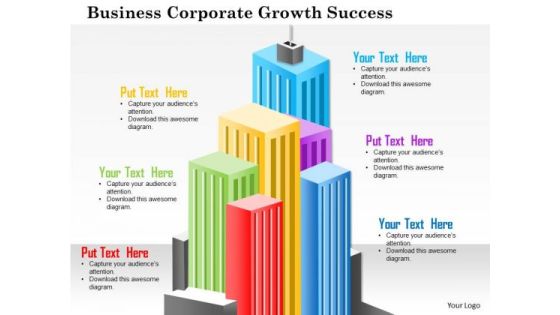
Business Framework Business Corporate Growth Success PowerPoint Presentation
This power point diagram slide has been designed with business corporate growth and success concept. To display this concept we have used graphic of multicolored bar graphs. This graphic slide is based on profit growth in any business. Use this slide for business and finance related presentations.

Business Diagram Lock With Missing Puzzle Piece Presentation Template
This business plan power point template has been designed with laptop and bar graph. We have also used pie chart to display business result analysis. Use this PPT for explaining result analysis and calculation process. Add this PPT in your presentations and get good comments from viewers.

Business Chart Finance PowerPoint Templates And PowerPoint Themes 1012
Visually support your Microsoft office PPT Presentation with our above template illustrating a colored bar graph. This image has been professionally designed to emphasize the concept of statistics. This image has been conceived to enable you to emphatically communicate your ideas in your Business and Financial PPT presentations showing reports, ratings and reviews etc. Deliver amazing presentations to mesmerize your audience.

Stock Photo Green Grass Business Growth Chart PowerPoint Slide
This PowerPoint slide display chart created with green grass. This image slide has been crafted with graphic of green grass bar graph. This image depicts business. Use this image slide to express views on targets, goals, growth and management in your presentations. This image slide exhibits various information which requires visual aid. Enhance the quality of your presentations using this image.

Business Charts For Statistical Analysis Ppt PowerPoint Presentation Pictures Gridlines
Presenting this set of slides with name business charts for statistical analysis ppt powerpoint presentation pictures gridlines. The topics discussed in these slides are education, growth, pencil bar graph. This is a completely editable PowerPoint presentation and is available for immediate download. Download now and impress your audience.

Chart For Yearly Business Performance Analysis Ppt PowerPoint Presentation Slide Download
Presenting this set of slides with name chart for yearly business performance analysis ppt powerpoint presentation slide download. The topics discussed in these slides are education, growth, pencil bar graph. This is a completely editable PowerPoint presentation and is available for immediate download. Download now and impress your audience.
Five Steps Business Growth Chart With Icons Ppt PowerPoint Presentation Model Sample
Presenting this set of slides with name five steps business growth chart with icons ppt powerpoint presentation model sample. This is a five stage process. The stages in this process are education, growth, pencil bar graph. This is a completely editable PowerPoint presentation and is available for immediate download. Download now and impress your audience.

Dollar Profits Growth PowerPoint Templates And PowerPoint Themes 1012
Deliver amazing Presentations with our above template showing profit and growth bar graph. Adjust the above image in your PPT presentations to visually support your content in your Business PPT slideshows marketing, finance, success and strategy. Deliver amazing presentations to mesmerize your audience.
Business Diagram Icons For Good Marketing Strategy Presentation Template
This power point template has been designed with graphic of bar graph, suitcase and meeting business icons. These business icons are used to display the concept of business result analysis and meeting. Use this diagram for business related topics in any presentations.
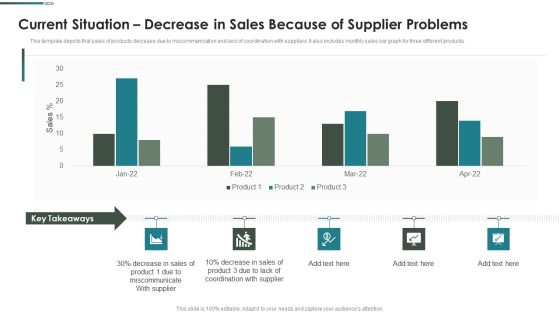
Purchase Assessment Process Current Situation Decrease In Sales Because Of Supplier Problems Sample PDF
This template depicts that sales of products decrease due to miscommunication and lack of coordination with suppliers. It also includes monthly sales bar graph for three different products.Deliver an awe inspiring pitch with this creative Purchase Assessment Process Current Situation Decrease In Sales Because Of Supplier Problems Sample PDF bundle. Topics like Coordination Supplier, Miscommunicate Supplier, Decrease Sale can be discussed with this completely editable template. It is available for immediate download depending on the needs and requirements of the user.

Current Situation Decrease In Sales Because Of Supplier Problems Mockup PDF
This template depicts that sales of products decrease due to miscommunication and lack of coordination with suppliers. It also includes monthly sales bar graph for three different products.Deliver and pitch your topic in the best possible manner with this Current Situation Decrease In Sales Because Of Supplier Problems Mockup PDF. Use them to share invaluable insights on Miscommunicate, Supplier, Coordination and impress your audience. This template can be altered and modified as per your expectations. So, grab it now.

Current Situation Decrease In Sales Because Of Supplier Problems Download PDF
This template depicts that sales of products decrease due to miscommunication and lack of coordination with suppliers. It also includes monthly sales bar graph for three different products.Deliver and pitch your topic in the best possible manner with this Current Situation Decrease In Sales Because Of Supplier Problems Download PDF. Use them to share invaluable insights on Coordination Supplier, Key Takeaways, Miscommunicate Supplier and impress your audience. This template can be altered and modified as per your expectations. So, grab it now.
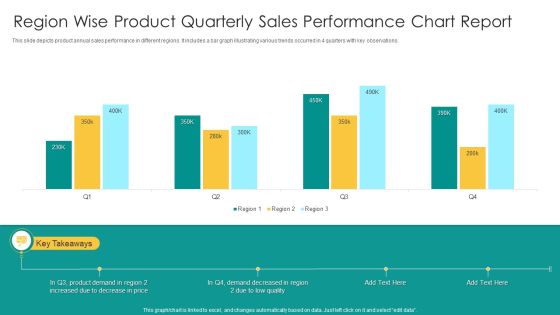
Region Wise Product Quarterly Sales Performance Chart Report Topics PDF
This slide depicts product annual sales performance in different regions. It includes a bar graph illustrating various trends occurred in 4 quarters with key observations. Showcasing this set of slides titled Region Wise Product Quarterly Sales Performance Chart Report Topics PDF. The topics addressed in these templates are Product Demand, Price, Low Quality. All the content presented in this PPT design is completely editable. Download it and make adjustments in color, background, font etc. as per your unique business setting.
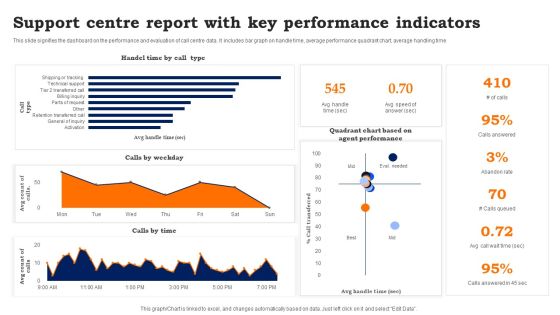
Support Centre Report With Key Performance Indicators Information PDF
This slide signifies the dashboard on the performance and evaluation of call centre data. It includes bar graph on handle time, average performance quadrant chart, average handling time. Showcasing this set of slides titled Support Centre Report With Key Performance Indicators Information PDF. The topics addressed in these templates are Support Centre Report, Key Performance Indicators. All the content presented in this PPT design is completely editable. Download it and make adjustments in color, background, font etc. as per your unique business setting.
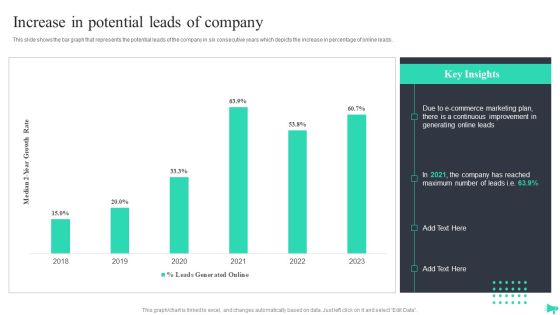
Implementing Ecommerce Marketing Services Plan Increase In Potential Leads Of Company Elements PDF
This slide shows the bar graph that represents the potential leads of the company in six consecutive years which depicts the increase in percentage of online leads. There are so many reasons you need a Implementing Ecommerce Marketing Services Plan Increase In Potential Leads Of Company Elements PDF. The first reason is you can not spend time making everything from scratch, Thus, Slidegeeks has made presentation templates for you too. You can easily download these templates from our website easily.
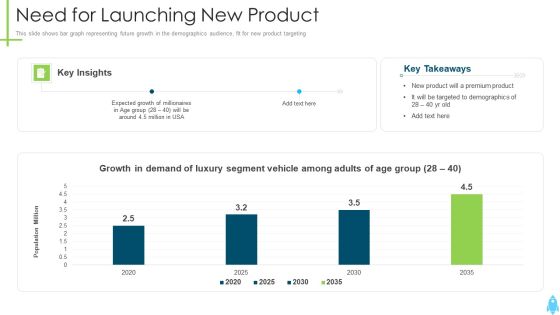
Product Kick Off Strategy Need For Launching New Product Microsoft PDF
This slide shows bar graph representing future growth in the demographics audience, fit for new product targeting. Deliver and pitch your topic in the best possible manner with this product kick off strategy need for launching new product microsoft pdf. Use them to share invaluable insights on growth, segment, targeted, demographics and impress your audience. This template can be altered and modified as per your expectations. So, grab it now.
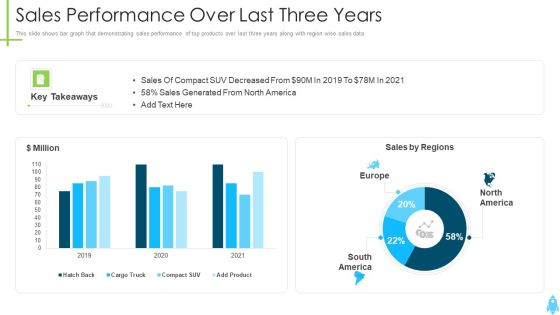
Product Kick Off Strategy Sales Performance Over Last Three Years Formats PDF
This slide shows bar graph that demonstrating sales performance of top products over last three years along with region wise sales data. Deliver an awe inspiring pitch with this creative product kick off strategy sales performance over last three years formats pdf bundle. Topics like sales performance over last three years can be discussed with this completely editable template. It is available for immediate download depending on the needs and requirements of the user.
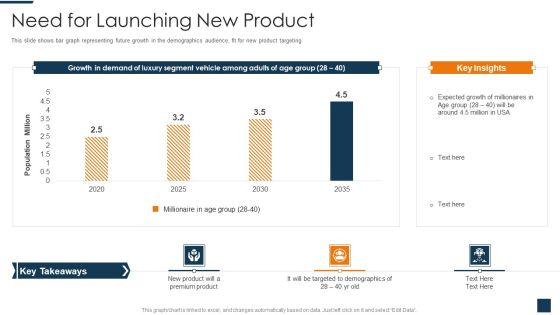
Go To Market Strategy For New Product Need For Launching New Product Demonstration PDF
This slide shows bar graph representing future growth in the demographics audience, fit for new product targeting. Deliver and pitch your topic in the best possible manner with this go to market strategy for new product need for launching new product demonstration pdf. Use them to share invaluable insights on need for launching new product and impress your audience. This template can be altered and modified as per your expectations. So, grab it now.

Go To Market Strategy For New Product Sales Performance Over Last Three Years Guidelines PDF
This slide shows bar graph that demonstrating sales performance of top products over last three years along with region wise sales data. Deliver an awe inspiring pitch with this creative go to market strategy for new product sales performance over last three years guidelines pdf bundle. Topics like sales performance over last three years can be discussed with this completely editable template. It is available for immediate download depending on the needs and requirements of the user.

Implementation Plan For New Product Launch Sales Performance Over Last Three Years Guidelines PDF
This slide shows bar graph that demonstrating sales performance of top products over last three years along with region wise sales data. Deliver an awe inspiring pitch with this creative implementation plan for new product launch sales performance over last three years guidelines pdf bundle. Topics like sales performance over last three years can be discussed with this completely editable template. It is available for immediate download depending on the needs and requirements of the user.
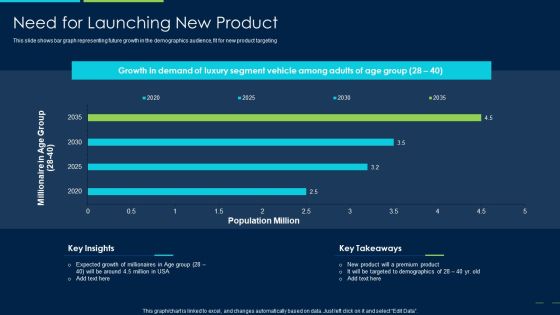
Marketing Strategy New Product Introduction Need For Launching New Product Diagrams PDF
This slide shows bar graph representing future growth in the demographics audience, fit for new product targeting Deliver an awe inspiring pitch with this creative marketing strategy new product introduction need for launching new product diagrams pdf bundle. Topics like need for launching new product can be discussed with this completely editable template. It is available for immediate download depending on the needs and requirements of the user.
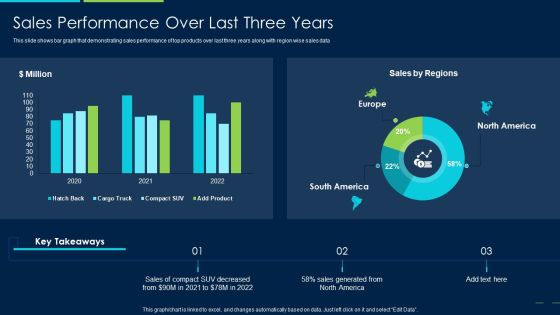
Marketing Strategy New Product Introduction Sales Performance Over Last Three Years Slides PDF
This slide shows bar graph that demonstrating sales performance of top products over last three years along with region wise sales data Deliver and pitch your topic in the best possible manner with this marketing strategy new product introduction sales performance over last three years slides pdf. Use them to share invaluable insights on sales performance over last three years and impress your audience. This template can be altered and modified as per your expectations. So, grab it now.
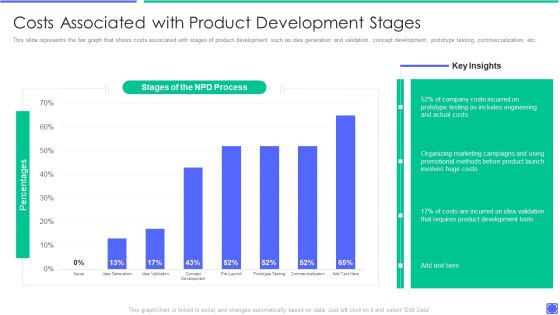
Best Techniques To Enhance New Product Management Efficiency Costs Associated With Product Formats PDF
This slide represents the bar graph that shows costs associated with stages of product development such as idea generation and validation, concept development, prototype testing, commercialization, etc. Deliver an awe inspiring pitch with this creative best techniques to enhance new product management efficiency comparing product metrics themes pdf bundle. Topics like costs associated with product development stages can be discussed with this completely editable template. It is available for immediate download depending on the needs and requirements of the user.

Approaches For New Product Release Need For Launching New Product In Market Ideas PDF
This slide shows bar graph representing future growth in the demographics audience, fit for new product targeting Deliver and pitch your topic in the best possible manner with this approaches for new product release need for launching new product in market ideas pdf. Use them to share invaluable insights on need for launching new product in market and impress your audience. This template can be altered and modified as per your expectations. So, grab it now.

Approaches For New Product Release Sales Performance Over Last Three Years Graphics PDF
This slide shows bar graph that demonstrating sales performance of top products over last three years along with region wise sales data Deliver an awe inspiring pitch with this creative approaches for new product release sales performance over last three years graphics pdf bundle. Topics like sales performance over last three years can be discussed with this completely editable template. It is available for immediate download depending on the needs and requirements of the user.
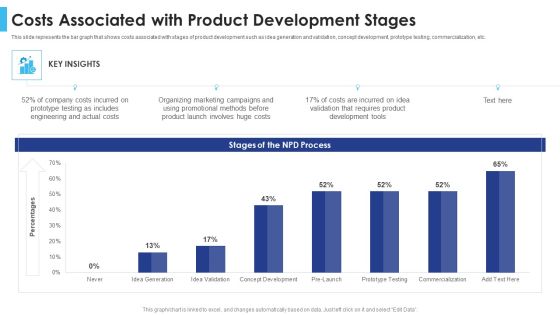
Satisfying Consumers Through Strategic Product Building Plan Costs Associated With Product Development Stages Brochure PDF
This slide represents the bar graph that shows costs associated with stages of product development such as idea generation and validation, concept development, prototype testing, commercialization, etc. Deliver an awe inspiring pitch with this creative satisfying consumers through strategic product building plan costs associated with product development stages brochure pdf bundle. Topics like costs associated with product development stages can be discussed with this completely editable template. It is available for immediate download depending on the needs and requirements of the user.

Comparative Analysis In Digital Transformation Statistics Graphics PDF
This slide signifies the comparative assessment of digital transformation trends. It includes bar graph with governance and compliance, IT security, automation, cost saving and data analytics. Showcasing this set of slides titled comparative analysis in digital transformation statistics graphics pdf. The topics addressed in these templates are data analytics, cost saving, improve customer experience. All the content presented in this PPT design is completely editable. Download it and make adjustments in color, background, font etc. as per your unique business setting.

Strategic B2B Marketing Plan Technological Investment Priorities To Achieve Marketing Goals Inspiration PDF
This slide shows the bar graph that represents the priorities of company for making investments in technology such as automation system, data management platform, etc.Deliver an awe inspiring pitch with this creative strategic b2b marketing plan technological investment priorities to achieve marketing goals inspiration pdf bundle. Topics like measurement and analytics, marketing automation platform, data management platform can be discussed with this completely editable template. It is available for immediate download depending on the needs and requirements of the user.
Export Management Company Profile Revenue And Profit Of Trading Company Icons PDF
This slide highlights the revenue and profit of trading company in bar graph format which includes data from last 5 years from financial year 2018 to 2022. Deliver an awe inspiring pitch with this creative Export Management Company Profile Revenue And Profit Of Trading Company Icons PDF bundle. Topics like Revenue, Profit can be discussed with this completely editable template. It is available for immediate download depending on the needs and requirements of the user.

Quality Improvement In Healthcare Institutions And Hospitals Ideas PDF
This slide shows a bar graph of quality improvement in healthcare institutions. Main components covered are patient satisfaction, reducing readmissions and cost savings.Showcasing this set of slides titled Quality Improvement In Healthcare Institutions And Hospitals Ideas PDF The topics addressed in these templates are Improvement Initiatives, Healthcare Institutes ,Focusing Improving All the content presented in this PPT design is completely editable. Download it and make adjustments in color, background, font etc. as per your unique business setting.
 Home
Home