Bar Graph
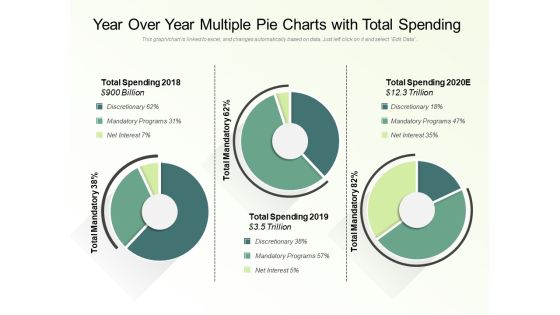
YOY Various Pie Graphs With Total Spending Ppt PowerPoint Presentation Ideas Gridlines PDF
Showcasing this set of slides titled yoy various pie graphs with total spending ppt powerpoint presentation ideas gridlines pdf. The topics addressed in these templates are total spending 2018, total mandatory, total spending 2019, total spending 2020. All the content presented in this PPT design is completely editable. Download it and make adjustments in color, background, font etc. as per your unique business setting.
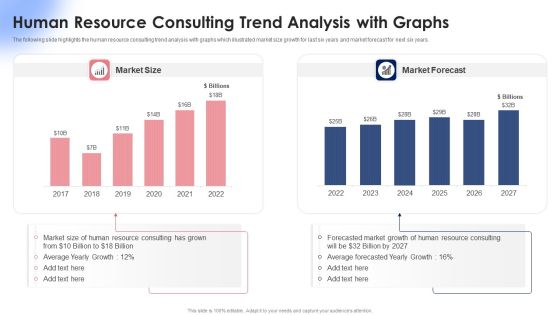
Human Resource Consulting Trend Analysis With Graphs Ppt Summary Clipart Images PDF
The following slide highlights the human resource consulting trend analysis with graphs which illustrated market size growth for last six years and market forecast for next six years. Pitch your topic with ease and precision using this Human Resource Consulting Trend Analysis With Graphs Ppt Summary Clipart Images PDF. This layout presents information on Market Size, Market Forecast, 2017 To 2022. It is also available for immediate download and adjustment. So, changes can be made in the color, design, graphics or any other component to create a unique layout.

Human Resource Annual Report With Statistical Graphs Ppt PowerPoint Presentation Infographics Shapes PDF
Presenting this set of slides with name human resource annual report with statistical graphs ppt powerpoint presentation infographics shapes pdf. The topics discussed in these slides are hiring actions, depart employment, promotions, transfer, demotions, 2017 to 2020. This is a completely editable PowerPoint presentation and is available for immediate download. Download now and impress your audience.
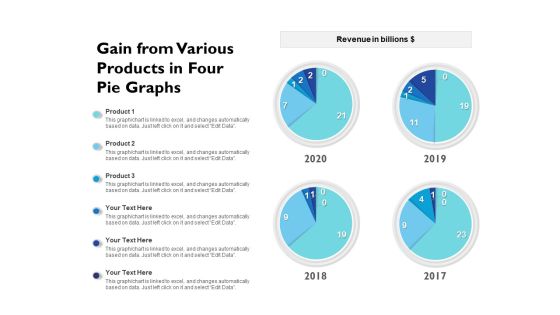
Gain From Various Products In Four Pie Graphs Ppt PowerPoint Presentation Gallery Example Introduction PDF
Pitch your topic with ease and precision using this gain from various products in four pie graphs ppt powerpoint presentation gallery example introduction pdf. This layout presents information on 2017 to 2020. It is also available for immediate download and adjustment. So, changes can be made in the color, design, graphics or any other component to create a unique layout.
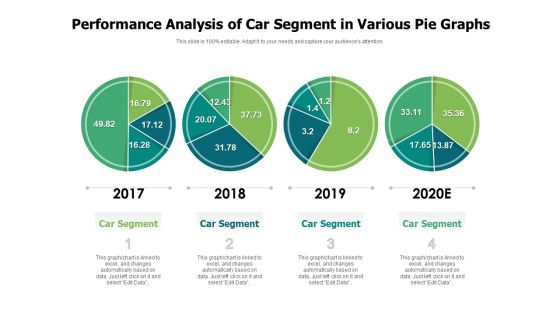
Performance Analysis Of Car Segment In Various Pie Graphs Ppt PowerPoint Presentation Professional Example PDF
Pitch your topic with ease and precision using this performance analysis of car segment in various pie graphs ppt powerpoint presentation professional example pdf. This layout presents information on 2017 to 2020, car segment. It is also available for immediate download and adjustment. So, changes can be made in the color, design, graphics or any other component to create a unique layout.
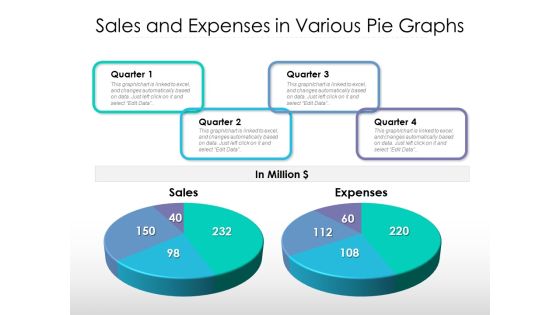
Sales And Expenses In Various Pie Graphs Ppt PowerPoint Presentation Ideas Backgrounds PDF
Pitch your topic with ease and precision using this sales and expenses in various pie graphs ppt powerpoint presentation ideas backgrounds pdf. This layout presents information on sales, expenses, quarter. It is also available for immediate download and adjustment. So, changes can be made in the color, design, graphics or any other component to create a unique layout.
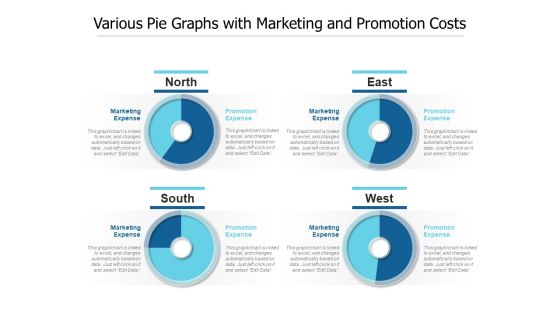
Various Pie Graphs With Marketing And Promotion Costs Ppt PowerPoint Presentation Summary Graphics Design PDF
Pitch your topic with ease and precision using this various pie graphs with marketing and promotion costs ppt powerpoint presentation summary graphics design pdf. This layout presents information on marketing expense, promotion expense. It is also available for immediate download and adjustment. So, changes can be made in the color, design, graphics or any other component to create a unique layout.

Competitors Analysis Charts Graphs To Display Data Company Profiles Ppt PowerPoint Presentation Outline Visual Aids
This is a competitors analysis charts graphs to display data company profiles ppt powerpoint presentation outline visual aids. This is a five stage process. The stages in this process are finance, analysis, business, investment, marketing.
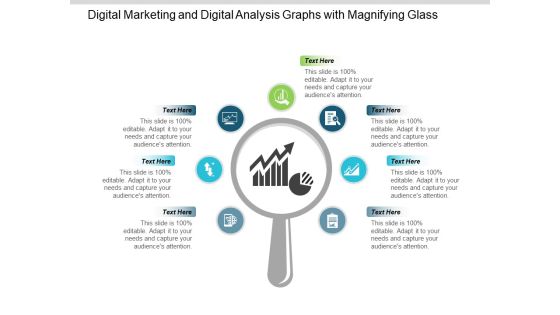
Digital Marketing And Digital Analysis Graphs With Magnifying Glass Ppt PowerPoint Presentation Portfolio Show
This is a digital marketing and digital analysis graphs with magnifying glass ppt powerpoint presentation portfolio show. This is a seven stage process. The stages in this process are digital analytics, digital dashboard, marketing.

Business Sales Analysis Charts And Graphs Ppt PowerPoint Presentation File Deck PDF
Presenting business sales analysis charts and graphs ppt powerpoint presentation file deck pdf to dispense important information. This template comprises three stages. It also presents valuable insights into the topics including business sales analysis charts and graphs. This is a completely customizable PowerPoint theme that can be put to use immediately. So, download it and address the topic impactfully.
Sales Performance Report With Charts And Graphs Ppt PowerPoint Presentation Icon Master Slide PDF
Presenting sales performance report with charts and graphs ppt powerpoint presentation icon master slide pdf to dispense important information. This template comprises three stages. It also presents valuable insights into the topics including sales performance report with charts and graphs. This is a completely customizable PowerPoint theme that can be put to use immediately. So, download it and address the topic impactfully.

Comparison Between Two Graphs On Board Icon Ppt Portfolio Professional PDF
Presenting Comparison Between Two Graphs On Board Icon Ppt Portfolio Professional PDF to dispense important information. This template comprises three stages. It also presents valuable insights into the topics including comparison between two graphs on board icon. This is a completely customizable PowerPoint theme that can be put to use immediately. So, download it and address the topic impactfully.

Business Historical And Forecasted Sales Graphs Ppt PowerPoint Presentation Ideas Themes PDF
Showcasing this set of slides titled business historical and forecasted sales graphs ppt powerpoint presentation ideas themes pdf. The topics addressed in these templates are business historical and forecasted sales graphs. All the content presented in this PPT design is completely editable. Download it and make adjustments in color, background, font etc. as per your unique business setting.
HR Recruitment Dashboard Kpis Icon With Graphs Ppt Slides Slideshow PDF
Presenting HR Recruitment Dashboard Kpis Icon With Graphs Ppt Slides Slideshow PDF to dispense important information. This template comprises three stages. It also presents valuable insights into the topics including HR Recruitment, Dashboard Kpis Icon, Graphs. This is a completely customizable PowerPoint theme that can be put to use immediately. So, download it and address the topic impactfully.
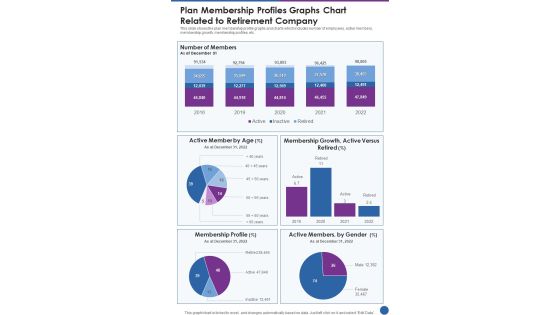
Plan Membership Profiles Graphs Chart Related To Retirement Company One Pager Documents
This slide shows the plan membership profile graphs and charts which includes number of employees, active members, membership growth, membership profiles, etc. Presenting you a fantastic Plan Membership Profiles Graphs Chart Related To Retirement Company One Pager Documents. This piece is crafted on hours of research and professional design efforts to ensure you have the best resource. It is completely editable and its design allow you to rehash its elements to suit your needs. Get this Plan Membership Profiles Graphs Chart Related To Retirement Company One Pager Documents A4 One-pager now.

Operational Review Shown With Graphs And Charts Ppt PowerPoint Presentation Summary Examples PDF
Presenting this set of slides with name operational review shown with graphs and charts ppt powerpoint presentation summary examples pdf. This is a three stage process. The stages in this process are operational review shown with graphs and charts. This is a completely editable PowerPoint presentation and is available for immediate download. Download now and impress your audience.

Charts And Graphs For Business Analytics Ppt PowerPoint Presentation File Background Designs PDF
Presenting this set of slides with name charts and graphs for business analytics ppt powerpoint presentation file background designs pdf. The topics discussed in these slide is charts and graphs for business analytics. This is a completely editable PowerPoint presentation and is available for immediate download. Download now and impress your audience.
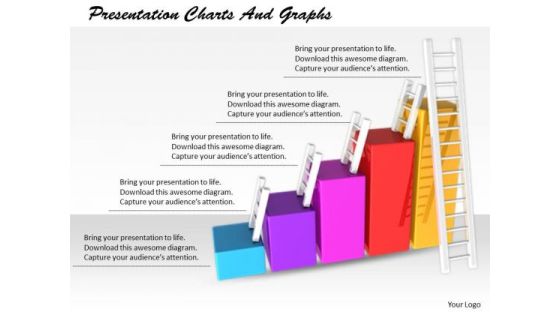
Stock Photo Innovative Marketing Concepts Presentation Charts And Graphs Business Clipart
Put In A Dollop Of Our stock photo innovative marketing concepts presentation charts and graphs business clipart Powerpoint Templates. Give Your Thoughts A Distinctive Flavor. Create Your Domain With Our Success Powerpoint Templates. Rule Minds With Your Thoughts.

Knowledge Graphs The Next Reincarnation Of The Semantic Web Introduction PDF
This slide depicts the overview of knowledge graphs which are the next level of the semantic web, and they bring semantic web prototype to the workplace. It also includes that ontologies are used in business knowledge graphs for creating diverse conceptual models. Are you searching for a Knowledge Graphs The Next Reincarnation Of The Semantic Web Introduction PDF that is uncluttered, straightforward, and original Its easy to edit, and you can change the colors to suit your personal or business branding. For a presentation that expresses how much effort you have put in, this template is ideal With all of its features, including tables, diagrams, statistics, and lists, its perfect for a business plan presentation. Make your ideas more appealing with these professional slides. Download Knowledge Graphs The Next Reincarnation Of The Semantic Web Introduction PDF from Slidegeeks today.
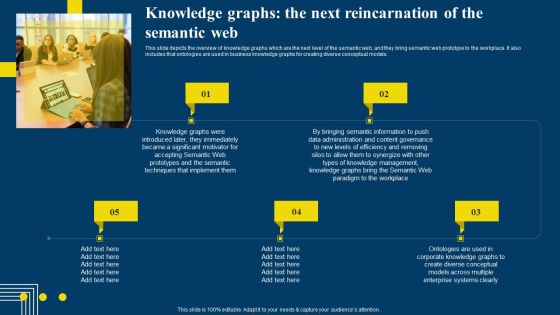
Semantic Web Business Framework Advantages IT Knowledge Graphs The Next Reincarnation Themes PDF
This slide depicts the overview of knowledge graphs which are the next level of the semantic web, and they bring semantic web prototype to the workplace. It also includes that ontologies are used in business knowledge graphs for creating diverse conceptual models. Explore a selection of the finest Semantic Web Business Framework Advantages IT Knowledge Graphs The Next Reincarnation Themes PDF here. With a plethora of professionally designed and pre-made slide templates, you can quickly and easily find the right one for your upcoming presentation. You can use our Semantic Web Business Framework Advantages IT Knowledge Graphs The Next Reincarnation Themes PDF to effectively convey your message to a wider audience. Slidegeeks has done a lot of research before preparing these presentation templates. The content can be personalized and the slides are highly editable. Grab templates today from Slidegeeks.
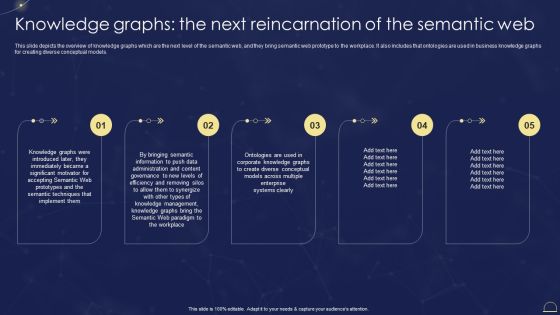
Semantic Web Technologies Knowledge Graphs The Next Reincarnation Of The Rules PDF
This slide depicts the overview of knowledge graphs which are the next level of the semantic web, and they bring semantic web prototype to the workplace. It also includes that ontologies are used in business knowledge graphs for creating diverse conceptual models. Whether you have daily or monthly meetings, a brilliant presentation is necessary. Semantic Web Technologies Knowledge Graphs The Next Reincarnation Of The Rules PDF can be your best option for delivering a presentation. Represent everything in detail using Semantic Web Technologies Knowledge Graphs The Next Reincarnation Of The Rules PDF and make yourself stand out in meetings. The template is versatile and follows a structure that will cater to your requirements. All the templates prepared by Slidegeeks are easy to download and edit. Our research experts have taken care of the corporate themes as well. So, give it a try and see the results.
Managers Conducting Corporate Intelligence Analysis Using Data Graphs Ppt Icon Structure PDF
This is a managers conducting corporate intelligence analysis using data graphs ppt icon structure pdf template with various stages. Focus and dispense information on three stages using this creative set, that comes with editable features. It contains large content boxes to add your information on topics like managers conducting corporate intelligence analysis using data graphs. You can also showcase facts, figures, and other relevant content using this PPT layout. Grab it now.

Semantic Web Fundamentals Knowledge Graphs The Next Reincarnation Of The Semantic Web Mockup PDF
This slide depicts the overview of knowledge graphs which are the next level of the semantic web, and they bring semantic web prototype to the workplace. It also includes that ontologies are used in business knowledge graphs for creating diverse conceptual models. Make sure to capture your audiences attention in your business displays with our gratis customizable Semantic Web Fundamentals Knowledge Graphs The Next Reincarnation Of The Semantic Web Mockup PDF. These are great for business strategies, office conferences, capital raising or task suggestions. If you desire to acquire more customers for your tech business and ensure they stay satisfied, create your own sales presentation with these plain slides.

Financial Charts And Graphs For Statistical Analysis Ppt Powerpoint Presentation Show Layout
This is a financial charts and graphs for statistical analysis ppt powerpoint presentation show layout. This is a four stage process. The stages in this process are business metrics, business kpi, business dashboard.
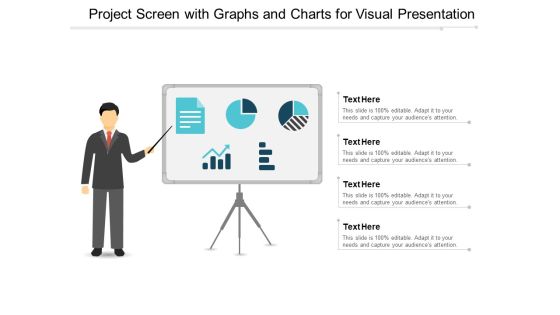
Project Screen With Graphs And Charts For Visual Presentation Ppt PowerPoint Presentation Gallery Design Inspiration
This is a project screen with graphs and charts for visual presentation ppt powerpoint presentation gallery design inspiration. This is a four stage process. The stages in this process are visual aids, communication, business.
Project Efficiency Status Dashboard Icon With Graphs And Charts Demonstration PDF
Persuade your audience using this Project Efficiency Status Dashboard Icon With Graphs And Charts Demonstration PDF. This PPT design covers three stages, thus making it a great tool to use. It also caters to a variety of topics including Project Efficiency Status Dashboard Icon WITH Graphs AND Charts. Download this PPT design now to present a convincing pitch that not only emphasizes the topic but also showcases your presentation skills.

Security KPI Dashboard With Various Charts And Graphs Ppt Summary Background Image PDF
Persuade your audience using this Security KPI Dashboard With Various Charts And Graphs Ppt Summary Background Image PDF. This PPT design covers three stages, thus making it a great tool to use. It also caters to a variety of topics including Various Charts, Security KPI Dashboard, Graphs. Download this PPT design now to present a convincing pitch that not only emphasizes the topic but also showcases your presentation skills.

Consistent Way To Represent The Steps Graphs And Charts PowerPoint Slides
We present our consistent way to represent the steps graphs and charts PowerPoint Slides.Use our Business PowerPoint Templates because, You can Lead your flock steadily to greater heights. Look around at the vast potential of achievement around you Use our Puzzles or Jigsaws PowerPoint Templates because,our template will illustrate what you want to say. Use our Shapes PowerPoint Templates because,You are the Champion of your team shall anoint. Use our Boxes PowerPoint Templates because,The ideas and plans are on your finger tips. Use our Success PowerPoint Templates because,IT outlines the entire thought process for the benefit of others. Tell it to the world with your characteristic aplombUse these PowerPoint slides for presentations relating to account, arrow, arrows, away, box, business, chart, choice, choose, concept, concepts, consultation, corporate, design, diagram, direction, elements, flow, follow, follows, future, group, grow, increase, lines, many, month, report, rise, row, step, success, text, time, timeline, today, up, ways, work, year. The prominent colors used in the PowerPoint template are Brown, Green, Blue. People tell us our consistent way to represent the steps graphs and charts PowerPoint Slides will help you be quick off the draw. Just enter your specific text and see your points hit home. The feedback we get is that our arrows PowerPoint templates and PPT Slides are second to none. People tell us our consistent way to represent the steps graphs and charts PowerPoint Slides are Cheerful. Presenters tell us our chart PowerPoint templates and PPT Slides are Charming. The feedback we get is that our consistent way to represent the steps graphs and charts PowerPoint Slides are Pretty. Professionals tell us our away PowerPoint templates and PPT Slides are Exuberant.

Semantic Data Searching Technique Knowledge Graphs The Next Reincarnation Of The Semantic Web Infographics PDF
This slide depicts the overview of knowledge graphs which are the next level of the semantic web, and they bring semantic web prototype to the workplace. It also includes that ontologies are used in business knowledge graphs for creating diverse conceptual models. Welcome to our selection of the Semantic Data Searching Technique Knowledge Graphs The Next Reincarnation Of The Semantic Web Infographics PDF. These are designed to help you showcase your creativity and bring your sphere to life. Planning and Innovation are essential for any business that is just starting out. This collection contains the designs that you need for your everyday presentations. All of our PowerPoints are 100 percent editable, so you can customize them to suit your needs. This multi purpose template can be used in various situations. Grab these presentation templates today.
Continuous Enhancement Icon Process Graphs Ppt PowerPoint Presentation Complete Deck With Slides
This continuous enhancement icon process graphs ppt powerpoint presentation complete deck with slides acts as backup support for your ideas, vision, thoughts, etc. Use it to present a thorough understanding of the topic. This PPT slideshow can be utilized for both in-house and outside presentations depending upon your needs and business demands. Entailing thirteen slides with a consistent design and theme, this template will make a solid use case. As it is intuitively designed, it suits every business vertical and industry. All you have to do is make a few tweaks in the content or any other component to design unique presentations. The biggest advantage of this complete deck is that it can be personalized multiple times once downloaded. The color, design, shapes, and other elements are free to modify to add personal touches. You can also insert your logo design in this PPT layout. Therefore a well-thought and crafted presentation can be delivered with ease and precision by downloading this continuous enhancement icon process graphs ppt powerpoint presentation complete deck with slides PPT slideshow.
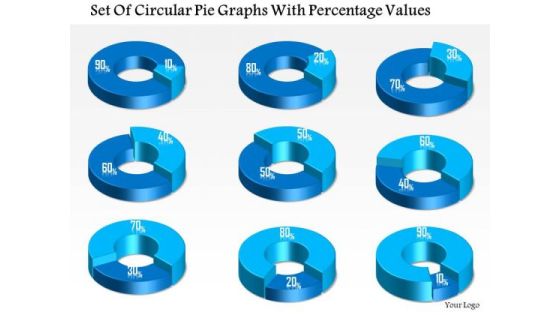
Business Diagram Set Of Circular Pie Graphs With Percentage Values Presentation Template
This business diagram displays set of pie charts. This Power Point template has been designed to compare and present business data. Download this diagram to represent stages of business growth.

Client Referrals Ppt PowerPoint Presentation Tips
This is a client referrals ppt powerpoint presentation tips. This is a three stage process. The stages in this process are business, marketing, management, bar graph, line bar.

Market Share Of Old And New Products In Various Pie Graphs Ppt PowerPoint Presentation Styles Example PDF
Showcasing this set of slides titled market share of old and new products in various pie graphs ppt powerpoint presentation styles example pdf. The topics addressed in these templates are old product, new product, 2015 to 2020. All the content presented in this PPT design is completely editable. Download it and make adjustments in color, background, font etc. as per your unique business setting.

Business Teamwork Communication PowerPoint Templates And PowerPoint Backgrounds 0611
Microsoft Powerpoint Template and Background with cartoon of business executives climbing a bar graph and using teamwork to ascend the obstacle

Business Teamwork Success PowerPoint Templates And PowerPoint Backgrounds 1011
Microsoft PowerPoint Template and Background with cartoon of business executives climbing a bar graph and using teamwork to ascend the obstacle
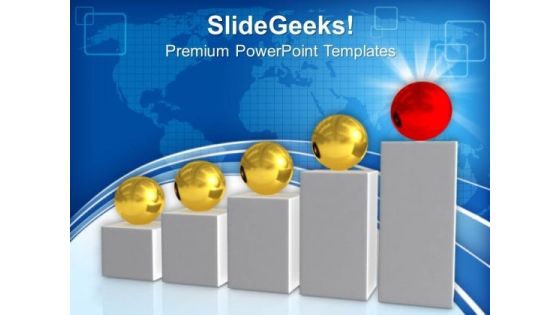
Conceptual Image Of Teamwork Leadership PowerPoint Templates And PowerPoint Themes 0812
Conceptual Image Of Teamwork Leadership PowerPoint Templates And PowerPoint Themes 0812-Microsoft Powerpoint Templates and Background with bar graph and red ball shows teamwork and leadership

Business Teamwork Communication PowerPoint Themes And PowerPoint Slides 0611
Microsoft Powerpoint Theme and Slide with cartoon of business executives climbing a bar graph and using teamwork to ascend the obstacle

Concept Of Ontology In The Semantic Web Knowledge Graphs The Next Reincarnation Of The Semantic Web Sample PDF
This slide depicts the overview of knowledge graphs which are the next level of the semantic web, and they bring semantic web prototype to the workplace. It also includes that ontologies are used in business knowledge graphs for creating diverse conceptual models. Formulating a presentation can take up a lot of effort and time, so the content and message should always be the primary focus. The visuals of the PowerPoint can enhance the presenters message, so our Concept Of Ontology In The Semantic Web Knowledge Graphs The Next Reincarnation Of The Semantic Web Sample PDF was created to help save time. Instead of worrying about the design, the presenter can concentrate on the message while our designers work on creating the ideal templates for whatever situation is needed. Slidegeeks has experts for everything from amazing designs to valuable content, we have put everything into Concept Of Ontology In The Semantic Web Knowledge Graphs The Next Reincarnation Of The Semantic Web Sample PDF.

Clustered Column Line Ppt PowerPoint Presentation Samples
This is a clustered column line ppt powerpoint presentation samples. This is a four stage process. The stages in this process are finance, percentage, success, growth, bar graph.

Column Chart Ppt PowerPoint Presentation Professional Template
This is a column chart ppt powerpoint presentation professional template. This is a two stage process. The stages in this process are product, percentage, finance, bar graph, growth.

Column Chart Ppt PowerPoint Presentation Layouts Images
This is a column chart ppt powerpoint presentation layouts images. This is a two stage process. The stages in this process are product, column chart, bar graph, marketing.

Column Chart Ppt PowerPoint Presentation Professional Layouts
This is a column chart ppt powerpoint presentation professional layouts. This is a six stage process. The stages in this process are bar graph, business, marketing, finance, planning.

Column Chart Ppt PowerPoint Presentation Summary Maker
This is a column chart ppt powerpoint presentation summary maker. This is a two stage process. The stages in this process are business, marketing, product, bar graph, years.

Column Chart Ppt PowerPoint Presentation Portfolio Clipart
This is a column chart ppt powerpoint presentation portfolio clipart. This is a two stage process. The stages in this process are bar graph, growth, success, product, dollars.

Column Chart Ppt PowerPoint Presentation Show Images
This is a column chart ppt powerpoint presentation show images. This is a two stage process. The stages in this process are product, expenditure, years, bar graph, growth.

Area Chart Ppt PowerPoint Presentation Icon Gallery
This is a area chart ppt powerpoint presentation icon gallery. This is a two stage process. The stages in this process are sales in percentage, product, bar graph.

Combo Chart Ppt PowerPoint Presentation Infographics Ideas
This is a combo chart ppt powerpoint presentation infographics ideas. This is a four stage process. The stages in this process are bar graph, marketing, strategy, finance, analysis.

Column Chart Ppt PowerPoint Presentation Summary
This is a column chart ppt powerpoint presentation summary. This is a two stage process. The stages in this process are bar graph, marketing, strategy, finance, planning.

Column Chart Ppt PowerPoint Presentation Model Layout Ideas
This is a column chart ppt powerpoint presentation model layout ideas. This is a two stage process. The stages in this process are product, column chart, bar graph.

Clustered Column Ppt PowerPoint Presentation Infographic Template
This is a clustered column ppt powerpoint presentation infographic template. This is a two stage process. The stages in this process are finance, percentage, bar graph, business, marketing.

Clustered Column Ppt PowerPoint Presentation Styles Templates
This is a clustered column ppt powerpoint presentation styles templates. This is a two stage process. The stages in this process are product, profit, bar graph.

Gross Margin Improvement Ppt PowerPoint Presentation Layout
This is a gross margin improvement ppt powerpoint presentation layout. This is a two stage process. The stages in this process are chart, bar graph, success, growth, marketing.
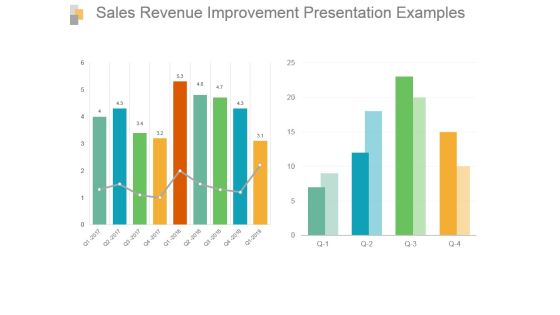
Sales Revenue Improvement Presentation Examples
This is a sales revenue improvement presentation examples. This is a two stage process. The stages in this process are bar graph, growth, sales, data, analysis.
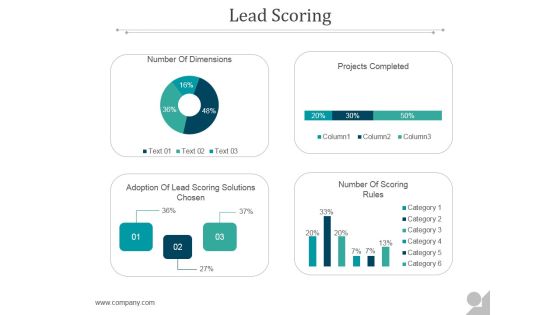
Lead Scoring Ppt PowerPoint Presentation Layouts
This is a lead scoring ppt powerpoint presentation layouts. This is a four stage process. The stages in this process are lead, business, bar graph, marketing, management.
Stacked Column Ppt PowerPoint Presentation Icon Samples
This is a stacked column ppt powerpoint presentation icon samples. This is a nine stage process. The stages in this process are bar graph, business, marketing, success, growth.

Stacked Column Ppt PowerPoint Presentation Outline Information
This is a stacked column ppt powerpoint presentation outline information. This is a two stage process. The stages in this process are profit, product, bar graph, growth, success.

Channel Kpis Ppt PowerPoint Presentation Professional Inspiration
This is a channel kpis ppt powerpoint presentation professional inspiration. This is a four stage process. The stages in this process are bar graph, marketing, finance, strategy, planning.

Financial Highlights Ppt PowerPoint Presentation Gallery Deck
This is a financial highlights ppt powerpoint presentation gallery deck. This is a four stage process. The stages in this process are bar graph, marketing, finance, strategy, planning.

Clustered Column Ppt PowerPoint Presentation Slides Visuals
This is a clustered column ppt powerpoint presentation slides visuals. This is a two stage process. The stages in this process are bar graph, marketing, strategy, finance, planning.
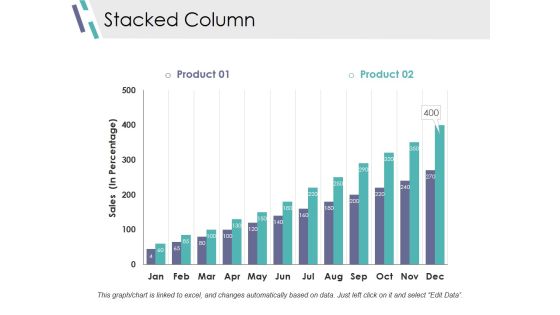
Stacked Column Ppt PowerPoint Presentation Professional Display
This is a stacked column ppt powerpoint presentation professional display. This is a two stage process. The stages in this process are bar graph, marketing, strategy, finance, planning.

Clustered Column Ppt PowerPoint Presentation Professional Styles
This is a clustered column ppt powerpoint presentation professional styles. This is a two stage process. The stages in this process are product, profit, bar graph, growth, success.

Timeline Analysis Ppt PowerPoint Presentation Professional Ideas
This is a timeline analysis ppt powerpoint presentation professional ideas. This is a seven stage process. The stages in this process are process changes, timeline analysis, bar graph.

Sales Projections Ppt PowerPoint Presentation Model Examples
This is a sales projections ppt powerpoint presentation model examples. This is a five stage process. The stages in this process are on sales, in years, bar graph.

Down Arrow Showing Loss Business PowerPoint Templates And PowerPoint Themes 0512
Microsoft Powerpoint Templates and Background with Bar graph down-These templates can be used for presentations relating to-Bar graph down, business, sales, finance, arrows, cylinders-Down Arrow Showing Loss Business PowerPoint Templates And PowerPoint Themes 0512

Campaign Performance Ppt PowerPoint Presentation Deck
This is a campaign performance ppt powerpoint presentation deck. This is a four stage process. The stages in this process are business, bar graph, strategy, growth, success.

Stacked Column Ppt PowerPoint Presentation Files
This is a stacked column ppt powerpoint presentation files. This is a nine stage process. The stages in this process are bar graph, finance, marketing, analysis, business.

Capital Spending Ppt PowerPoint Presentation Graphics
This is a capital spending ppt powerpoint presentation graphics. This is a two stage process. The stages in this process are business, marketing, success, bar graph, management.

Competitive Analysis Ppt PowerPoint Presentation Sample
This is a competitive analysis ppt powerpoint presentation sample. This is a six stage process. The stages in this process are business, marketing, success, bar graph, management.

Area Ppt PowerPoint Presentation Show
This is a area ppt powerpoint presentation show. This is a two stage process. The stages in this process are area, bar graph, growth, years, business.

Bubble Ppt PowerPoint Presentation Guidelines
This is a bubble ppt powerpoint presentation guidelines. This is a five stage process. The stages in this process are bubble, business, bar graph, marketing, presentation.

Financial Report Ppt PowerPoint Presentation Styles Skills
This is a financial report ppt powerpoint presentation styles skills. This is a four stage process. The stages in this process are bar graph, business, marketing, success, growth.

Financial Strength Ppt PowerPoint Presentation Summary Ideas
This is a financial strength ppt powerpoint presentation summary ideas. This is a four stage process. The stages in this process are bar graph, business, marketing, success, growth.

Clustered Column Ppt PowerPoint Presentation Ideas Show
This is a clustered column ppt powerpoint presentation ideas show. This is a two stage process. The stages in this process are product, percentage, finance, business, bar graph.

Clustered Column Ppt PowerPoint Presentation Layouts Ideas
This is a clustered column ppt powerpoint presentation layouts ideas. This is a two stage process. The stages in this process are product, profit, bar graph, growth, finance.

Clustered Column Ppt PowerPoint Presentation Show Introduction
This is a clustered column ppt powerpoint presentation show introduction. This is a two stage process. The stages in this process are product, profit, bar graph.

Leadership01 Success PowerPoint Themes And PowerPoint Slides 0811
Microsoft PowerPoint Theme and Slide with one figure stands atop the highest bar in a graph

Financial Strength Ppt PowerPoint Presentation Shapes
This is a financial strength ppt powerpoint presentation shapes. This is a four stage process. The stages in this process are business, marketing, success, business plan, bar graph.

Client Referrals Ppt PowerPoint Presentation Example 2015
This is a client referrals ppt powerpoint presentation example 2015. This is a three stage process. The stages in this process are business, marketing, management, bar graph, line bar.

Pareto Chart Ppt PowerPoint Presentation Ideas
This is a pareto chart ppt powerpoint presentation ideas. This is a four stage process. The stages in this process are bar graph, finance, marketing, strategy, analysis, business.

Column Chart Ppt PowerPoint Presentation Professional Example
This is a column chart ppt powerpoint presentation professional example. This is a eight stage process. The stages in this process are bar graph, growth, success, business, marketing.

Column Chart Ppt PowerPoint Presentation Infographics Model
This is a column chart ppt powerpoint presentation infographics model. This is a two stage process. The stages in this process are bar graph, growth, product, percentage, year.
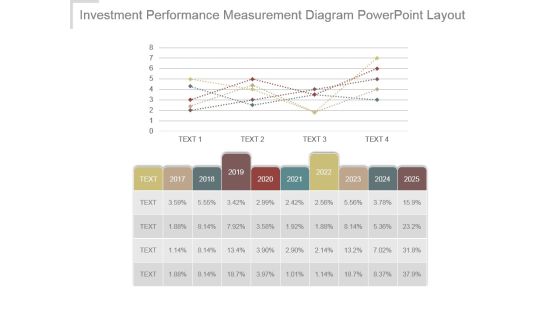
Investment Performance Measurement Diagram Powerpoint Layout
This is a investment performance measurement diagram powerpoint layout. This is a five stage process. The stages in this process are bar graph, growth, success, business, marketing.
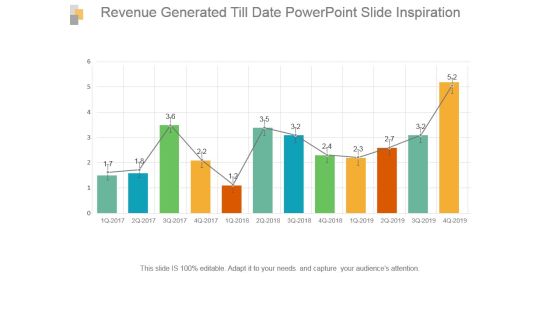
Revenue Generated Till Date Powerpoint Slide Inspiration
This is a revenue generated till date powerpoint slide inspiration. This is a twelve stage process. The stages in this process are bar graph, growth, success, data, analysis.

Clustered Column Ppt PowerPoint Presentation Slide Download
This is a clustered column ppt powerpoint presentation slide download. This is a twelve stage process. The stages in this process are bar graph, marketing, strategy, analysis, business.
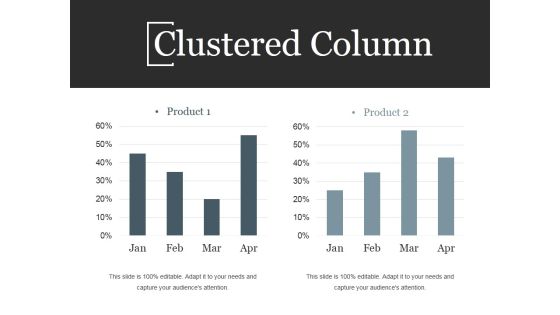
Clustered Column Ppt PowerPoint Presentation Information
This is a clustered column ppt powerpoint presentation information. This is a twelve stage process. The stages in this process are bar graph, business, marketing, growth, success.
Growth Team Ppt PowerPoint Presentation Icon Topics
This is a growth team ppt powerpoint presentation icon topics. This is a five stage process. The stages in this process are bar graph, growth, success, business, marketing.

Stacked Column Ppt PowerPoint Presentation Pictures Outfit
This is a stacked column ppt powerpoint presentation pictures outfit. This is a two stage process. The stages in this process are product, profit, growth, bar graph, success.

Comparison Ppt PowerPoint Presentation Ideas Show
This is a comparison ppt powerpoint presentation ideas show. This is a two stage process. The stages in this process are comparison, bar graph, growth, management, business.
Histogram Column Chart With Red Arrow Vector Icon Ppt PowerPoint Presentation Outline Ideas Cpb
This is a histogram column chart with red arrow vector icon ppt powerpoint presentation outline ideas cpb. This is a three stage process. The stages in this process are bar chart icon, bar graph icon, data chart icon.
Histogram Financial Analysis Vector Icon Ppt PowerPoint Presentation Layouts File Formats Cpb
This is a histogram financial analysis vector icon ppt powerpoint presentation layouts file formats cpb. This is a three stage process. The stages in this process are bar chart icon, bar graph icon, data chart icon.
Histogram Icon Showing Economic Fluctuations Ppt PowerPoint Presentation Slides Samples Cpb
This is a histogram icon showing economic fluctuations ppt powerpoint presentation slides samples cpb. This is a three stage process. The stages in this process are bar chart icon, bar graph icon, data chart icon.
Histogram Showing Business Trends Vector Icon Ppt PowerPoint Presentation Styles Portrait Cpb
This is a histogram showing business trends vector icon ppt powerpoint presentation styles portrait cpb. This is a three stage process. The stages in this process are bar chart icon, bar graph icon, data chart icon.
Histogram With Dollar For Financial Success Vector Icon Ppt PowerPoint Presentation Portfolio Example File Cpb
This is a histogram with dollar for financial success vector icon ppt powerpoint presentation portfolio example file cpb. This is a three stage process. The stages in this process are bar chart icon, bar graph icon, data chart icon.
Histogram With Gear Vector Icon Ppt PowerPoint Presentation Professional Slides Cpb
This is a histogram with gear vector icon ppt powerpoint presentation professional slides cpb. This is a three stage process. The stages in this process are bar chart icon, bar graph icon, data chart icon.
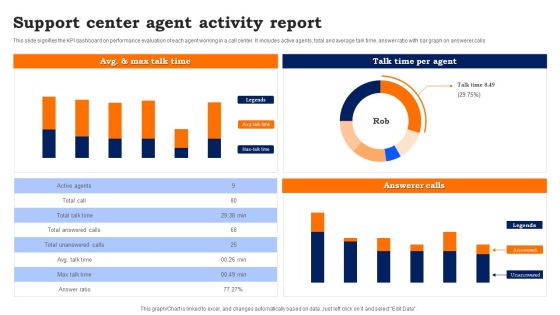
Support Center Agent Activity Report Guidelines PDF
This slide signifies the KPI dashboard on performance evaluation of each agent working in a call center. It includes active agents, total and average talk time, answer ratio with bar graph on answerer calls.
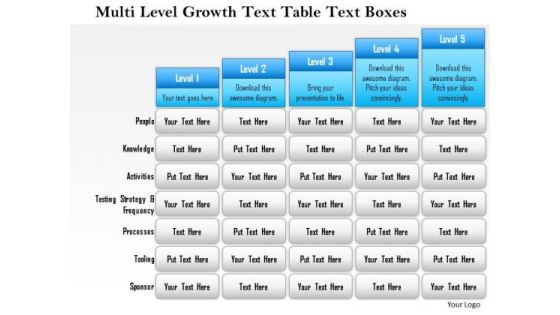
Business Framework Multi Level Growth Text Table Text Boxes 2 PowerPoint Presentation
Five staged text box style chart in bar graph design has been used to decorate this power point template slide. This diagram slide contains the multilevel growth concept. Use this PPT slide for financial growth and result analysis related topics.
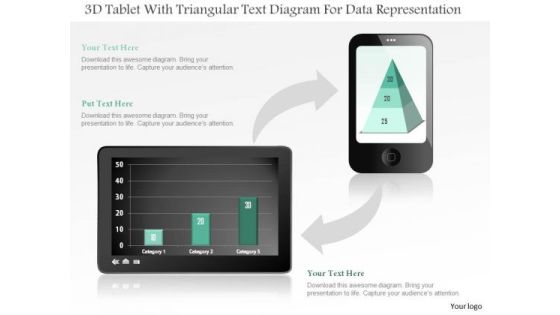
Business Diagram 3d Tablet With Triangular Text Diagram For Data Representation PowerPoint Slide
This business diagram displays bar graph on tablet and pyramid chart on mobile phone. Use this diagram, to make reports for interactive business presentations. Create professional presentations using this diagram.

Business Diagram Four Steps With 3d Business Person Standing Over It PowerPoint Slide
This business diagram displays bar graph with business person standing on it. This Power Point template has been designed to display personal growth. You may use this diagram to impart professional appearance to your presentations.
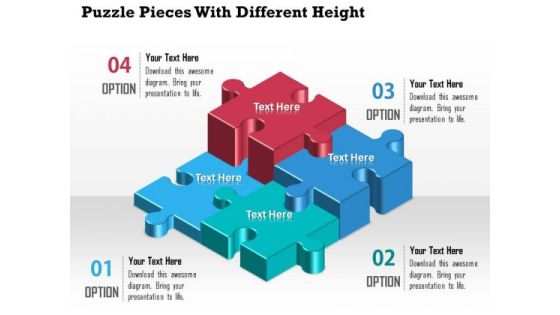
Business Diagram Puzzle Pieces With Different Height Presentation Template
A professional bar graph has been crafted with graphic of puzzles. All these puzzles are in different heights which shows the various levels of any data result representations. Use this diagram for your business result and data analysis related topics.
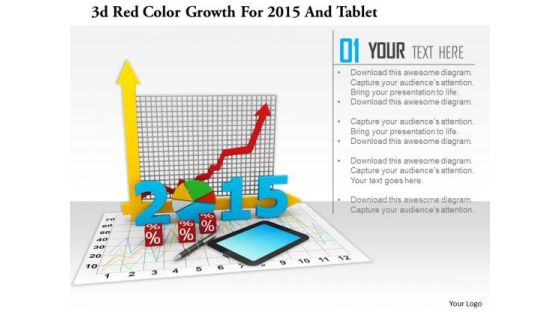
Stock Photo 3d Red Color Growth For 2015 And Tablet PowerPoint Slide
This image slide has graphics of financial charts and reports. This contains bar graph and pie chart to present business reports. Build an innovative presentation using this professional image slide.

Growth Ladder Success PowerPoint Templates And PowerPoint Themes 0512
Microsoft Powerpoint Templates and Background with color bar graph with ladder-Growth Ladder Success PowerPoint Templates And PowerPoint Themes 0512-These PowerPoint designs and slide layouts can be used for themes relating to -Growth ladder success, abstract, background, business, marketing, finance

Growth Business PowerPoint Templates And PowerPoint Themes 0512
Microsoft Powerpoint Templates and Background with color bar graph with ladder-These templates can be used for presentations relating to-Growth ladder success, abstract, ladder, business, marketing, finance-Growth Business PowerPoint Templates And PowerPoint Themes 0512

Growth Success PowerPoint Templates And PowerPoint Themes 0512
Microsoft Powerpoint Templates and Background with color bar graph with ladder-These templates can be used for presentations relating to-Growth ladder success, abstract, ladder, business, marketing, finance-Growth Success PowerPoint Templates And PowerPoint Themes 0512
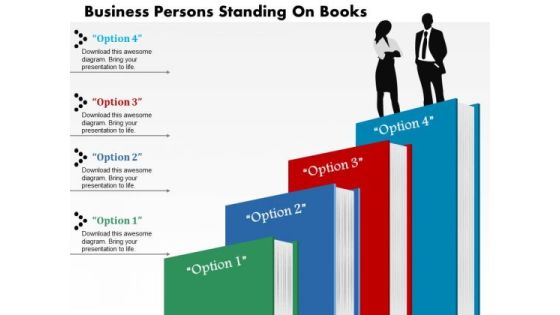
Business Diagram Persons Standing On Books Presentation Slide Template
This power point diagram template has been crafted with graphic of bar graph made with books and 3d man. This diagram template contains the concept of education and success. Use this diagram slide for your business and education presentation.
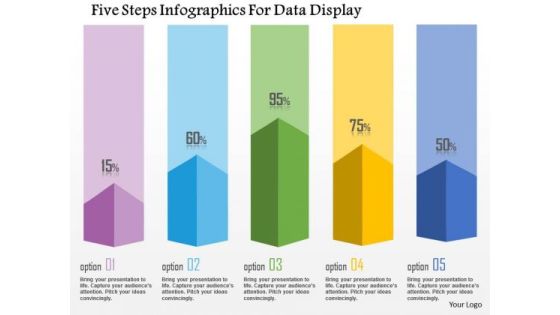
Business Diagram Five Steps Infographics For Data Display Presentation Template
This business diagram has been designed with graphic of five staged info graphics. This diagram can be used to display statistical information. Use this bar graph for your business and sales related presentations.

About Us Companys Data Information Powerpoint Slides
Download this PowerPoint template to create an attention grabbing introductory slide. It contains slide bar graph with employee image. Use this professional slide design to build a good reputation of your company.

0814 Bargraph Of Dollars Bundles With Arrow Graphic Image Graphics For PowerPoint
This unique image has backdrop of bar graph of dollars bundles with growth arrow. This image displays the concept of financial growth. Define the business growth with this suitable image. Use this image to make outstanding presentations

Successful Person Business PowerPoint Templates And PowerPoint Themes 0512
Microsoft Powerpoint Templates and Background with businessman and bar graph-Successful Person Business PowerPoint Templates And PowerPoint Themes 0512-These PowerPoint designs and slide layouts can be used for themes relating to -Businessman and bar graph, finance, people, business, shapes, success
Pie Growth Business PowerPoint Templates And PowerPoint Themes 0612
Pie Growth Business PowerPoint Templates And PowerPoint Themes 0612-Microsoft Powerpoint Templates and Background with bar and pie graph

Leadership01 Success PowerPoint Templates And PowerPoint Backgrounds 0811
Microsoft PowerPoint Template and Background with one figure stands a top the highest bar in a graph

Column Chart Ppt PowerPoint Presentation Summary Introduction
This is a column chart ppt powerpoint presentation summary introduction. This is a two stage process. The stages in this process are business, marketing, bar, graph, finance.

Column Chart Ppt PowerPoint Presentation Model Design Inspiration
This is a column chart ppt powerpoint presentation model design inspiration. This is a three stage process. The stages in this process are business, marketing, bar, graph, plan.

Pitch Deck For Entrepreneurs Raising Money For A New Business Ppt PowerPoint Presentation Complete Deck With Slides
This is a pitch deck for entrepreneurs raising money for a new business ppt powerpoint presentation complete deck with slides. This is a one stage process. The stages in this process are business, growth strategy, marketing, management, bar graph.

Clustered Column Ppt PowerPoint Presentation Summary Topics
This is a clustered column ppt powerpoint presentation summary topics. This is a two stage process. The stages in this process are bar, graph, finance, marketing, strategy.
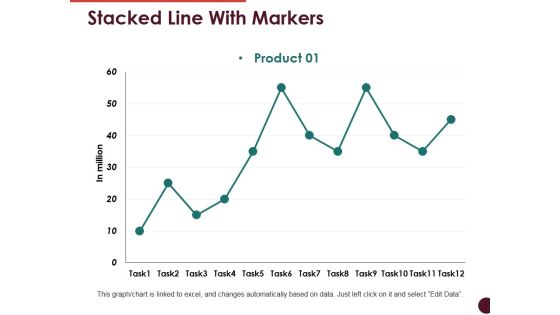
Stacked Line With Markers Ppt PowerPoint Presentation Show Templates
This is a stacked line with markers ppt powerpoint presentation show templates. This is a one stage process. The stages in this process are product, bar graph, growth, success, business.

Clustered Column Line Ppt PowerPoint Presentation Infographic Template Pictures
This is a clustered column line ppt powerpoint presentation infographic template pictures. This is a three stage process. The stages in this process are product, in percentage, bar graph, growth, success.

Clustered Column Line Ppt PowerPoint Presentation Topics
This is a clustered column line ppt powerpoint presentation topics. This is a three stage process. The stages in this process are product, in percentage, growth, bar graph, business.

Clustered Column Line Ppt PowerPoint Presentation Icon Ideas
This is a clustered column line ppt powerpoint presentation icon ideas. This is a three stage process. The stages in this process are product, in percentage, bar graph, success, growth.

Clustered Column Line Ppt PowerPoint Presentation Icon Good
This is a clustered column line ppt powerpoint presentation icon good. This is a three stage process. The stages in this process are product, financial year, bar graph, business, growth.

Clustered Column Line Ppt PowerPoint Presentation Pictures Example
This is a clustered column line ppt powerpoint presentation pictures example. This is a three stage process. The stages in this process are product, in percentage, bar graph, growth, success.
 Home
Home