Bar Graph
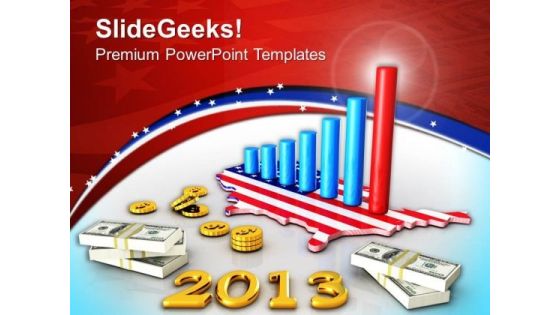
Business Graph With Dollar Money Americana PowerPoint Templates Ppt Backgrounds For Slides 1112
We present our Business Graph With Dollar Money Americana PowerPoint Templates PPT Backgrounds For Slides 1112.Use our New year PowerPoint Templates because presenting your views using our innovative slides, will be assured of leaving a lasting impression. Present our Money PowerPoint Templates because they are Gauranteed to focus the minds of your team. Use our Business PowerPoint Templates because your fledgling career is in the chrysallis stage. Nurture it and watch it grow into a beautiful butterfly. Use our Americana PowerPoint Templates because you have a good idea of the roadmap to your desired destination. Download and present our Success PowerPoint Templates because this can explain the various related aspects of these varied tracks and how they will, on hitting their own targets, cumulatively contribute to hitting GOLD.Use these PowerPoint slides for presentations relating to New year business profit americana, New year, Money, Business, Americana, Success. The prominent colors used in the PowerPoint template are Red, Blue, White. You can be sure our Business Graph With Dollar Money Americana PowerPoint Templates PPT Backgrounds For Slides 1112 are Cheerful. Professionals tell us our business PowerPoint templates and PPT Slides are Majestic. We assure you our Business Graph With Dollar Money Americana PowerPoint Templates PPT Backgrounds For Slides 1112 are Second to none. PowerPoint presentation experts tell us our profit PowerPoint templates and PPT Slides are Efficacious. The feedback we get is that our Business Graph With Dollar Money Americana PowerPoint Templates PPT Backgrounds For Slides 1112 are Beautiful. PowerPoint presentation experts tell us our year PowerPoint templates and PPT Slides are One-of-a-kind.

Computer Tablet With Business Graph Sales PowerPoint Templates Ppt Backgrounds For Slides 1212
We present our Computer Tablet With Business Graph Sales PowerPoint Templates PPT Backgrounds For Slides 1212.Download our Technology PowerPoint Templates because you have the ideas and plans on how to achieve success. Present our Money PowerPoint Templates because you can Show them the way, be Captain of the ship and lead them to new shores. Download our Marketing PowerPoint Templates because The marketplace is the merger of your dreams and your ability. Download and present our Computer PowerPoint Templates because this shows ideas to get the different elements of your Business to mesh and coalesce into a focused team driven by a common goal to achieve the common aim with Excellence. Download our Success PowerPoint Templates because iT outlines the entire thought process for the benefit of others. Tell it to the world with your characteristic aplomb.Use these PowerPoint slides for presentations relating to Modern financial analysis, technology, money, marketing, computer, success. The prominent colors used in the PowerPoint template are Blue, Red, Green. Professionals tell us our Computer Tablet With Business Graph Sales PowerPoint Templates PPT Backgrounds For Slides 1212 provide great value for your money. Be assured of finding the best projection to highlight your words. Use our computer PowerPoint templates and PPT Slides are designed by professionals We assure you our Computer Tablet With Business Graph Sales PowerPoint Templates PPT Backgrounds For Slides 1212 are Bold. We assure you our PowerPoint templates and PPT Slides will make the presenter look like a pro even if they are not computer savvy. Presenters tell us our Computer Tablet With Business Graph Sales PowerPoint Templates PPT Backgrounds For Slides 1212 are Zippy. PowerPoint presentation experts tell us our money PowerPoint templates and PPT Slides are Chic.

Houses Graph Of Dollar Bank Notes Money PowerPoint Templates Ppt Backgrounds For Slides 1212
We present our Houses Graph Of Dollar Bank Notes Money PowerPoint Templates PPT Backgrounds For Slides 1212.Use our Money PowerPoint Templates because it shows how one can contribute to the overall feeling of well-being. Download and present our Finance PowerPoint Templates because this diagram helps you to light up enthusiasm in your team like dream emerge.ge. Download and present our Real estate PowerPoint Templates because you can Churn the wheels of the brains of your colleagues. Download our Success PowerPoint Templates because it helps you to satiate the brains of your team with a taste of the final product. Download and present our Business PowerPoint Templates because you can Flutter your wings and enchant the world. Impress them with the innate attractiveness of your thoughts and words.Use these PowerPoint slides for presentations relating to Houses made from dollars, money, finance, real estate, success, business. The prominent colors used in the PowerPoint template are Green, Black, White. Customers tell us our Houses Graph Of Dollar Bank Notes Money PowerPoint Templates PPT Backgrounds For Slides 1212 are Handsome. Presenters tell us our finance PowerPoint templates and PPT Slides are Flirty. Presenters tell us our Houses Graph Of Dollar Bank Notes Money PowerPoint Templates PPT Backgrounds For Slides 1212 are Detailed. The feedback we get is that our dollars PowerPoint templates and PPT Slides are the best it can get when it comes to presenting. Use our Houses Graph Of Dollar Bank Notes Money PowerPoint Templates PPT Backgrounds For Slides 1212 are Magnificent. You can be sure our estate PowerPoint templates and PPT Slides are aesthetically designed to attract attention. We guarantee that they will grab all the eyeballs you need.

Successful Business Graph Growth New Year PowerPoint Templates Ppt Backgrounds For Slides 1212
We present our Successful Business Graph Growth New Year PowerPoint Templates PPT Backgrounds For Slides 1212.Present our Business PowerPoint Templates because you have had a great year or so business wise. It is time to celebrate the efforts of your team. Download and present our Spheres PowerPoint Templates because it unravels the process layer by layer and exposes their relevance to the core issue. Download and present our New year PowerPoint Templates because let your words be the drops of wisdom spreading knowledge and peace like ripples through the expectant minds of your devoted followers. Download our Globe PowerPoint Templates because your quicksilver ideas are the arrows in your quiver. Use our Success PowerPoint Templates because it helps you to inform your team of your innovative ideas.Use these PowerPoint slides for presentations relating to Globe with 2013, business, globe, success, spheres, new year . The prominent colors used in the PowerPoint template are Blue , Yellow, Red. Customers tell us our Successful Business Graph Growth New Year PowerPoint Templates PPT Backgrounds For Slides 1212 are Colorful. Presenters tell us our new PowerPoint templates and PPT Slides are the best it can get when it comes to presenting. Presenters tell us our Successful Business Graph Growth New Year PowerPoint Templates PPT Backgrounds For Slides 1212 are Handsome. The feedback we get is that our spheres PowerPoint templates and PPT Slides will help them to explain complicated concepts. Use our Successful Business Graph Growth New Year PowerPoint Templates PPT Backgrounds For Slides 1212 provide you with a vast range of viable options. Select the appropriate ones and just fill in your text. You can be sure our success PowerPoint templates and PPT Slides are Nice.
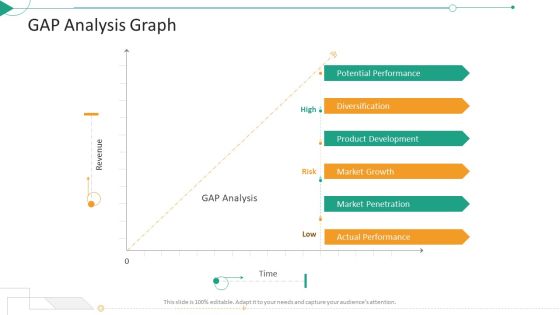
Strategic Planning Needs Evaluation Gap Analysis Graph Ppt Inspiration Templates PDF
This is a strategic planning needs evaluation gap analysis graph ppt inspiration templates pdf template with various stages. Focus and dispense information on three stages using this creative set, that comes with editable features. It contains large content boxes to add your information on topics like product development, market growth, potential performance. You can also showcase facts, figures, and other relevant content using this PPT layout. Grab it now.
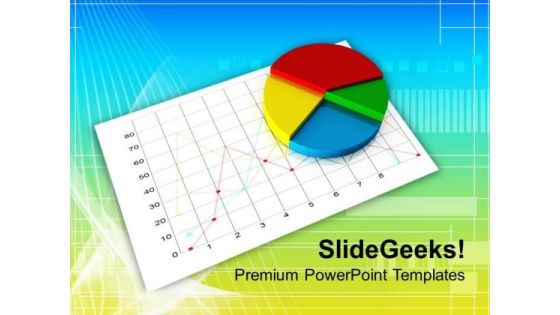
Business Pie Chart On White Graph PowerPoint Templates Ppt Backgrounds For Slides 0313
We present our Business Pie Chart On White Graph PowerPoint Templates PPT Backgrounds For Slides 0313.Download our Pie Charts PowerPoint Templates because Our PowerPoint Templates and Slides will let your words and thoughts hit bullseye everytime. Download and present our Business PowerPoint Templates because You canTake a leap off the starting blocks with our PowerPoint Templates and Slides. They will put you ahead of the competition in quick time. Download and present our Marketing PowerPoint Templates because Our PowerPoint Templates and Slides will Embellish your thoughts. They will help you illustrate the brilliance of your ideas. Use our Shapes PowerPoint Templates because Our PowerPoint Templates and Slides will provide the perfect balance. Your weighty ideas will get the ideal impetus. Present our Future PowerPoint Templates because Our PowerPoint Templates and Slides will provide you a launch platform. Give a lift off to your ideas and send them into orbit.Use these PowerPoint slides for presentations relating to Pie chart on graph paper, pie charts, business, marketing, shapes, future. The prominent colors used in the PowerPoint template are Red, White, Yellow.
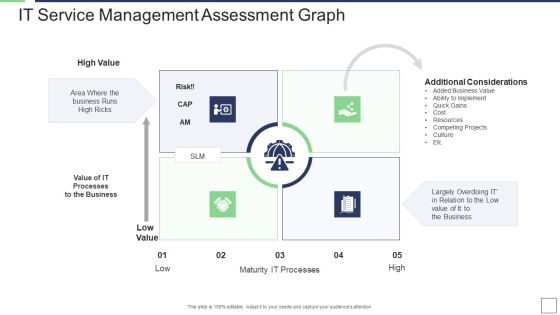
IT Service Incorporation And Administration IT Service Management Assessment Graph Value Sample PDF
This is a it service incorporation and administration it service management assessment graph value sample pdf template with various stages. Focus and dispense information on four stages using this creative set, that comes with editable features. It contains large content boxes to add your information on topics like business, processes, implement, value resources. You can also showcase facts, figures, and other relevant content using this PPT layout. Grab it now.
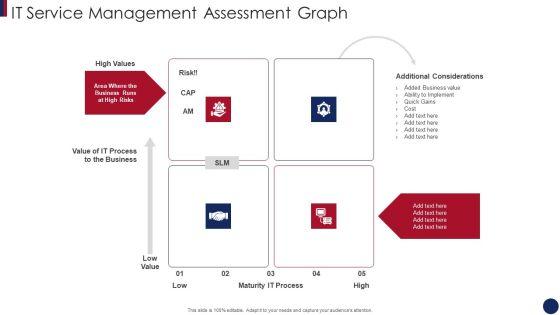
Post Merger Information Technology Service Delivery Amalgamation IT Service Management Assessment Graph Formats PDF
This is a post merger information technology service delivery amalgamation it service management assessment graph formats pdf template with various stages. Focus and dispense information on four stages using this creative set, that comes with editable features. It contains large content boxes to add your information on topics like it process, business, maturity it process, additional considerations . You can also showcase facts, figures, and other relevant content using this PPT layout. Grab it now.

IT Consolidation Post Mergers And Acquisition IT Service Management Assessment Graph Demonstration PDF
Presenting IT Consolidation Post Mergers And Acquisition IT Service Management Assessment Graph Demonstration PDF to provide visual cues and insights. Share and navigate important information on four stages that need your due attention. This template can be used to pitch topics like Ability To Implement, Quick Gains, Cost, Resources, Competing Projects. In addtion, this PPT design contains high resolution images, graphics, etc, that are easily editable and available for immediate download.

Strategies And Tactics For Effective Growth Of Business Ppt PowerPoint Presentation Diagram Graph Charts PDF
Persuade your audience using this strategies and tactics for effective growth of business ppt powerpoint presentation diagram graph charts pdf. This PPT design covers three stages, thus making it a great tool to use. It also caters to a variety of topics including strategies and tactics for effective growth of business. Download this PPT design now to present a convincing pitch that not only emphasizes the topic but also showcases your presentation skills.

Business Diagram Human Mind Diagram With Pie Graph For Representation PowerPoint Slide
This diagram displays human face graphic divided into sections. This section can be used for data display. Use this diagram to build professional presentations for your viewers.

Points To Focus For Business Culture Enhancement Ppt PowerPoint Presentation Diagram Graph Charts PDF
Persuade your audience using this points to focus for business culture enhancement ppt powerpoint presentation diagram graph charts pdf. This PPT design covers six stages, thus making it a great tool to use. It also caters to a variety of topics including empathy, training, transparency, flexibility, employee empowerment, employee recognition. Download this PPT design now to present a convincing pitch that not only emphasizes the topic but also showcases your presentation skills.

It Devops Organization Structure Ppt PowerPoint Presentation Diagram Graph Charts PDF
This slide provides the glimpse about the 4 tier of IT organization structure which focuses on base infrastructure, higher order infrastructure, business aligned capabilities, and market facing system. Do you have an important presentation coming up Are you looking for something that will make your presentation stand out from the rest Look no further than It Devops Organization Structure Ppt PowerPoint Presentation Diagram Graph Charts PDF. With our professional designs, you can trust that your presentation will pop and make delivering it a smooth process. And with Slidegeeks, you can trust that your presentation will be unique and memorable. So why wait Grab It Devops Organization Structure Ppt PowerPoint Presentation Diagram Graph Charts PDF today and make your presentation stand out from the rest.
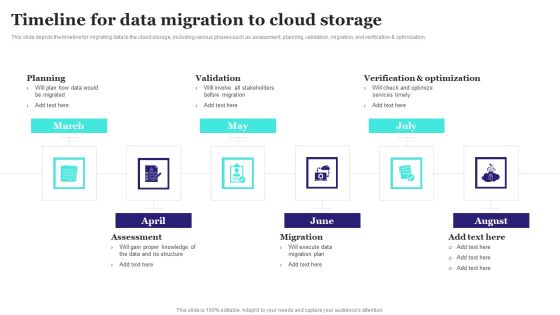
Timeline For Data Migration To Cloud Storage Ppt PowerPoint Presentation Diagram Graph Charts PDF
This slide depicts the timeline for migrating data to the cloud storage, including various phases such as assessment, planning, validation, migration, and verification and optimization. Do you have an important presentation coming up Are you looking for something that will make your presentation stand out from the rest Look no further than Timeline For Data Migration To Cloud Storage Ppt PowerPoint Presentation Diagram Graph Charts PDF. With our professional designs, you can trust that your presentation will pop and make delivering it a smooth process. And with Slidegeeks, you can trust that your presentation will be unique and memorable. So why wait Grab Timeline For Data Migration To Cloud Storage Ppt PowerPoint Presentation Diagram Graph Charts PDF today and make your presentation stand out from the rest.

Collecting Consumer Qualitative Data For Personalized Marketing Ppt PowerPoint Presentation Diagram Graph Charts PDF
This slide showcases consumer qualitative data that can be collected to formulate personalized marketing campaign. It also shows ways to collect data from different sources Do you have an important presentation coming up Are you looking for something that will make your presentation stand out from the rest Look no further than Collecting Consumer Qualitative Data For Personalized Marketing Ppt PowerPoint Presentation Diagram Graph Charts PDF. With our professional designs, you can trust that your presentation will pop and make delivering it a smooth process. And with Slidegeeks, you can trust that your presentation will be unique and memorable. So why wait Grab Collecting Consumer Qualitative Data For Personalized Marketing Ppt PowerPoint Presentation Diagram Graph Charts PDF today and make your presentation stand out from the rest.

2d Linear Growth Graph Monthly Wise 2013 To 2017 PowerPoint Templates Ppt Slides Graphics
We present our 2D linear growth graph monthly wise 2013 to 2017 PowerPoint Templates PPT Slides Graphics.Use our Marketing PowerPoint Templates because customer satisfaction is a mantra of the marketplace. Building a loyal client base is an essential element of your business. Download and present our Timelines PowerPoint Templates because this diagram helps you to explain your strategy to co-ordinate activities of these seperate groups. Download our Business PowerPoint Templates because generation of sales is the core of any business. Use our Arrows PowerPoint Templates because You have found the one missing link in the picture. That one strand that will bring together the entire edifice. Put it out there for all to see. Emphasise the value of its contribution in propelling the venture forward. Use our Time planning PowerPoint Templates because it Draws the universal impact to highlight the similarities with your organizational structure and plans.Use these PowerPoint slides for presentations relating to Art, Background, Button, Call, City, Colorful, Concept, Country, Destination, Editable, Flag, Fuel, Geography, Graphic, Home, Icon, Illustration, Journey, Land, Locate, Location, Macro, Map, Mapping, Mark, Navigate, Needle, Petrol, Pin, Pinpoint, Place, Pointing, Pump, Push, Pushpin, Restaurant, Road, Roadmap, Service, Set, Shiny, Space, Symbol, Town, Travel, Trip. The prominent colors used in the PowerPoint template are Blue, Black, Blue light. PowerPoint presentation experts tell us our 2D linear growth graph monthly wise 2013 to 2017 PowerPoint Templates PPT Slides Graphics are Dynamic. Customers tell us our City PowerPoint templates and PPT Slides are specially created by a professional team with vast experience. They diligently strive to come up with the right vehicle for your brilliant Ideas. Customers tell us our 2D linear growth graph monthly wise 2013 to 2017 PowerPoint Templates PPT Slides Graphics are Splendid. Customers tell us our Button PowerPoint templates and PPT Slides are Functional. PowerPoint presentation experts tell us our 2D linear growth graph monthly wise 2013 to 2017 PowerPoint Templates PPT Slides Graphics help you meet deadlines which are an element of today's workplace. Just browse and pick the slides that appeal to your intuitive senses. People tell us our Destination PowerPoint templates and PPT Slides effectively help you save your valuable time.
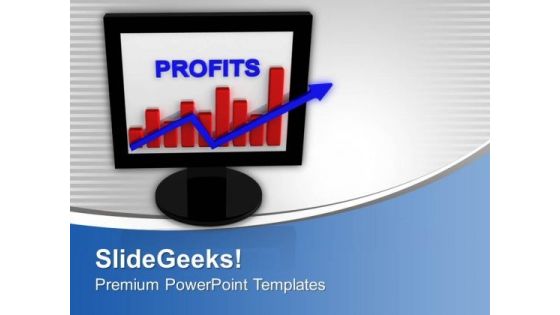
E-business Graph Progress Presentation Success PowerPoint Templates Ppt Backgrounds For Slides 0113
We present our E-Business Graph Progress Presentation Success PowerPoint Templates PPT Backgrounds For Slides 0113.Download and present our Business PowerPoint Templates because Our PowerPoint Templates and Slides will weave a web of your great ideas. They are gauranteed to attract even the most critical of your colleagues. Use our Computer PowerPoint Templates because You are working at that stage with an air of royalty. Let our PowerPoint Templates and Slides be the jewels in your crown. Download our Arrows PowerPoint Templates because Our PowerPoint Templates and Slides are conceived by a dedicated team. Use them and give form to your wondrous ideas. Download and present our Finance PowerPoint Templates because Our PowerPoint Templates and Slides will let you Hit the target. Go the full distance with ease and elan. Download and present our Success PowerPoint Templates because Our PowerPoint Templates and Slides will let you Hit the right notes. Watch your audience start singing to your tune.Use these PowerPoint slides for presentations relating to Computer Monitor with Business Graph, business, computer, arrows, finance, success. The prominent colors used in the PowerPoint template are Red, Blue, Black. PowerPoint presentation experts tell us our E-Business Graph Progress Presentation Success PowerPoint Templates PPT Backgrounds For Slides 0113 are incredible easy to use. Use our computer PowerPoint templates and PPT Slides are specially created by a professional team with vast experience. They diligently strive to come up with the right vehicle for your brilliant Ideas. People tell us our E-Business Graph Progress Presentation Success PowerPoint Templates PPT Backgrounds For Slides 0113 have awesome images to get your point across. The feedback we get is that our arrows PowerPoint templates and PPT Slides provide you with a vast range of viable options. Select the appropriate ones and just fill in your text. Professionals tell us our E-Business Graph Progress Presentation Success PowerPoint Templates PPT Backgrounds For Slides 0113 have awesome images to get your point across. Presenters tell us our Business PowerPoint templates and PPT Slides will help you be quick off the draw. Just enter your specific text and see your points hit home.

Men At Work Business As Usual Graph List Financial PowerPoint Templates Ppt Backgrounds For Slides
We present our men at work business as usual graph list financial PowerPoint templates PPT backgrounds for slides.Use our People PowerPoint Templates because Our PowerPoint Templates and Slides ensures Effective communication. They help you put across your views with precision and clarity. Download our Business PowerPoint Templates because You are working at that stage with an air of royalty. Let our PowerPoint Templates and Slides be the jewels in your crown. Present our Teamwork PowerPoint Templates because You have belief amd faith in your futuristic plans. Chalk them out for your team with our PowerPoint Templates and Slides. Present our Success PowerPoint Templates because Our PowerPoint Templates and Slides will let you Leave a lasting impression to your audiences. They possess an inherent longstanding recall factor. Download and present our Finance PowerPoint Templates because Our PowerPoint Templates and Slides help you pinpoint your timelines. Highlight the reasons for your deadlines with their use.Use these PowerPoint slides for presentations relating to 3d, accounting, achievement, ascending, businessmen, data, decisions, diagram, discuss, finance, financial, graph, group, growth, illustration, leader, leadership, presentation, profit, progress, projection, show, strategy, success, team, teamwork. The prominent colors used in the PowerPoint template are Red, Green, Black. PowerPoint presentation experts tell us our men at work business as usual graph list financial PowerPoint templates PPT backgrounds for slides provide great value for your money. Be assured of finding the best projection to highlight your words. We assure you our decisions PowerPoint templates and PPT Slides are second to none. PowerPoint presentation experts tell us our men at work business as usual graph list financial PowerPoint templates PPT backgrounds for slides are aesthetically designed to attract attention. We guarantee that they will grab all the eyeballs you need. You can be sure our discuss PowerPoint templates and PPT Slides help you meet deadlines which are an element of today's workplace. Just browse and pick the slides that appeal to your intuitive senses. We assure you our men at work business as usual graph list financial PowerPoint templates PPT backgrounds for slides will make the presenter successul in his career/life. Presenters tell us our ascending PowerPoint templates and PPT Slides are effectively colour coded to prioritise your plans They automatically highlight the sequence of events you desire.

2013 American Business Graph With Dollar Coins PowerPoint Templates Ppt Backgrounds For Slides 0113
We present our 2013 American Business Graph With Dollar Coins PowerPoint Templates PPT Backgrounds For Slides 0113.Download our Americana PowerPoint Templates because Our PowerPoint Templates and Slides will let your team Walk through your plans. See their energy levels rise as you show them the way. Download and present our Money PowerPoint Templates because you should Experience excellence with our PowerPoint Templates and Slides. They will take your breath away. Download our Finance PowerPoint Templates because You will get more than you ever bargained for. Download our Business PowerPoint Templates because Our PowerPoint Templates and Slides will Activate the energies of your audience. Get their creative juices flowing with your words. Use our Marketing PowerPoint Templates because you should once Tap the ingenuity of our PowerPoint Templates and Slides. They are programmed to succeed.Use these PowerPoint slides for presentations relating to Americana business graph with dollar coins, business, marketing, money, finance, americana. The prominent colors used in the PowerPoint template are Blue, Red, Yellow. We assure you our 2013 American Business Graph With Dollar Coins PowerPoint Templates PPT Backgrounds For Slides 0113 will generate and maintain the level of interest you desire. They will create the impression you want to imprint on your audience. Professionals tell us our dollar PowerPoint templates and PPT Slides are topically designed to provide an attractive backdrop to any subject. We assure you our 2013 American Business Graph With Dollar Coins PowerPoint Templates PPT Backgrounds For Slides 0113 provide great value for your money. Be assured of finding the best projection to highlight your words. The feedback we get is that our marketing PowerPoint templates and PPT Slides are effectively colour coded to prioritise your plans They automatically highlight the sequence of events you desire. Customers tell us our 2013 American Business Graph With Dollar Coins PowerPoint Templates PPT Backgrounds For Slides 0113 are topically designed to provide an attractive backdrop to any subject. Customers tell us our business PowerPoint templates and PPT Slides help you meet deadlines which are an element of today's workplace. Just browse and pick the slides that appeal to your intuitive senses.

Compare Intent B2B Marketing Pricing Ppt PowerPoint Presentation Diagram Graph Charts Cpb
Presenting this set of slides with name compare intent b2b marketing pricing ppt powerpoint presentation diagram graph charts cpb. This is an editable Powerpoint six stages graphic that deals with topics like compare intent b2b marketing pricing to help convey your message better graphically. This product is a premium product available for immediate download and is 100 percent editable in Powerpoint. Download this now and use it in your presentations to impress your audience.

Grain Trading Risk Management Ppt PowerPoint Presentation Diagram Graph Charts Cpb Pdf
Presenting this set of slides with name grain trading risk management ppt powerpoint presentation diagram graph charts cpb pdf. This is an editable Powerpoint five stages graphic that deals with topics like grain trading risk management to help convey your message better graphically. This product is a premium product available for immediate download and is 100 percent editable in Powerpoint. Download this now and use it in your presentations to impress your audience.

Cost Acquiring Customers Ppt PowerPoint Presentation Diagram Graph Charts Cpb Pdf
Presenting this set of slides with name cost acquiring customers ppt powerpoint presentation diagram graph charts cpb pdf. This is an editable Powerpoint six stages graphic that deals with topics like cost acquiring customers to help convey your message better graphically. This product is a premium product available for immediate download and is 100 percent editable in Powerpoint. Download this now and use it in your presentations to impress your audience.

Cost Reduction Activities In IT Business Ppt PowerPoint Presentation Diagram Graph Charts PDF
Presenting this set of slides with name cost reduction activities in it business ppt powerpoint presentation diagram graph charts pdf. This is a five stage process. The stages in this process are virtualize servers by using containers, use cheaper hardware, use the cloud decommission software, use open source software. This is a completely editable PowerPoint presentation and is available for immediate download. Download now and impress your audience.

Improving Restaurant Operations Kitchen Display System Kot Handling Ppt Diagram Graph Charts PDF
Presenting this set of slides with name improving restaurant operations kitchen display system kot handling ppt diagram graph charts pdf. This is a seven stage process. The stages in this process are automatic kot generation chef , kot pops kitchen display, fifo basis, track kitchen efficiency and average preparation time, menu item, prevent risk of missing out order, single and multi, department based orders. This is a completely editable PowerPoint presentation and is available for immediate download. Download now and impress your audience.

Achievement And Failure Icon With Employee And Flag Ppt PowerPoint Presentation Diagram Graph Charts
Persuade your audience using this achievement and failure icon with employee and flag ppt powerpoint presentation diagram graph charts. This PPT design covers four stages, thus making it a great tool to use. It also caters to a variety of topics including achievement and failure icon with employee and flag. Download this PPT design now to present a convincing pitch that not only emphasizes the topic but also showcases your presentation skills.

Organizational Process Flow For Customer On Boarding Ppt PowerPoint Presentation Diagram Graph Charts PDF
Persuade your audience using this organizational process flow for customer on boarding ppt powerpoint presentation diagram graph charts pdf. This PPT design covers one stages, thus making it a great tool to use. It also caters to a variety of topics including service menu, project charter, conduct meeting, initial meeting with agenda, registration from filing by client, approve. Download this PPT design now to present a convincing pitch that not only emphasizes the topic but also showcases your presentation skills.

Cloud Computing For Hosting Network Server Ppt Diagram Graph Charts PDF
Persuade your audience using this Cloud Computing For Hosting Network Server Ppt Diagram Graph Charts PDF. This PPT design covers four stages, thus making it a great tool to use. It also caters to a variety of topics including Cloud Computing, Hosting Network Server. Download this PPT design now to present a convincing pitch that not only emphasizes the topic but also showcases your presentation skills.
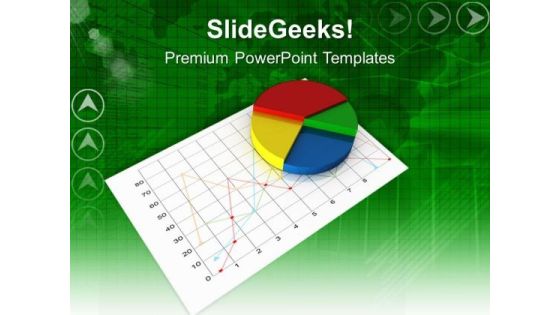
Colorful Pie Chart On Linear Graph PowerPoint Templates Ppt Backgrounds For Slides 0313
We present our Colorful Pie Chart On Linear Graph PowerPoint Templates PPT Backgrounds For Slides 0313.Download and present our Pie Charts PowerPoint Templates because Our PowerPoint Templates and Slides will weave a web of your great ideas. They are gauranteed to attract even the most critical of your colleagues. Download and present our Business PowerPoint Templates because It will let you Set new benchmarks with our PowerPoint Templates and Slides. They will keep your prospects well above par. Download and present our Marketing PowerPoint Templates because Watching this your Audience will Grab their eyeballs, they wont even blink. Download and present our Shapes PowerPoint Templates because You can Stir your ideas in the cauldron of our PowerPoint Templates and Slides. Cast a magic spell on your audience. Download our Future PowerPoint Templates because Our PowerPoint Templates and Slides are truly out of this world. Even the MIB duo has been keeping tabs on our team.Use these PowerPoint slides for presentations relating to Pie chart on graph paper, pie charts, business, marketing, shapes, future. The prominent colors used in the PowerPoint template are Green, Red, White.

6 Benefits Of Data Augmentation In Sales Ppt Diagram Graph Charts PDF
The slide explains the benefits of data enrichment. It includes cost saving, improved customer experience, improved targeting, higher sales gain, and discard redundant data. Presenting 6 Benefits Of Data Augmentation In Sales Ppt Diagram Graph Charts PDF to dispense important information. This template comprises six stages. It also presents valuable insights into the topics including Discard Redundant Data, Improved Targeting, Enhance Customer Nurturing, Cost Saving. This is a completely customizable PowerPoint theme that can be put to use immediately. So, download it and address the topic impactfully.
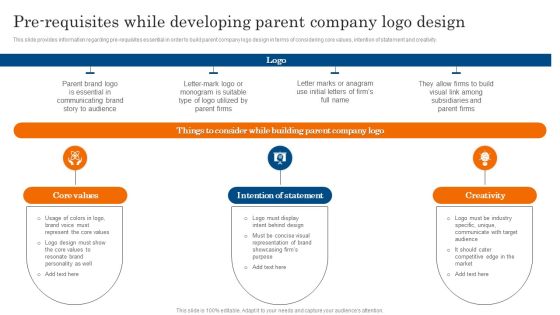
Pre Requisites While Developing Parent Company Logo Design Ppt PowerPoint Presentation Diagram Graph Charts PDF
This slide provides information regarding pre requisites essential in order to build parent company logo design in terms of considering core values, intention of statement and creativity. The Pre Requisites While Developing Parent Company Logo Design Ppt PowerPoint Presentation Diagram Graph Charts PDF is a compilation of the most recent design trends as a series of slides. It is suitable for any subject or industry presentation, containing attractive visuals and photo spots for businesses to clearly express their messages. This template contains a variety of slides for the user to input data, such as structures to contrast two elements, bullet points, and slides for written information. Slidegeeks is prepared to create an impression.
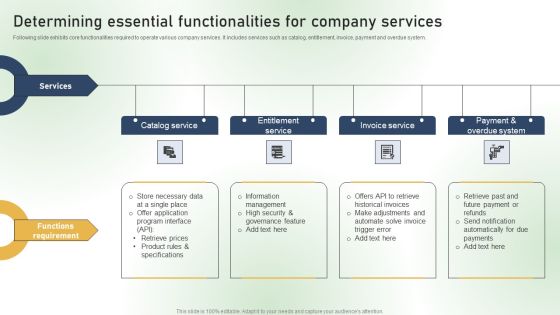
Determining Essential Functionalities For Company Services Ppt PowerPoint Presentation Diagram Graph Charts PDF
Following slide exhibits core functionalities required to operate various company services. It includes services such as catalog, entitlement, invoice, payment and overdue system. This modern and well arranged Determining Essential Functionalities For Company Services Ppt PowerPoint Presentation Diagram Graph Charts PDF provides lots of creative possibilities. It is very simple to customize and edit with the Powerpoint Software. Just drag and drop your pictures into the shapes. All facets of this template can be edited with Powerpoint no extra software is necessary. Add your own material, put your images in the places assigned for them, adjust the colors, and then you can show your slides to the world, with an animated slide included.

Steps For Sales Risk Management Process Ppt Diagram Graph Charts PDF
The following slide illustrates some steps to optimize sales risk administration process improving organizations overall financial performance. It includes activities such as identifying , assessing, prioritizing, treating and monitoring issues etc. The Steps For Sales Risk Management Process Ppt Diagram Graph Charts PDF is a compilation of the most recent design trends as a series of slides. It is suitable for any subject or industry presentation, containing attractive visuals and photo spots for businesses to clearly express their messages. This template contains a variety of slides for the user to input data, such as structures to contrast two elements, bullet points, and slides for written information. Slidegeeks is prepared to create an impression.

3d Handshake With Graph And Globe PowerPoint Templates Ppt Backgrounds For Slides 0213
We present our 3d Handshake With Graph And Globe PowerPoint Templates PPT Backgrounds For Slides 0213.Download our Globe PowerPoint Templates because You can Double your output with our PowerPoint Templates and Slides. They make beating deadlines a piece of cake. Download our Cylinders PowerPoint Templates because You have belief amd faith in your futuristic plans. Chalk them out for your team with our PowerPoint Templates and Slides. Download and present our People PowerPoint Templates because Our PowerPoint Templates and Slides has conjured up a web of all you need with the help of our great team. Use them to string together your glistening ideas. Download our Teamwork PowerPoint Templates because You should Kick up a storm with our PowerPoint Templates and Slides. The heads of your listeners will swirl with your ideas. Download our Handshake PowerPoint Templates because You can Bait your audience with our PowerPoint Templates and Slides. They will bite the hook of your ideas in large numbers.Use these PowerPoint slides for presentations relating to Men handshake with graph and globe, cylinders, globe, people, teamwork, handshake. The prominent colors used in the PowerPoint template are Blue navy, Gray, White.

Seven Steps Process Of Business Agreement Ppt PowerPoint Presentation Diagram Graph Charts PDF
Presenting seven steps process of business agreement ppt powerpoint presentation diagram graph charts pdf to dispense important information. This template comprises seven stages. It also presents valuable insights into the topics including contract preparation, identify needs, establish goals, negotiate the contract, execute the contract, manage after the signature, obligations, auditing, and renewals, author the contract, get approval before finalizing the contract, keep up with amendments and revisions. This is a completely customizable PowerPoint theme that can be put to use immediately. So, download it and address the topic impactfully.

Introduction To Switched Memory Access Ppt PowerPoint Presentation Diagram Graph Charts PDF
This slide represents the introduction to switched memory access, and a crossbar switch is installed to connect processors. Processors use shared memory in blocks, and connections between processors are made through a crossbar switch. Coming up with a presentation necessitates that the majority of the effort goes into the content and the message you intend to convey. The visuals of a PowerPoint presentation can only be effective if it supplements and supports the story that is being told. Keeping this in mind our experts created Introduction To Switched Memory Access Ppt PowerPoint Presentation Diagram Graph Charts PDF to reduce the time that goes into designing the presentation. This way, you can concentrate on the message while our designers take care of providing you with the right template for the situation.

Next Step For Real Estate Property Management Proposal Ppt Diagram Graph Charts PDF
This slide further steps that would be taken by company after signing the real estate property management proposal. It includes details like client name, client company, user assigned, company name etc. Stand out from the crowd with our dynamic Next Step For Real Estate Property Management Proposal Ppt Diagram Graph Charts PDF template. Designed to help you make a statement, this single-slide PPT template is fully customizable to suit your unique needs. With eye-catching visuals and seamless editing options, you can create impactful presentations in minutes. Say goodbye to boring slides and unlock your presentation potential with our top-notch template.

Analyzing Multiple Products Offered By Company Ppt PowerPoint Presentation Diagram Graph Charts PDF
This slide provides glimpse about different products and services created by the company that are available in the market for the customers. It includes models available, reviews, price range, target customers, etc. Find a pre designed and impeccable Analyzing Multiple Products Offered By Company Ppt PowerPoint Presentation Diagram Graph Charts PDF. The templates can ace your presentation without additional effort. You can download these easy to edit presentation templates to make your presentation stand out from others. So, what are you waiting for Download the template from Slidegeeks today and give a unique touch to your presentation.

Critical Component Of Corporate Level Strategy Resource Allocation Ppt PowerPoint Presentation Diagram Graph Charts PDF
This slide provides information regarding resource allocation as key component of corporate level strategy. The sustainable resource allocation include efficient management of people and capital. From laying roadmaps to briefing everything in detail, our templates are perfect for you. You can set the stage with your presentation slides. All you have to do is download these easy to edit and customizable templates. Critical Component Of Corporate Level Strategy Resource Allocation Ppt PowerPoint Presentation Diagram Graph Charts PDF will help you deliver an outstanding performance that everyone would remember and praise you for. Do download this presentation today.
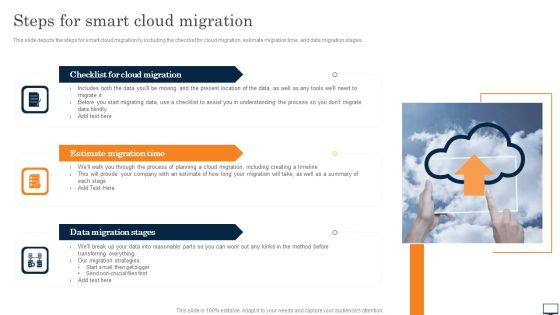
Steps For Smart Cloud Migration Ppt PowerPoint Presentation Diagram Graph Charts PDF
This slide depicts the steps for smart cloud migration by including the checklist for cloud migration, estimate migration time, and data migration stages. From laying roadmaps to briefing everything in detail, our templates are perfect for you. You can set the stage with your presentation slides. All you have to do is download these easy to edit and customizable templates. Steps For Smart Cloud Migration Ppt PowerPoint Presentation Diagram Graph Charts PDF will help you deliver an outstanding performance that everyone would remember and praise you for. Do download this presentation today.
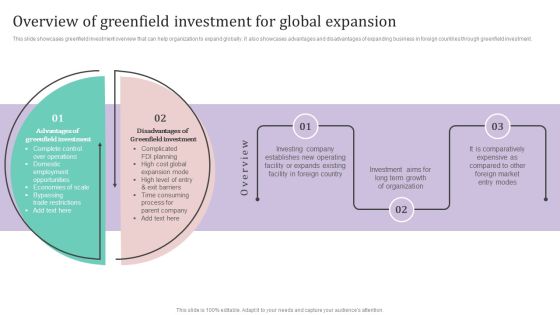
Overview Of Greenfield Investment For Global Expansion Ppt PowerPoint Presentation Diagram Graph Charts PDF
This slide showcases greenfield investment overview that can help organization to expand globally. It also showcases advantages and disadvantages of expanding business in foreign countries through greenfield investment.The best PPT templates are a great way to save time, energy, and resources. Slidegeeks have 100precent editable powerpoint slides making them incredibly versatile. With these quality presentation templates, you can create a captivating and memorable presentation by combining visually appealing slides and effectively communicating your message. Download Overview Of Greenfield Investment For Global Expansion Ppt PowerPoint Presentation Diagram Graph Charts PDF from Slidegeeks and deliver a wonderful presentation.
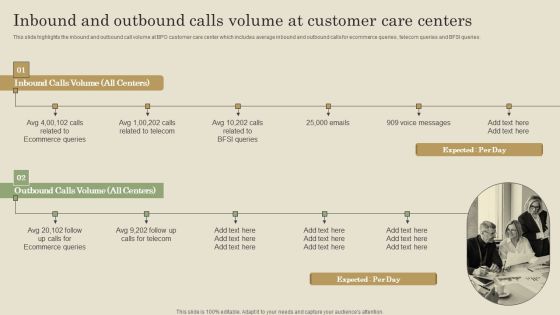
Inbound And Outbound Calls Volume At Customer Care Centers Ppt PowerPoint Presentation Diagram Graph Charts PDF
This slide highlights the inbound and outbound call volume at BPO customer care center which includes average inbound and outbound calls for ecommerce queries , telecom queries and BFSI queries. If your project calls for a presentation, then Slidegeeks is your go to partner because we have professionally designed, easy to edit templates that are perfect for any presentation. After downloading, you can easily edit Inbound And Outbound Calls Volume At Customer Care Centers Ppt PowerPoint Presentation Diagram Graph Charts PDF and make the changes accordingly. You can rearrange slides or fill them with different images. Check out all the handy templates

Continuous Supply Planning For Smooth Functioning Ppt PowerPoint Presentation Diagram Graph Charts PDF
This slide highlights the key approaches for continuous planning for smooth business functioning which includes planning events, one integrated plan, response to opportunities and planning for quality. From laying roadmaps to briefing everything in detail, our templates are perfect for you. You can set the stage with your presentation slides. All you have to do is download these easy to edit and customizable templates. Continuous Supply Planning For Smooth Functioning Ppt PowerPoint Presentation Diagram Graph Charts PDF will help you deliver an outstanding performance that everyone would remember and praise you for. Do download this presentation today.

Measuring Brand Awareness Through Social Media Platforms Ppt PowerPoint Presentation Diagram Graph Charts PDF
The following slide outlines various key performance indicators KPIs through which marketers can evaluate brand awareness on social media channels such as Facebook, Instagram, LinkedIn, Twitter, and YouTube. The metrics mentioned are brand impressions, reach, engagement rate, followers growth, story views, etc. The best PPT templates are a great way to save time, energy, and resources. Slidegeeks have 100 percent editable powerpoint slides making them incredibly versatile. With these quality presentation templates, you can create a captivating and memorable presentation by combining visually appealing slides and effectively communicating your message. Download Measuring Brand Awareness Through Social Media Platforms Ppt PowerPoint Presentation Diagram Graph Charts PDF from Slidegeeks and deliver a wonderful presentation.

SCR For Market Ways To Improve Brand Ranking Ppt Diagram Graph Charts PDF
The purpose of this slide is to provide several ways in which brand ranking can be improved. Deliver and pitch your topic in the best possible manner with this SCR for market ways to improve brand ranking ppt diagram graph charts pdf. Use them to share invaluable insights on quality yet reasonably priced products, improve interaction and communication with customers, focus on online marketing and physical marketing, potential accounts and impress your audience. This template can be altered and modified as per your expectations. So, grab it now.

Risk Due Diligence For M And A Ppt Diagram Graph Charts PDF
The following slide showcases the approach and execution of due diligence for mergers and acquisitions. It depicts M and A strategy, target screening, transaction execution, integration, divestiture and key insights. Showcasing this set of slides titled Risk Due Diligence For M And A Ppt Diagram Graph Charts PDF. The topics addressed in these templates are Approach Risk, Handoff Risk, Execution Risk, Transaction Curve. All the content presented in this PPT design is completely editable. Download it and make adjustments in color, background, font etc. as per your unique business setting.
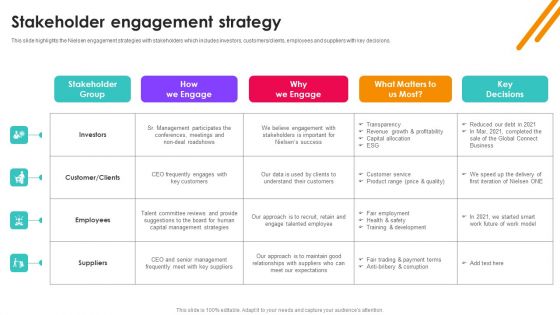
Nielsen Business Profile Stakeholder Engagement Strategy Ppt PowerPoint Presentation Diagram Graph Charts PDF
This slide highlights the Nielsen engagement strategies with stakeholders which includes investors, customers or clients, employees and suppliers with key decisions. The Nielsen Business Profile Stakeholder Engagement Strategy Ppt PowerPoint Presentation Diagram Graph Charts PDF is a compilation of the most recent design trends as a series of slides. It is suitable for any subject or industry presentation, containing attractive visuals and photo spots for businesses to clearly express their messages. This template contains a variety of slides for the user to input data, such as structures to contrast two elements, bullet points, and slides for written information. Slidegeeks is prepared to create an impression.
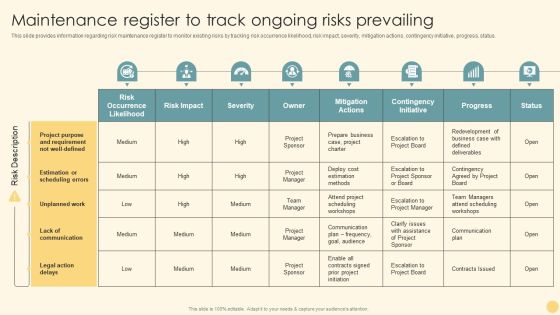
Maintenance Register To Track Ongoing Risks Prevailing Ppt PowerPoint Presentation Diagram Graph Charts PDF
This slide provides information regarding risk maintenance register to monitor existing risks by tracking risk occurrence likelihood, risk impact, severity, mitigation actions, contingency initiative, progress, status. Want to ace your presentation in front of a live audience Our Maintenance Register To Track Ongoing Risks Prevailing Ppt PowerPoint Presentation Diagram Graph Charts PDF can help you do that by engaging all the users towards you. Slidegeeks experts have put their efforts and expertise into creating these impeccable powerpoint presentations so that you can communicate your ideas clearly. Moreover, all the templates are customizable, and easy to edit and downloadable. Use these for both personal and commercial use.

Introduction To Cloud Storage Ppt PowerPoint Presentation Diagram Graph Charts PDF
This slide depicts the introduction to cloud storage, including its features such as being cost-effective, flexible, available, and its management by third party vendors. This modern and well arranged Introduction To Cloud Storage Ppt PowerPoint Presentation Diagram Graph Charts PDF provides lots of creative possibilities. It is very simple to customize and edit with the Powerpoint Software. Just drag and drop your pictures into the shapes. All facets of this template can be edited with Powerpoint no extra software is necessary. Add your own material, put your images in the places assigned for them, adjust the colors, and then you can show your slides to the world, with an animated slide included.

Table Of Contents Customer Support Improvement Strategic Plan Ppt PowerPoint Presentation Diagram Graph Charts PDF
Coming up with a presentation necessitates that the majority of the effort goes into the content and the message you intend to convey. The visuals of a PowerPoint presentation can only be effective if it supplements and supports the story that is being told. Keeping this in mind our experts created Table Of Contents Customer Support Improvement Strategic Plan Ppt PowerPoint Presentation Diagram Graph Charts PDF to reduce the time that goes into designing the presentation. This way, you can concentrate on the message while our designers take care of providing you with the right template for the situation.
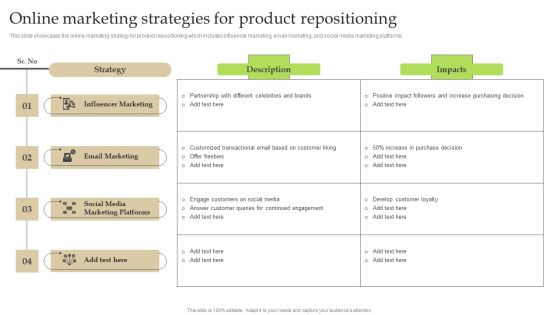
Online Marketing Strategies For Product Repositioning Ppt PowerPoint Presentation Diagram Graph Charts PDF
This slide showcases the online marketing strategy for product repositioning which includes influencer marketing, email marketing, and social media marketing platforms. Present like a pro with Online Marketing Strategies For Product Repositioning Ppt PowerPoint Presentation Diagram Graph Charts PDF Create beautiful presentations together with your team, using our easy-to-use presentation slides. Share your ideas in real-time and make changes on the fly by downloading our templates. So whether you are in the office, on the go, or in a remote location, you can stay in sync with your team and present your ideas with confidence. With Slidegeeks presentation got a whole lot easier. Grab these presentations today.
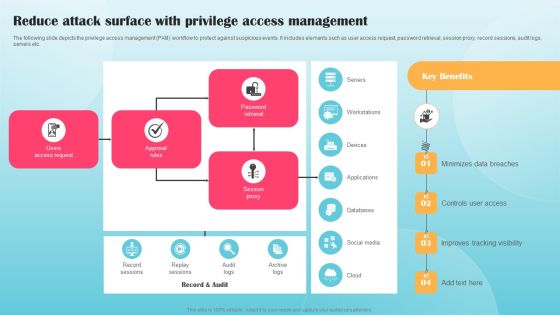
Reduce Attack Surface With Privilege Access Management Ppt PowerPoint Presentation Diagram Graph Charts PDF
The following slide depicts the privilege access management PAM workflow to protect against suspicious events. It includes elements such as user access request, password retrieval, session proxy, record sessions, audit logs, servers etc. Want to ace your presentation in front of a live audience Our Reduce Attack Surface With Privilege Access Management Ppt PowerPoint Presentation Diagram Graph Charts PDF can help you do that by engaging all the users towards you. Slidegeeks experts have put their efforts and expertise into creating these impeccable powerpoint presentations so that you can communicate your ideas clearly. Moreover, all the templates are customizable, and easy to edit and downloadable. Use these for both personal and commercial use.

Comprehensive Business Overview With Mission And Core Values Ppt PowerPoint Presentation Diagram Graph Charts PDF
This slide provides glimpse about comprehensive summary of cosmetics and skin care company to provide current and background information. It includes overview, partners, core values, key facts, etc. Want to ace your presentation in front of a live audience Our Comprehensive Business Overview With Mission And Core Values Ppt PowerPoint Presentation Diagram Graph Charts PDF can help you do that by engaging all the users towards you. Slidegeeks experts have put their efforts and expertise into creating these impeccable powerpoint presentations so that you can communicate your ideas clearly. Moreover, all the templates are customizable, and easy to edit and downloadable. Use these for both personal and commercial use.

2013 Business Profit Graph Globe PowerPoint Templates Ppt Backgrounds For Slides 0113
We present our 2013 Business Profit Graph Globe PowerPoint Templates PPT Backgrounds For Slides 0113.Present our Globe PowerPoint Templates because Our PowerPoint Templates and Slides are specially created by a professional team with vast experience. They diligently strive to come up with the right vehicle for your brilliant Ideas. Present our Business PowerPoint Templates because You have a driving passion to excel in your field. Our PowerPoint Templates and Slides will prove ideal vehicles for your ideas. Download our Success PowerPoint Templates because You can Hit a home run with our PowerPoint Templates and Slides. See your ideas sail into the minds of your audience. Download our Earth PowerPoint Templates because Our PowerPoint Templates and Slides will let you Clearly mark the path for others to follow. Download and present our Shapes PowerPoint Templates because Our PowerPoint Templates and Slides will effectively help you save your valuable time. They are readymade to fit into any presentation structure. Use these PowerPoint slides for presentations relating to Global profit growth charts with world globe, globe, business, success, earth, shapes. The prominent colors used in the PowerPoint template are Yellow, Green, Gray. Customers tell us our 2013 Business Profit Graph Globe PowerPoint Templates PPT Backgrounds For Slides 0113 effectively help you save your valuable time. People tell us our globe PowerPoint templates and PPT Slides are effectively colour coded to prioritise your plans They automatically highlight the sequence of events you desire. You can be sure our 2013 Business Profit Graph Globe PowerPoint Templates PPT Backgrounds For Slides 0113 help you meet deadlines which are an element of today's workplace. Just browse and pick the slides that appeal to your intuitive senses. People tell us our world PowerPoint templates and PPT Slides are topically designed to provide an attractive backdrop to any subject. The feedback we get is that our 2013 Business Profit Graph Globe PowerPoint Templates PPT Backgrounds For Slides 0113 are incredible easy to use. Professionals tell us our charts PowerPoint templates and PPT Slides are specially created by a professional team with vast experience. They diligently strive to come up with the right vehicle for your brilliant Ideas.
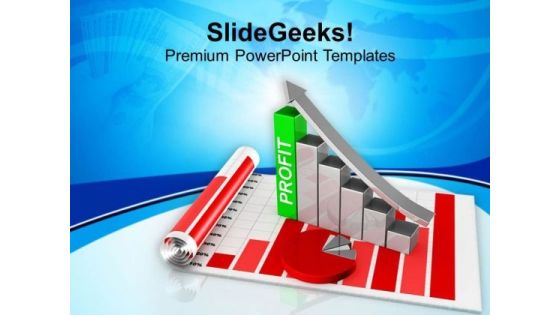
Business Growth Graph And Statistical Chart PowerPoint Templates Ppt Backgrounds For Slides 0413
We present our Business Growth Graph And Statistical Chart PowerPoint Templates PPT Backgrounds For Slides 0413.Present our Arrows PowerPoint Templates because Your success is our commitment. Our PowerPoint Templates and Slides will ensure you reach your goal. Download our Pie Charts PowerPoint Templates because Our PowerPoint Templates and Slides will let Your superior ideas hit the target always and everytime. Download and present our Business PowerPoint Templates because These PowerPoint Templates and Slides will give the updraft to your ideas. See them soar to great heights with ease. Use our Success PowerPoint Templates because You are an avid believer in ethical practices. Highlight the benefits that accrue with our PowerPoint Templates and Slides. Download and present our Future PowerPoint Templates because You have a driving passion to excel in your field. Our PowerPoint Templates and Slides will prove ideal vehicles for your ideas.Use these PowerPoint slides for presentations relating to Statistics graphs and charts, arrows, pie charts, business, success, future. The prominent colors used in the PowerPoint template are Red, Gray, Green.
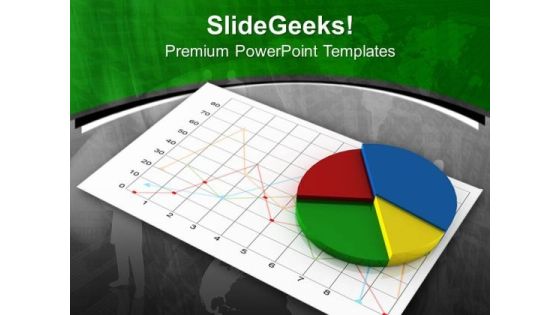
Graph With Pie Chart To Show Results Business PowerPoint Templates Ppt Backgrounds For Slides 0313
We present our Graph With Pie Chart To Show Results Business PowerPoint Templates PPT Backgrounds For Slides 0313.Use our Finance PowerPoint Templates because You are well armed with penetrative ideas. Our PowerPoint Templates and Slides will provide the gunpowder you need. Present our Business PowerPoint Templates because Our PowerPoint Templates and Slides help you meet the demand of the Market. Just browse and pick the slides that appeal to your intuitive senses. Use our Success PowerPoint Templates because Our PowerPoint Templates and Slides are innately eco-friendly. Their high recall value negate the need for paper handouts. Present our Shapes PowerPoint Templates because It will mark the footprints of your journey. Illustrate how they will lead you to your desired destination. Present our Marketing PowerPoint Templates because Our PowerPoint Templates and Slides are created by a hardworking bunch of busybees. Always flitting around with solutions gauranteed to please.Use these PowerPoint slides for presentations relating to Graph with pie chart, finance, success, business, shapes, marketing. The prominent colors used in the PowerPoint template are Blue navy, Green, Yellow.

Successful Business Graph And Chart Strategy PowerPoint Templates Ppt Backgrounds For Slides 0413
We present our Successful Business Graph and Chart Strategy PowerPoint Templates PPT Backgrounds For Slides 0413.Present our Business PowerPoint Templates because Our PowerPoint Templates and Slides are like the strings of a tennis racquet. Well strung to help you serve aces. Present our Success PowerPoint Templates because Our PowerPoint Templates and Slides ensures Effective communication. They help you put across your views with precision and clarity. Use our Marketing PowerPoint Templates because You can Zap them with our PowerPoint Templates and Slides. See them reel under the impact. Present our Process and flows PowerPoint Templates because It can Leverage your style with our PowerPoint Templates and Slides. Charm your audience with your ability. Present our Shapes PowerPoint Templates because Our PowerPoint Templates and Slides has conjured up a web of all you need with the help of our great team. Use them to string together your glistening ideas.Use these PowerPoint slides for presentations relating to Business graph with chart, business, success, marketing, process and flows, shapes. The prominent colors used in the PowerPoint template are Red, Gray, White.

Business Chart And Growing Graph PowerPoint Templates Ppt Backgrounds For Slides 0413
We present our Business Chart And Growing Graph PowerPoint Templates PPT Backgrounds For Slides 0413.Present our Business PowerPoint Templates because Watching this your Audience will Grab their eyeballs, they wont even blink. Download our Process and Flows PowerPoint Templates because You can safely bank on our PowerPoint Templates and Slides. They will provide a growth factor to your valuable thoughts. Use our Marketing PowerPoint Templates because Our PowerPoint Templates and Slides are innately eco-friendly. Their high recall value negate the need for paper handouts. Download our Success PowerPoint Templates because Our PowerPoint Templates and Slides are the chords of your song. String them along and provide the lilt to your views. Download our Shapes PowerPoint Templates because Our PowerPoint Templates and Slides will provide you a launch platform. Give a lift off to your ideas and send them into orbit.Use these PowerPoint slides for presentations relating to Business growth graph, business, process and flows, success, marketing, shapes. The prominent colors used in the PowerPoint template are Orange, Red, Blue.

Overview Of Graph Data Lineage Visualization Deploying Data Lineage IT Professional PDF
This slide outlines the pattern-based data lineage technique that generates the data lineage using patterns in metadata. It doesnt require knowledge of programming language for data processing, which is added advantage for non-technical stakeholders.Find a pre-designed and impeccable Overview Of Graph Data Lineage Visualization Deploying Data Lineage IT Professional PDF. The templates can ace your presentation without additional effort. You can download these easy-to-edit presentation templates to make your presentation stand out from others. So, what are you waiting for Download the template from Slidegeeks today and give a unique touch to your presentation.
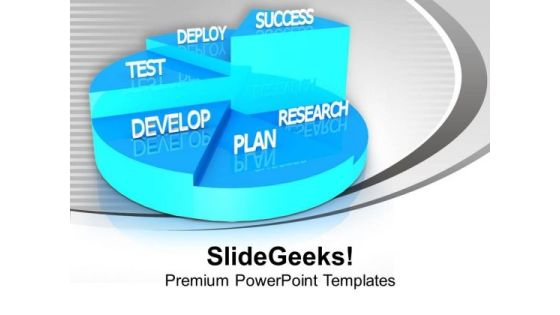
Pie Graph For Business Growth PowerPoint Templates Ppt Backgrounds For Slides 0413
We present our Pie Graph For Business Growth PowerPoint Templates PPT Backgrounds For Slides 0413.Present our Pie charts PowerPoint Templates because You have the co-ordinates for your destination of success. Let our PowerPoint Templates and Slides map out your journey. Download and present our Future PowerPoint Templates because It is Aesthetically crafted by artistic young minds. Our PowerPoint Templates and Slides are designed to display your dexterity. Download and present our Shapes PowerPoint Templates because It will Strengthen your hand with your thoughts. They have all the aces you need to win the day. Present our Marketing PowerPoint Templates because You can Stir your ideas in the cauldron of our PowerPoint Templates and Slides. Cast a magic spell on your audience. Download our Business PowerPoint Templates because You can Hit a home run with our PowerPoint Templates and Slides. See your ideas sail into the minds of your audience.Use these PowerPoint slides for presentations relating to Business pie graph, pie charts, business, future, shapes, marketing. The prominent colors used in the PowerPoint template are Blue, Gray, White.
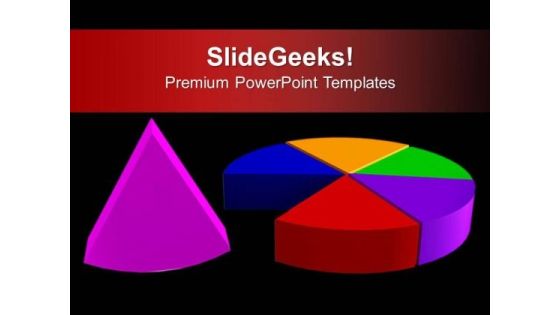
Pie Graph For Sales Strategy PowerPoint Templates Ppt Backgrounds For Slides 0413
We present our Pie Graph For Sales Strategy PowerPoint Templates PPT Backgrounds For Slides 0413.Download our Pie charts PowerPoint Templates because They will Put the wind in your sails. Skim smoothly over the choppy waters of the market. Download our Business PowerPoint Templates because You have the co-ordinates for your destination of success. Let our PowerPoint Templates and Slides map out your journey. Download our Sales PowerPoint Templates because It can Bubble and burst with your ideas. Present our Marketing PowerPoint Templates because Our PowerPoint Templates and Slides has conjured up a web of all you need with the help of our great team. Use them to string together your glistening ideas. Download and present our Shapes PowerPoint Templates because Our PowerPoint Templates and Slides will fulfill your every need. Use them and effectively satisfy the desires of your audience.Use these PowerPoint slides for presentations relating to Pie graph strategy for sales, pie charts, business, sales, marketing, shapes. The prominent colors used in the PowerPoint template are Pink, Black, Red.

 Home
Home