Bar Graph

Clustered Column Ppt PowerPoint Presentation Professional Styles
This is a clustered column ppt powerpoint presentation professional styles. This is a two stage process. The stages in this process are product, profit, bar graph, growth, success.

Timeline Analysis Ppt PowerPoint Presentation Professional Ideas
This is a timeline analysis ppt powerpoint presentation professional ideas. This is a seven stage process. The stages in this process are process changes, timeline analysis, bar graph.

Sales Projections Ppt PowerPoint Presentation Model Examples
This is a sales projections ppt powerpoint presentation model examples. This is a five stage process. The stages in this process are on sales, in years, bar graph.

Down Arrow Showing Loss Business PowerPoint Templates And PowerPoint Themes 0512
Microsoft Powerpoint Templates and Background with Bar graph down-These templates can be used for presentations relating to-Bar graph down, business, sales, finance, arrows, cylinders-Down Arrow Showing Loss Business PowerPoint Templates And PowerPoint Themes 0512

Campaign Performance Ppt PowerPoint Presentation Deck
This is a campaign performance ppt powerpoint presentation deck. This is a four stage process. The stages in this process are business, bar graph, strategy, growth, success.

Stacked Column Ppt PowerPoint Presentation Files
This is a stacked column ppt powerpoint presentation files. This is a nine stage process. The stages in this process are bar graph, finance, marketing, analysis, business.

Capital Spending Ppt PowerPoint Presentation Graphics
This is a capital spending ppt powerpoint presentation graphics. This is a two stage process. The stages in this process are business, marketing, success, bar graph, management.

Competitive Analysis Ppt PowerPoint Presentation Sample
This is a competitive analysis ppt powerpoint presentation sample. This is a six stage process. The stages in this process are business, marketing, success, bar graph, management.

Area Ppt PowerPoint Presentation Show
This is a area ppt powerpoint presentation show. This is a two stage process. The stages in this process are area, bar graph, growth, years, business.

Bubble Ppt PowerPoint Presentation Guidelines
This is a bubble ppt powerpoint presentation guidelines. This is a five stage process. The stages in this process are bubble, business, bar graph, marketing, presentation.

Financial Report Ppt PowerPoint Presentation Styles Skills
This is a financial report ppt powerpoint presentation styles skills. This is a four stage process. The stages in this process are bar graph, business, marketing, success, growth.

Financial Strength Ppt PowerPoint Presentation Summary Ideas
This is a financial strength ppt powerpoint presentation summary ideas. This is a four stage process. The stages in this process are bar graph, business, marketing, success, growth.

Clustered Column Ppt PowerPoint Presentation Ideas Show
This is a clustered column ppt powerpoint presentation ideas show. This is a two stage process. The stages in this process are product, percentage, finance, business, bar graph.

Clustered Column Ppt PowerPoint Presentation Layouts Ideas
This is a clustered column ppt powerpoint presentation layouts ideas. This is a two stage process. The stages in this process are product, profit, bar graph, growth, finance.

Clustered Column Ppt PowerPoint Presentation Show Introduction
This is a clustered column ppt powerpoint presentation show introduction. This is a two stage process. The stages in this process are product, profit, bar graph.

Leadership01 Success PowerPoint Themes And PowerPoint Slides 0811
Microsoft PowerPoint Theme and Slide with one figure stands atop the highest bar in a graph

Financial Strength Ppt PowerPoint Presentation Shapes
This is a financial strength ppt powerpoint presentation shapes. This is a four stage process. The stages in this process are business, marketing, success, business plan, bar graph.

Client Referrals Ppt PowerPoint Presentation Example 2015
This is a client referrals ppt powerpoint presentation example 2015. This is a three stage process. The stages in this process are business, marketing, management, bar graph, line bar.

Pareto Chart Ppt PowerPoint Presentation Ideas
This is a pareto chart ppt powerpoint presentation ideas. This is a four stage process. The stages in this process are bar graph, finance, marketing, strategy, analysis, business.

Column Chart Ppt PowerPoint Presentation Professional Example
This is a column chart ppt powerpoint presentation professional example. This is a eight stage process. The stages in this process are bar graph, growth, success, business, marketing.

Column Chart Ppt PowerPoint Presentation Infographics Model
This is a column chart ppt powerpoint presentation infographics model. This is a two stage process. The stages in this process are bar graph, growth, product, percentage, year.
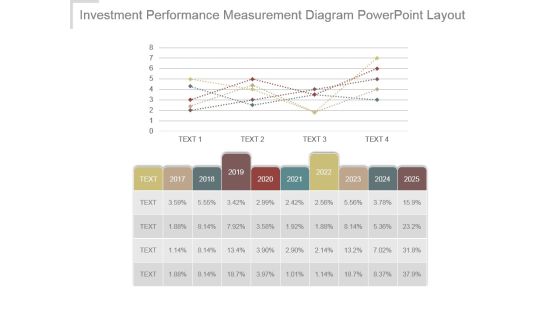
Investment Performance Measurement Diagram Powerpoint Layout
This is a investment performance measurement diagram powerpoint layout. This is a five stage process. The stages in this process are bar graph, growth, success, business, marketing.
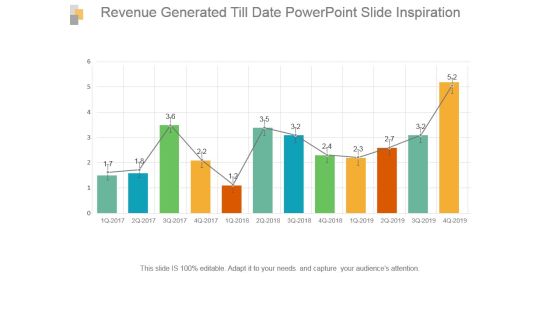
Revenue Generated Till Date Powerpoint Slide Inspiration
This is a revenue generated till date powerpoint slide inspiration. This is a twelve stage process. The stages in this process are bar graph, growth, success, data, analysis.

Clustered Column Ppt PowerPoint Presentation Slide Download
This is a clustered column ppt powerpoint presentation slide download. This is a twelve stage process. The stages in this process are bar graph, marketing, strategy, analysis, business.
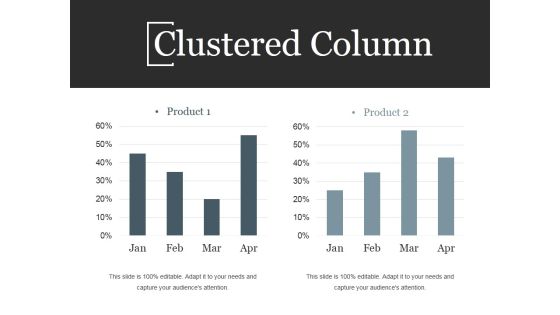
Clustered Column Ppt PowerPoint Presentation Information
This is a clustered column ppt powerpoint presentation information. This is a twelve stage process. The stages in this process are bar graph, business, marketing, growth, success.
Growth Team Ppt PowerPoint Presentation Icon Topics
This is a growth team ppt powerpoint presentation icon topics. This is a five stage process. The stages in this process are bar graph, growth, success, business, marketing.

Stacked Column Ppt PowerPoint Presentation Pictures Outfit
This is a stacked column ppt powerpoint presentation pictures outfit. This is a two stage process. The stages in this process are product, profit, growth, bar graph, success.

Comparison Ppt PowerPoint Presentation Ideas Show
This is a comparison ppt powerpoint presentation ideas show. This is a two stage process. The stages in this process are comparison, bar graph, growth, management, business.
Histogram Column Chart With Red Arrow Vector Icon Ppt PowerPoint Presentation Outline Ideas Cpb
This is a histogram column chart with red arrow vector icon ppt powerpoint presentation outline ideas cpb. This is a three stage process. The stages in this process are bar chart icon, bar graph icon, data chart icon.
Histogram Financial Analysis Vector Icon Ppt PowerPoint Presentation Layouts File Formats Cpb
This is a histogram financial analysis vector icon ppt powerpoint presentation layouts file formats cpb. This is a three stage process. The stages in this process are bar chart icon, bar graph icon, data chart icon.
Histogram Icon Showing Economic Fluctuations Ppt PowerPoint Presentation Slides Samples Cpb
This is a histogram icon showing economic fluctuations ppt powerpoint presentation slides samples cpb. This is a three stage process. The stages in this process are bar chart icon, bar graph icon, data chart icon.
Histogram Showing Business Trends Vector Icon Ppt PowerPoint Presentation Styles Portrait Cpb
This is a histogram showing business trends vector icon ppt powerpoint presentation styles portrait cpb. This is a three stage process. The stages in this process are bar chart icon, bar graph icon, data chart icon.
Histogram With Dollar For Financial Success Vector Icon Ppt PowerPoint Presentation Portfolio Example File Cpb
This is a histogram with dollar for financial success vector icon ppt powerpoint presentation portfolio example file cpb. This is a three stage process. The stages in this process are bar chart icon, bar graph icon, data chart icon.
Histogram With Gear Vector Icon Ppt PowerPoint Presentation Professional Slides Cpb
This is a histogram with gear vector icon ppt powerpoint presentation professional slides cpb. This is a three stage process. The stages in this process are bar chart icon, bar graph icon, data chart icon.
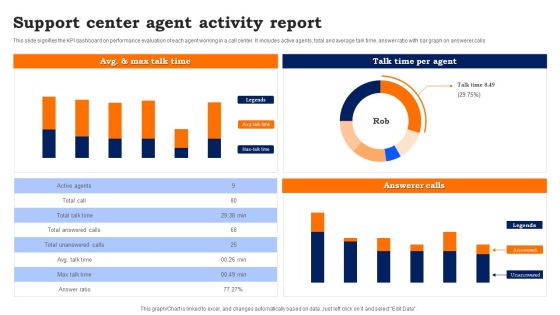
Support Center Agent Activity Report Guidelines PDF
This slide signifies the KPI dashboard on performance evaluation of each agent working in a call center. It includes active agents, total and average talk time, answer ratio with bar graph on answerer calls.
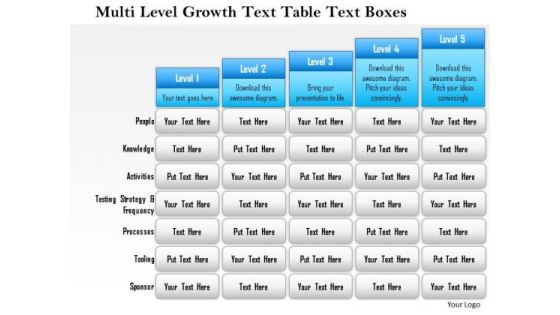
Business Framework Multi Level Growth Text Table Text Boxes 2 PowerPoint Presentation
Five staged text box style chart in bar graph design has been used to decorate this power point template slide. This diagram slide contains the multilevel growth concept. Use this PPT slide for financial growth and result analysis related topics.
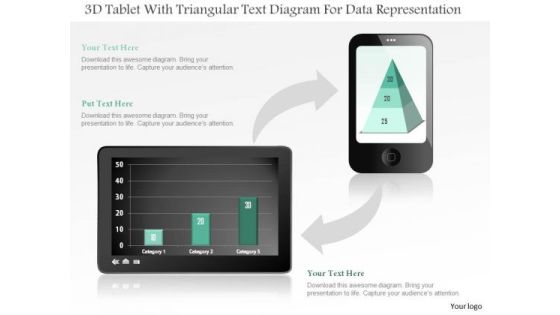
Business Diagram 3d Tablet With Triangular Text Diagram For Data Representation PowerPoint Slide
This business diagram displays bar graph on tablet and pyramid chart on mobile phone. Use this diagram, to make reports for interactive business presentations. Create professional presentations using this diagram.

Business Diagram Four Steps With 3d Business Person Standing Over It PowerPoint Slide
This business diagram displays bar graph with business person standing on it. This Power Point template has been designed to display personal growth. You may use this diagram to impart professional appearance to your presentations.
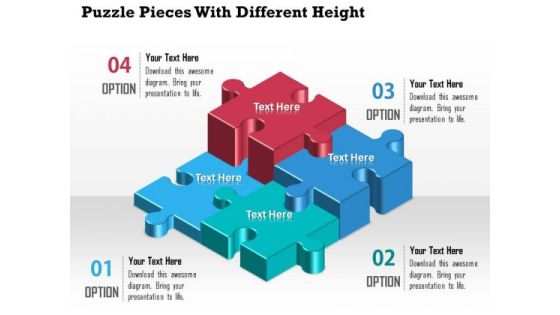
Business Diagram Puzzle Pieces With Different Height Presentation Template
A professional bar graph has been crafted with graphic of puzzles. All these puzzles are in different heights which shows the various levels of any data result representations. Use this diagram for your business result and data analysis related topics.
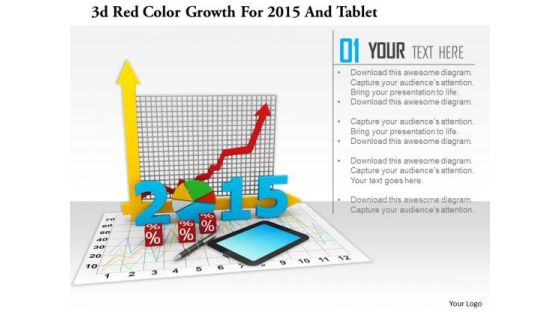
Stock Photo 3d Red Color Growth For 2015 And Tablet PowerPoint Slide
This image slide has graphics of financial charts and reports. This contains bar graph and pie chart to present business reports. Build an innovative presentation using this professional image slide.

Growth Ladder Success PowerPoint Templates And PowerPoint Themes 0512
Microsoft Powerpoint Templates and Background with color bar graph with ladder-Growth Ladder Success PowerPoint Templates And PowerPoint Themes 0512-These PowerPoint designs and slide layouts can be used for themes relating to -Growth ladder success, abstract, background, business, marketing, finance

Growth Business PowerPoint Templates And PowerPoint Themes 0512
Microsoft Powerpoint Templates and Background with color bar graph with ladder-These templates can be used for presentations relating to-Growth ladder success, abstract, ladder, business, marketing, finance-Growth Business PowerPoint Templates And PowerPoint Themes 0512

Growth Success PowerPoint Templates And PowerPoint Themes 0512
Microsoft Powerpoint Templates and Background with color bar graph with ladder-These templates can be used for presentations relating to-Growth ladder success, abstract, ladder, business, marketing, finance-Growth Success PowerPoint Templates And PowerPoint Themes 0512
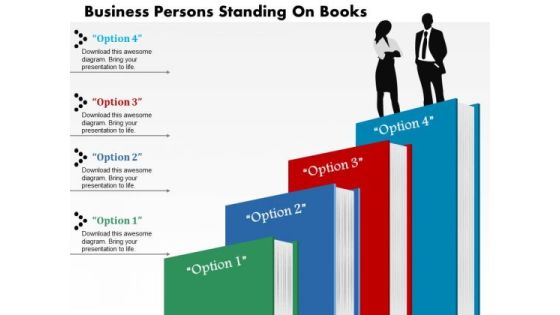
Business Diagram Persons Standing On Books Presentation Slide Template
This power point diagram template has been crafted with graphic of bar graph made with books and 3d man. This diagram template contains the concept of education and success. Use this diagram slide for your business and education presentation.
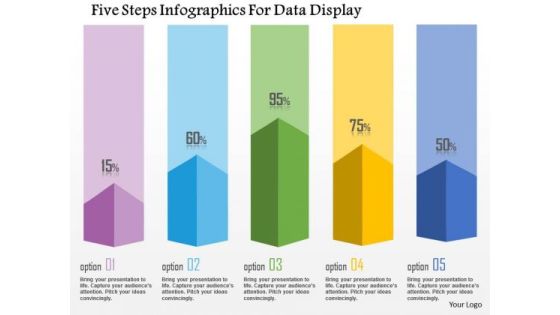
Business Diagram Five Steps Infographics For Data Display Presentation Template
This business diagram has been designed with graphic of five staged info graphics. This diagram can be used to display statistical information. Use this bar graph for your business and sales related presentations.

About Us Companys Data Information Powerpoint Slides
Download this PowerPoint template to create an attention grabbing introductory slide. It contains slide bar graph with employee image. Use this professional slide design to build a good reputation of your company.

0814 Bargraph Of Dollars Bundles With Arrow Graphic Image Graphics For PowerPoint
This unique image has backdrop of bar graph of dollars bundles with growth arrow. This image displays the concept of financial growth. Define the business growth with this suitable image. Use this image to make outstanding presentations

Successful Person Business PowerPoint Templates And PowerPoint Themes 0512
Microsoft Powerpoint Templates and Background with businessman and bar graph-Successful Person Business PowerPoint Templates And PowerPoint Themes 0512-These PowerPoint designs and slide layouts can be used for themes relating to -Businessman and bar graph, finance, people, business, shapes, success

Pie Growth Business PowerPoint Templates And PowerPoint Themes 0612
Pie Growth Business PowerPoint Templates And PowerPoint Themes 0612-Microsoft Powerpoint Templates and Background with bar and pie graph

Leadership01 Success PowerPoint Templates And PowerPoint Backgrounds 0811
Microsoft PowerPoint Template and Background with one figure stands a top the highest bar in a graph

Column Chart Ppt PowerPoint Presentation Summary Introduction
This is a column chart ppt powerpoint presentation summary introduction. This is a two stage process. The stages in this process are business, marketing, bar, graph, finance.

Column Chart Ppt PowerPoint Presentation Model Design Inspiration
This is a column chart ppt powerpoint presentation model design inspiration. This is a three stage process. The stages in this process are business, marketing, bar, graph, plan.

Pitch Deck For Entrepreneurs Raising Money For A New Business Ppt PowerPoint Presentation Complete Deck With Slides
This is a pitch deck for entrepreneurs raising money for a new business ppt powerpoint presentation complete deck with slides. This is a one stage process. The stages in this process are business, growth strategy, marketing, management, bar graph.

Clustered Column Ppt PowerPoint Presentation Summary Topics
This is a clustered column ppt powerpoint presentation summary topics. This is a two stage process. The stages in this process are bar, graph, finance, marketing, strategy.
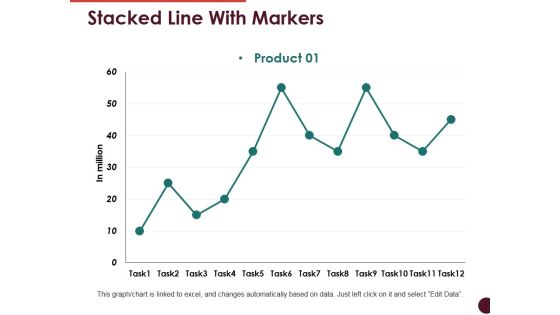
Stacked Line With Markers Ppt PowerPoint Presentation Show Templates
This is a stacked line with markers ppt powerpoint presentation show templates. This is a one stage process. The stages in this process are product, bar graph, growth, success, business.

Clustered Column Line Ppt PowerPoint Presentation Infographic Template Pictures
This is a clustered column line ppt powerpoint presentation infographic template pictures. This is a three stage process. The stages in this process are product, in percentage, bar graph, growth, success.

Clustered Column Line Ppt PowerPoint Presentation Topics
This is a clustered column line ppt powerpoint presentation topics. This is a three stage process. The stages in this process are product, in percentage, growth, bar graph, business.

Clustered Column Line Ppt PowerPoint Presentation Icon Ideas
This is a clustered column line ppt powerpoint presentation icon ideas. This is a three stage process. The stages in this process are product, in percentage, bar graph, success, growth.

Clustered Column Line Ppt PowerPoint Presentation Icon Good
This is a clustered column line ppt powerpoint presentation icon good. This is a three stage process. The stages in this process are product, financial year, bar graph, business, growth.

Clustered Column Line Ppt PowerPoint Presentation Pictures Example
This is a clustered column line ppt powerpoint presentation pictures example. This is a three stage process. The stages in this process are product, in percentage, bar graph, growth, success.
 Home
Home