Bar Graph

Client Support KPI Dashboard Rules PDF
This slide shows key performance indicators of customer service delivery. It includes service level, request volume, cost of revenue, customer satisfaction, customer retention, etc. Pitch your topic with ease and precision using this Client Support KPI Dashboard Rules PDF. This layout presents information on Customer Retention, Cost Per Support, Average Issue Solving Time. It is also available for immediate download and adjustment. So, changes can be made in the color, design, graphics or any other component to create a unique layout.

Client Support Management Dashboard Designs PDF
This slide shows KPI dashboard of customer service delivery management. It includes key performance indicators such as total support requests received, support status, total solved and unsolved issues, etc. Pitch your topic with ease and precision using this Client Support Management Dashboard Designs PDF. This layout presents information on Client Support, Management Dashboard. It is also available for immediate download and adjustment. So, changes can be made in the color, design, graphics or any other component to create a unique layout.

Client Support Resolution Dashboard Graphics PDF
This slide shows dashboard which can be used by organization in customer service resolution delivery. It includes KPIs such as first call resolution, unsolved issues, average response time, etc. Pitch your topic with ease and precision using this Client Support Resolution Dashboard Graphics PDF. This layout presents information on Client Support, Resolution Dashboard. It is also available for immediate download and adjustment. So, changes can be made in the color, design, graphics or any other component to create a unique layout.
KPI Dashboard Of Client Support Icons PDF
This slide shows customer service delivery key performance indicators dashboard. It includes KPIs such as issues received, average time to close issues, first call resolution, top performers, etc. Pitch your topic with ease and precision using this KPI Dashboard Of Client Support Icons PDF. This layout presents information on KPI Dashboard, Client Support. It is also available for immediate download and adjustment. So, changes can be made in the color, design, graphics or any other component to create a unique layout.
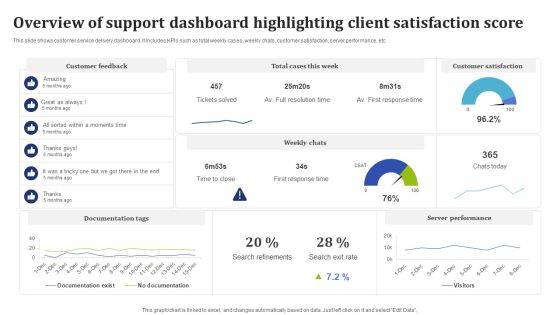
Overview Of Support Dashboard Highlighting Client Satisfaction Score Guidelines PDF
This slide shows customer service delivery dashboard. It includes KPIs such as total weekly cases, weekly chats, customer satisfaction, server performance, etc. Pitch your topic with ease and precision using this Overview Of Support Dashboard Highlighting Client Satisfaction Score Guidelines PDF. This layout presents information on Documentation Tags, Server Performance, Customer Satisfaction. It is also available for immediate download and adjustment. So, changes can be made in the color, design, graphics or any other component to create a unique layout.
KPI Dashboard For Tracking Commercial Banking And Financial Activities Download PDF
This slide depicts a dashboard for tracking the banking and financial activities of a business enterprise to measure the income and expenses. The key performing indicators are business accounts, paid, pending and cancelled transactions etc. Pitch your topic with ease and precision using this KPI Dashboard For Tracking Commercial Banking And Financial Activities Download PDF. This layout presents information on KPI Dashboard, Tracking Commercial Banking, Financial Activities. It is also available for immediate download and adjustment. So, changes can be made in the color, design, graphics or any other component to create a unique layout.
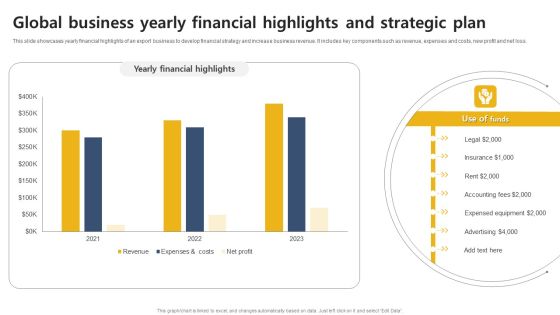
Global Business Yearly Financial Highlights And Strategic Plan Themes PDF
This slide highlights statistical presentation of import export business to quarterly evaluate balance of trade. It includes key components such as export, import, quarterly trends and balance of trade. Pitch your topic with ease and precision using this Global Business Yearly Financial Highlights And Strategic Plan Themes PDF. This layout presents information on Global Business, Yearly Financial Highlights, Strategic Plan. It is also available for immediate download and adjustment. So, changes can be made in the color, design, graphics or any other component to create a unique layout.
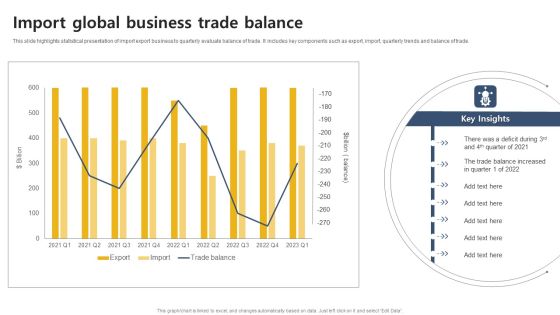
Import Global Business Trade Balance Rules PDF
Pitch your topic with ease and precision using this Import Global Business Trade Balance Rules PDF. This layout presents information on Import Global, Business Trade Balance. It is also available for immediate download and adjustment. So, changes can be made in the color, design, graphics or any other component to create a unique layout.
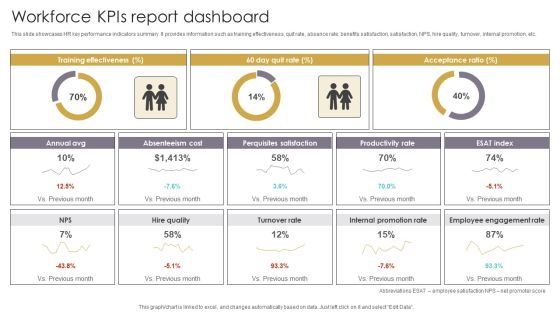
Workforce Kpis Report Dashboard Slides PDF
This slide showcases HR key performance indicators summary. It provides information such as training effectiveness, quit rate, absence rate, benefits satisfaction, satisfaction, NPS, hire quality, turnover, internal promotion, etc. Pitch your topic with ease and precision using this Workforce Kpis Report Dashboard Slides PDF. This layout presents information on Acceptance Ratio, Absenteeism Cost, Perquisites Satisfaction. It is also available for immediate download and adjustment. So, changes can be made in the color, design, graphics or any other component to create a unique layout.
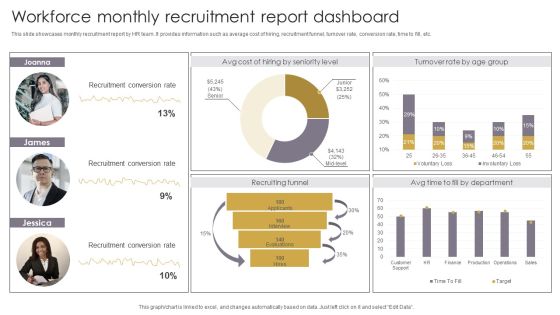
Workforce Monthly Recruitment Report Dashboard Themes PDF
This slide showcases monthly recruitment report by HR team. It provides information such as average cost of hiring, recruitment funnel, turnover rate, conversion rate, time to fill, etc. Pitch your topic with ease and precision using this Workforce Monthly Recruitment Report Dashboard Themes PDF. This layout presents information on Recruiting Funnel, Recruitment Conversion Rate, Recruitment Report Dashboard. It is also available for immediate download and adjustment. So, changes can be made in the color, design, graphics or any other component to create a unique layout.
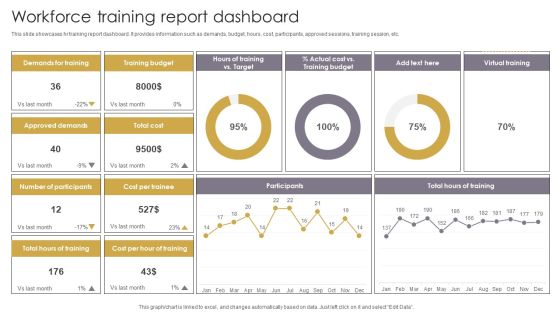
Workforce Training Report Dashboard Elements PDF
This slide showcases hr training report dashboard. It provides information such as demands, budget, hours, cost, participants, approved sessions, training session, etc. Pitch your topic with ease and precision using this Workforce Training Report Dashboard Elements PDF. This layout presents information on Training Budget, Demands For Training, Approved Demands. It is also available for immediate download and adjustment. So, changes can be made in the color, design, graphics or any other component to create a unique layout.

Boosting Product Sales Through Branding Key Strategies To Deliver Better Mockup PDF
This slide covers the key strategies to deliver better customer service which includes offering contextual-based support, innovate customer journey and invest in automated technologies. Do you have an important presentation coming up Are you looking for something that will make your presentation stand out from the rest Look no further than Boosting Product Sales Through Branding Key Strategies To Deliver Better Mockup PDF. With our professional designs, you can trust that your presentation will pop and make delivering it a smooth process. And with Slidegeeks, you can trust that your presentation will be unique and memorable. So why wait Grab Boosting Product Sales Through Branding Key Strategies To Deliver Better Mockup PDF today and make your presentation stand out from the rest.

Different Movies Film Production Budget Comparison Inspiration PDF
This slide showcase comparison of production budget across various genre to give producer an estimation of cost to enroll in filming project. It includes elements such as fiction, non fiction, animates, and experimental movies. Pitch your topic with ease and precision using this Different Movies Film Production Budget Comparison Inspiration PDF. This layout presents information on Different Movies Film, Production Budget Comparison. It is also available for immediate download and adjustment. So, changes can be made in the color, design, graphics or any other component to create a unique layout.

Defect Management Activity Monitoring Dashboard Information PDF
This slide illustrates summary dashboard for defect planning for project management. It includes defect management, defects by project, defects by type, defects by status, defects by reporter, etc. Pitch your topic with ease and precision using this Defect Management Activity Monitoring Dashboard Information PDF. This layout presents information on Defect Management, Activity Monitoring Dashboard. It is also available for immediate download and adjustment. So, changes can be made in the color, design, graphics or any other component to create a unique layout.
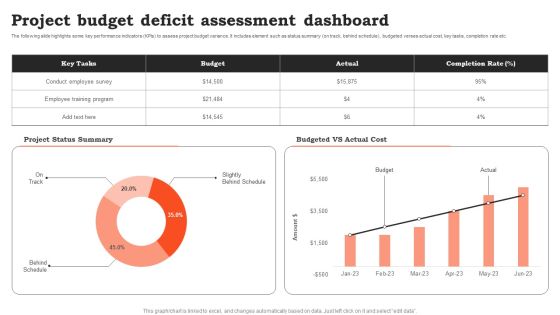
Project Budget Deficit Assessment Dashboard Brochure PDF
Pitch your topic with ease and precision using this Project Budget Deficit Assessment Dashboard Brochure PDF. This layout presents information on Project Budget, Deficit Assessment Dashboard. It is also available for immediate download and adjustment. So, changes can be made in the color, design, graphics or any other component to create a unique layout.
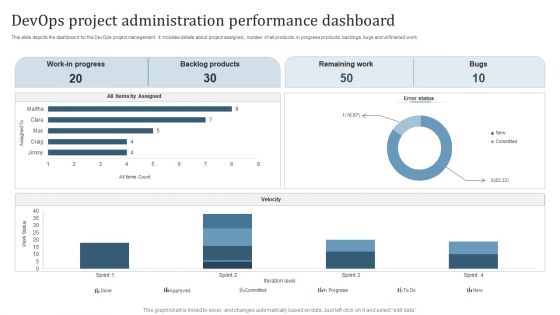
Devops Project Administration Performance Dashboard Themes PDF
This slide depicts the dashboard for the DevOps project management. It includes details about project assigned, number of all products, in progress products, backlogs, bugs and unfinished work. Pitch your topic with ease and precision using this Devops Project Administration Performance Dashboard Themes PDF. This layout presents information on Work In Progress, Backlog Products, Remaining Work, Bugs. It is also available for immediate download and adjustment. So, changes can be made in the color, design, graphics or any other component to create a unique layout.
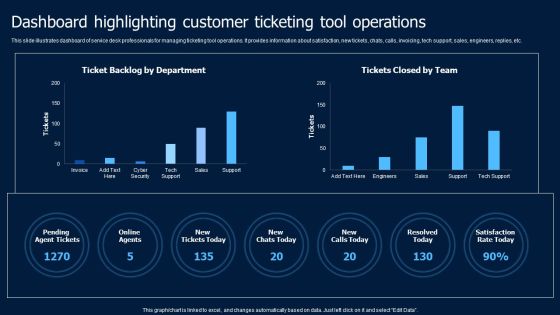
Help Desk Ticketing Dashboard Highlighting Customer Ticketing Tool Operations Introduction PDF
This slide illustrates dashboard of service desk professionals for managing ticketing tool operations. It provides information about satisfaction, new tickets, chats, calls, invoicing, tech support, sales, engineers, replies, etc. Crafting an eye-catching presentation has never been more straightforward. Let your presentation shine with this tasteful yet straightforward Help Desk Ticketing Dashboard Highlighting Customer Ticketing Tool Operations Introduction PDF maining professional. Construct the ideal Help Desk Ticketing Dashboard Highlighting Customer Ticketing Tool Operations Introduction PDF that effortlessly grabs the attention of your audience Begin now and be certain to wow your customers.

Metaverse Promotion To Improve Guide For Marketers For Metaverse Business Mockup PDF
This slide showcases guidance which can be followed by marketers for effectively marketing through metaverse. It provides information about adaptable creatives, increased personalization, cross-channel marketing, etc. Do you have an important presentation coming up Are you looking for something that will make your presentation stand out from the rest Look no further than Metaverse Promotion To Improve Guide For Marketers For Metaverse Business Mockup PDF. With our professional designs, you can trust that your presentation will pop and make delivering it a smooth process. And with Slidegeeks, you can trust that your presentation will be unique and memorable. So why wait Grab Metaverse Promotion To Improve Guide For Marketers For Metaverse Business Mockup PDF today and make your presentation stand out from the rest.
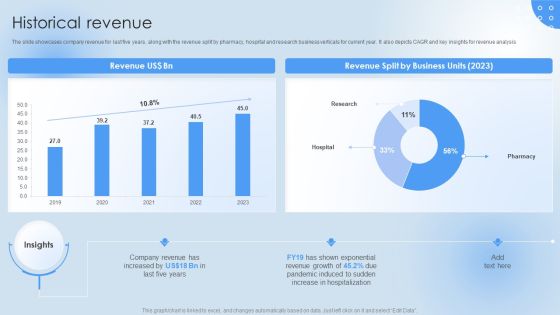
Pharmaceutical Company Financial Summary Historical Revenue Guidelines PDF
The slide showcases company revenue for last five years, along with the revenue split by pharmacy, hospital and research business verticals for current year. It also depicts CAGR and key insights for revenue analysis. Take your projects to the next level with our ultimate collection of Pharmaceutical Company Financial Summary Historical Revenue Guidelines PDF. Slidegeeks has designed a range of layouts that are perfect for representing task or activity duration, keeping track of all your deadlines at a glance. Tailor these designs to your exact needs and give them a truly corporate look with your own brand colors theyll make your projects stand out from the rest.
Pharmaceutical Company Financial Summary Hospital Business Financials Icons PDF
The slide describes financial details for Hospital business vertical. It showcase revenue, gross profit, operating profit, EBIDTA and net profit along with margin. Take your projects to the next level with our ultimate collection of Pharmaceutical Company Financial Summary Hospital Business Financials Icons PDF. Slidegeeks has designed a range of layouts that are perfect for representing task or activity duration, keeping track of all your deadlines at a glance. Tailor these designs to your exact needs and give them a truly corporate look with your own brand colors theyll make your projects stand out from the rest.

Email Marketing Digital Promotion Success Evaluation Dashboard Sample PDF
The slide demonstrates a dashboard to evaluate the success of marketing campaign for updating the strategies. Various KPIs included are average open rate per month, average click-through rate per month, average revenue on email per month, etc. Pitch your topic with ease and precision using this Email Marketing Digital Promotion Success Evaluation Dashboard Sample PDF. This layout presents information on Open Rate Per Month, Order Placed Per Month. It is also available for immediate download and adjustment. So, changes can be made in the color, design, graphics or any other component to create a unique layout.

Influencer Marketing Digital Promotion Success Analytics Structure PDF
Pitch your topic with ease and precision using this Influencer Marketing Digital Promotion Success Analytics Structure PDF. This layout presents information on Digital Promotion, Success Analytics. It is also available for immediate download and adjustment. So, changes can be made in the color, design, graphics or any other component to create a unique layout.

Dashboard To Track Project Limitations By Development Stages Ideas PDF
This slide showcases KPI dashboard to keep check on major project constraints for avoiding unforeseen company losses. It further includes elements such as budget risks and cost. Pitch your topic with ease and precision using this Dashboard To Track Project Limitations By Development Stages Ideas PDF. This layout presents information on Budget By Project Tasks, Risks. It is also available for immediate download and adjustment. So, changes can be made in the color, design, graphics or any other component to create a unique layout.

Project Limitations Dashboard With Cost And Time Graphics PDF
This slide showcases dashboard to track key metrics necessary for project success and effective management of constraints. It includes elements such as health, tasks, progress, workload, etc. Pitch your topic with ease and precision using this Project Limitations Dashboard With Cost And Time Graphics PDF. This layout presents information on Time, Workload, Tasks, Progress. It is also available for immediate download and adjustment. So, changes can be made in the color, design, graphics or any other component to create a unique layout.

Return On Investment From Email Marketing Campaign Themes PDF
This slide shows return on per dollar marketing investment spend. It includes email, catalogs, search engine optimization, mobile, etc. Pitch your topic with ease and precision using this Return On Investment From Email Marketing Campaign Themes PDF. This layout presents information on Email Marketing, Email Roi, Reducing Email Bounce Rate. It is also available for immediate download and adjustment. So, changes can be made in the color, design, graphics or any other component to create a unique layout.

KPI Dashboard Showcasing New Product Management Project Themes PDF
This slide represents KPI dashboard showcasing new product development project which can be used by managers to track performance. It provides information regarding cost by stage, resource availability and resource stage. Pitch your topic with ease and precision using this KPI Dashboard Showcasing New Product Management Project Themes PDF. This layout presents information on Cost By Stage, Resource By Stage, Resource Availability By Role. It is also available for immediate download and adjustment. So, changes can be made in the color, design, graphics or any other component to create a unique layout.
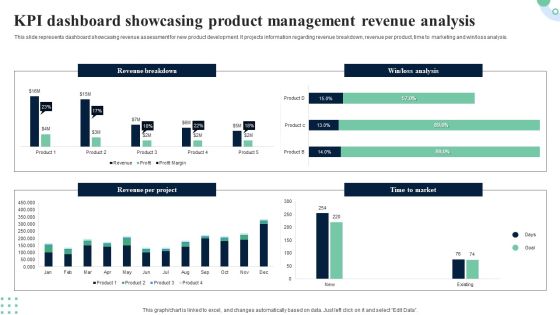
KPI Dashboard Showcasing Product Management Revenue Analysis Portrait PDF
This slide provides dashboard showcasing product development project overview with completion status. It provides information regarding cash flow statements, completion progress, project overview and product approval status. Pitch your topic with ease and precision using this KPI Dashboard Showcasing Product Management Revenue Analysis Portrait PDF. This layout presents information on Completion Progress, Product Approval Status, Cash Flow Statements. It is also available for immediate download and adjustment. So, changes can be made in the color, design, graphics or any other component to create a unique layout.

KPI Dashboard Showcasing Product Management Guidelines PDF
This slide showcases dashboard providing product development team performance status with determined KPIs. It provides details such as product development team score, average result scores and result KPIs. Pitch your topic with ease and precision using this KPI Dashboard Showcasing Product Management Guidelines PDF. This layout presents information on Average Rating, Innovation, Design. It is also available for immediate download and adjustment. So, changes can be made in the color, design, graphics or any other component to create a unique layout.

Product Management Project Performance With Workload KPI Dashboard Structure PDF
This slide provides dashboard showcasing product development project performance progress which helps managers identify areas of improvement. It provides information such as project budget overview, issue breakdown, workload management and hour spent on project. Pitch your topic with ease and precision using this Product Management Project Performance With Workload KPI Dashboard Structure PDF. This layout presents information on Project Budget Overview, Workload Management. It is also available for immediate download and adjustment. So, changes can be made in the color, design, graphics or any other component to create a unique layout.
Product Management Team Performance Tracking KPI Dashboard Pictures PDF
This slide provides performance tracking dashboard for product development project team. It provides information regarding hours spent on project, deadlines, employee responsible, new leads and revenue generated. Pitch your topic with ease and precision using this Product Management Team Performance Tracking KPI Dashboard Pictures PDF. This layout presents information on Tracking KPI Dashboard, Product Management Team Performance. It is also available for immediate download and adjustment. So, changes can be made in the color, design, graphics or any other component to create a unique layout.

Dashboard Of Industry Project Personnel Planning With Proportion Professional PDF
The following slide highlights the dashboard of industry project manpower planning with proportion illustrating current manpower and vacancy, vacancy by domain, age proportion, gender proportion, discipline proportion, qualification proportion and residential status. Pitch your topic with ease and precision using this Dashboard Of Industry Project Personnel Planning With Proportion Professional PDF. This layout presents information on Current Manpower And Vacancy, Gender Proportion, Qualification Proportion. It is also available for immediate download and adjustment. So, changes can be made in the color, design, graphics or any other component to create a unique layout.

Project Personnel Planning Dashboard With Talent Matrix Demonstration Structure PDF
The following slide highlights the project manpower planning dashboard with talent matrix illustrating supply and demand, skills, skills surplus, headcount and talent matrix showing number of skill demand, skill supply and surplus for department. Pitch your topic with ease and precision using this Project Personnel Planning Dashboard With Talent Matrix Demonstration Structure PDF. This layout presents information on Supply And Demand, Skill Surplus, Headcount. It is also available for immediate download and adjustment. So, changes can be made in the color, design, graphics or any other component to create a unique layout.
Service Desk Tracker Sheet To Monitor Status Of Ticket Professional PDF
This slide showcases tracker sheet that includes ticket details. It includes ticket number, priority, description, reported date and responsible person. Pitch your topic with ease and precision using this Service Desk Tracker Sheet To Monitor Status Of Ticket Professional PDF. This layout presents information on Ticket Number, Description, Responsible Person. It is also available for immediate download and adjustment. So, changes can be made in the color, design, graphics or any other component to create a unique layout.

Digital Performance In Shared Business Services Back Office Functions Formats PDF
Following slide provides information regarding performance measure utilized by organizations for various back office function which benefits them to drive better productivity and efficiency. Share service center, digital performance metrics and key highlights are demonstrated in this slide. Pitch your topic with ease and precision using this Digital Performance In Shared Business Services Back Office Functions Formats PDF. This layout presents information on Volume Productivity, Service, Maturity. It is also available for immediate download and adjustment. So, changes can be made in the color, design, graphics or any other component to create a unique layout.

Global Automobile Market Analysis Estimated Passenger Car Production By Selected Countries Rules PDF
Presenting this PowerPoint presentation, titled Global Automobile Market Analysis Estimated Passenger Car Production By Selected Countries Rules PDF, with topics curated by our researchers after extensive research. This editable presentation is available for immediate download and provides attractive features when used. Download now and captivate your audience. Presenting this Global Automobile Market Analysis Estimated Passenger Car Production By Selected Countries Rules PDF. Our researchers have carefully researched and created these slides with all aspects taken into consideration. This is a completely customizable Global Automobile Market Analysis Estimated Passenger Car Production By Selected Countries Rules PDF that is available for immediate downloading. Download now and make an impact on your audience. Highlight the attractive features available with our PPTs.
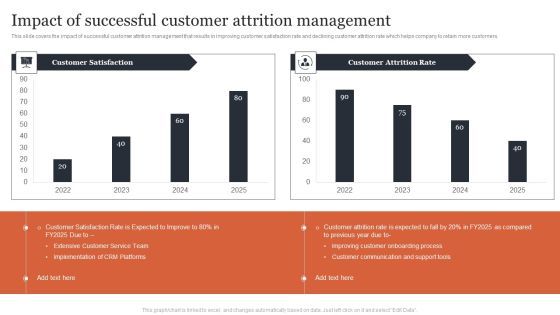
Managing Customer Attrition Impact Of Successful Customer Attrition Management Inspiration PDF
This slide covers the impact of successful customer attrition management that results in improving customer satisfaction rate and declining customer attrition rate which helps company to retain more customers. Do you have an important presentation coming up Are you looking for something that will make your presentation stand out from the rest Look no further than Managing Customer Attrition Impact Of Successful Customer Attrition Management Inspiration PDF. With our professional designs, you can trust that your presentation will pop and make delivering it a smooth process. And with Slidegeeks, you can trust that your presentation will be unique and memorable. So why wait Grab Managing Customer Attrition Impact Of Successful Customer Attrition Management Inspiration PDF today and make your presentation stand out from the rest.
Plan To Enhance Manufacturing Dashboard To Monitor Production Plant Shift Icons PDF
This slide represents the dashboard to monitor production plant efficiency for the multiple shifts. The multiple kpis covered in dashboard are availability, performance of manufacturing plant machines. It also provides information regarding the total downtime along with good parts yield. Presenting this PowerPoint presentation, titled Plan To Enhance Manufacturing Dashboard To Monitor Production Plant Shift Icons PDF, with topics curated by our researchers after extensive research. This editable presentation is available for immediate download and provides attractive features when used. Download now and captivate your audience. Presenting this Plan To Enhance Manufacturing Dashboard To Monitor Production Plant Shift Icons PDF. Our researchers have carefully researched and created these slides with all aspects taken into consideration. This is a completely customizable Plan To Enhance Manufacturing Dashboard To Monitor Production Plant Shift Icons PDF that is available for immediate downloading. Download now and make an impact on your audience. Highlight the attractive features available with our PPTs.
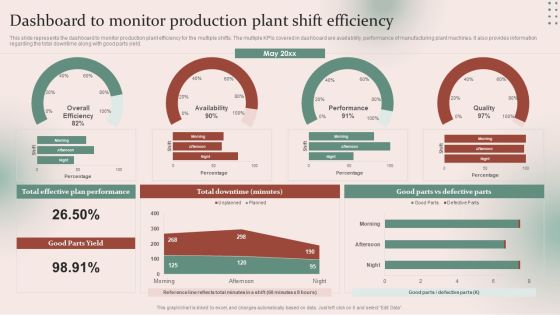
Strategies For Effective Manufacturing Dashboard To Monitor Production Plant Shift Professional PDF
This slide represents the dashboard to monitor production plant efficiency for the multiple shifts. The multiple kpis covered in dashboard are availability, performance of manufacturing plant machines. It also provides information regarding the total downtime along with good parts yield. Presenting this PowerPoint presentation, titled Strategies For Effective Manufacturing Dashboard To Monitor Production Plant Shift Professional PDF, with topics curated by our researchers after extensive research. This editable presentation is available for immediate download and provides attractive features when used. Download now and captivate your audience. Presenting this Strategies For Effective Manufacturing Dashboard To Monitor Production Plant Shift Professional PDF. Our researchers have carefully researched and created these slides with all aspects taken into consideration. This is a completely customizable Strategies For Effective Manufacturing Dashboard To Monitor Production Plant Shift Professional PDF that is available for immediate downloading. Download now and make an impact on your audience. Highlight the attractive features available with our PPTs.
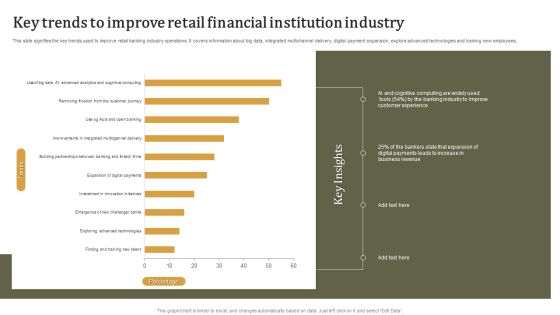
Key Trends To Improve Retail Financial Institution Industry Information PDF
Pitch your topic with ease and precision using this Key Trends To Improve Retail Financial Institution Industry Information PDF. This layout presents information on Improve Retail Financial, Institution Industry. It is also available for immediate download and adjustment. So, changes can be made in the color, design, graphics or any other component to create a unique layout.
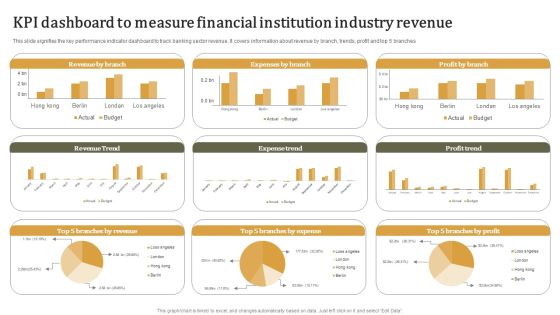
KPI Dashboard To Measure Financial Institution Industry Revenue Summary PDF
Pitch your topic with ease and precision using this KPI Dashboard To Measure Financial Institution Industry Revenue Summary PDF. This layout presents information on Measure Financial, Institution Industry . It is also available for immediate download and adjustment. So, changes can be made in the color, design, graphics or any other component to create a unique layout.

Branch Performance Evaluation Dashboard With Profit And Revenue Diagrams PDF
The slides showcases tips for enhancing branchs workforce performance and efficiency. It covers utilize transaction analysis data, schedule idle time, incent staff for efficiency, get bottom support and use part-time staff.Persuade your audience using this Best Practices To Improve Branch Workforce Performance Evaluation And Efficiency Introduction PDF. This PPT design covers five stages, thus making it a great tool to use. It also caters to a variety of topics including Market Opportunities, Customer Branch, Unnecessary Labor. Download this PPT design now to present a convincing pitch that not only emphasizes the topic but also showcases your presentation skills.
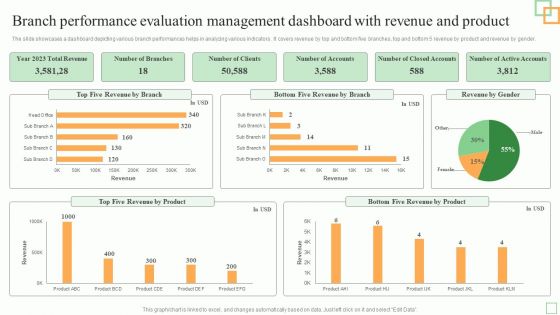
Branch Performance Evaluation Management Dashboard With Revenue And Product Mockup PDF
Pitch your topic with ease and precision using this Branch Performance Evaluation Management Dashboard With Revenue And Product Mockup PDF. This layout presents information on Five Revenue, Revenue Product, Total Revenue. It is also available for immediate download and adjustment. So, changes can be made in the color, design, graphics or any other component to create a unique layout.
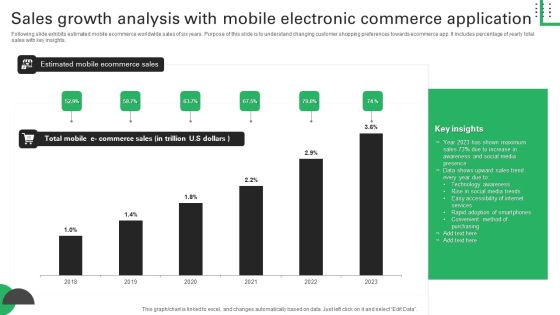
Sales Growth Analysis With Mobile Electronic Commerce Application Structure PDF
Following slide exhibits estimated mobile ecommerce worldwide sales of six years. Purpose of this slide is to understand changing customer shopping preferences towards ecommerce app. It includes percentage of yearly total sales with key insights. Pitch your topic with ease and precision using this Sales Growth Analysis With Mobile Electronic Commerce Application Structure PDF. This layout presents information on Shown Maximum, Awareness Social Media, Accessibility Internet. It is also available for immediate download and adjustment. So, changes can be made in the color, design, graphics or any other component to create a unique layout.
Plan Dashboard For Tracking Location Wise Revenue Diagrams PDF
This slide presents a dashboard which will assist managers to track the revenue of each branch having geographical presence in different corners of the world. The key performance indicators are total revenue, location wise rent, branch performance among many others.Pitch your topic with ease and precision using this Plan Dashboard For Tracking Location Wise Revenue Diagrams PDF. This layout presents information on Taxes Paid, Current Month, Branch Performance, Previous Quarter. It is also available for immediate download and adjustment. So, changes can be made in the color, design, graphics or any other component to create a unique layout.
New Commodity Development Assessment Metrics Icons PDF
The following slide highlights the key metrics to evaluate product performance. It includes elements such as product wise revenue, time to the market etc.Pitch your topic with ease and precision using this New Commodity Development Assessment Metrics Icons PDF. This layout presents information on Annual Product, Wise Revenue, Shown Continuous. It is also available for immediate download and adjustment. So, changes can be made in the color, design, graphics or any other component to create a unique layout.

Comparative Assessment Of Annual Sales Result Evaluation Elements PDF
This slide signifies the comparative analysis of yearly sales result comparison to increase business growth. It includes various strategies that are being implemented by the organisation to achieve growth in each quarter Pitch your topic with ease and precision using this Comparative Assessment Of Annual Sales Result Evaluation Elements PDF. This layout presents information on Telecalling Strategy, Product Sales, Product Lower. It is also available for immediate download and adjustment. So, changes can be made in the color, design, graphics or any other component to create a unique layout.
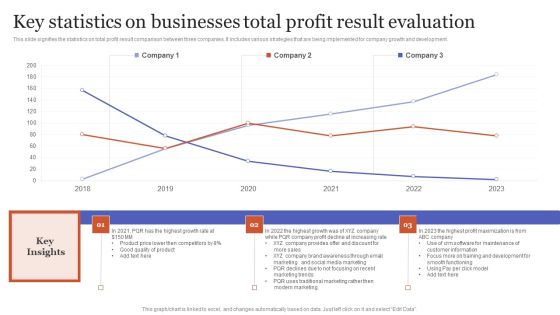
Key Statistics On Businesses Total Profit Result Evaluation Rules PDF
This slide signifies the statistics on total profit result comparison between three companies. It includes various strategies that are being implemented for company growth and development.Pitch your topic with ease and precision using this Key Statistics On Businesses Total Profit Result Evaluation Rules PDF. This layout presents information on Traditional Marketing, Modern Marketing, Training Development. It is also available for immediate download and adjustment. So, changes can be made in the color, design, graphics or any other component to create a unique layout.
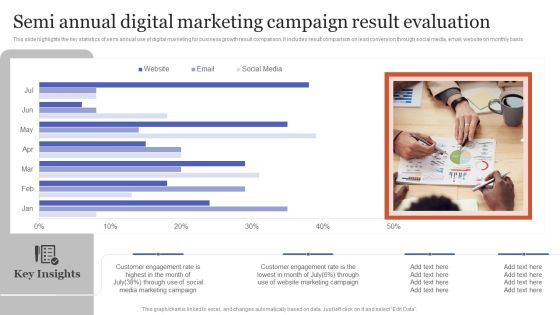
Semi Annual Digital Marketing Campaign Result Evaluation Topics PDF
This slide highlights the key statistics of semi annual use of digital marketing for business growth result comparison. It includes result comparison on lead conversion through social media, email, website on monthly basis. Pitch your topic with ease and precision using this Semi Annual Digital Marketing Campaign Result Evaluation Topics PDF. This layout presents information on Customer Engagement, Marketing Campaign, Through Social. It is also available for immediate download and adjustment. So, changes can be made in the color, design, graphics or any other component to create a unique layout.

Workforce Performance Metrics Scorecard To Measure Training Effectiveness Information PDF
Mentioned slide outlines HR KPI scorecard showcasing most important kpis. Organization can measure the success rate of HR strategy by tracking metrics such as training effectiveness, absence rate and cost, benefits satisfaction, productivity rate, net promotor score, etc.Pitch your topic with ease and precision using this Workforce Performance Metrics Scorecard To Measure Training Effectiveness Information PDF. This layout presents information on Absence Rate, Internal Promotion, Engagement Index. It is also available for immediate download and adjustment. So, changes can be made in the color, design, graphics or any other component to create a unique layout.

Dashboard For Monitoring Construction Project Status And Risk Management Ideas PDF
This slide represents dashboard which is used to track construction project performance for effective risk management progress . It provides information regarding key risk indicators, project completion percentage, project stages, project workload etc. Pitch your topic with ease and precision using this Dashboard For Monitoring Construction Project Status And Risk Management Ideas PDF. This layout presents information on Project Completion Percentage, Key Risk Indicators, Project By Stage. It is also available for immediate download and adjustment. So, changes can be made in the color, design, graphics or any other component to create a unique layout.

Dashboarding Showcasing Employee Information Analytics With Employee Productivity Slides PDF
This slide represents dashboarding showcasing workforce data analysis and assessment to monitor employee engagement. It provides information regarding average productivity, no. of departments, total employees and activity stats. Pitch your topic with ease and precision using this Dashboarding Showcasing Employee Information Analytics With Employee Productivity Slides PDF. This layout presents information on Reimbursement, Productive, Workforce Productivity Stats. It is also available for immediate download and adjustment. So, changes can be made in the color, design, graphics or any other component to create a unique layout.
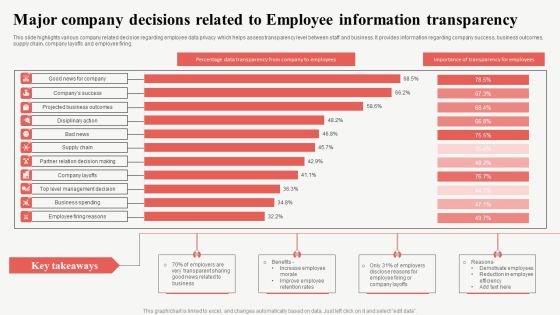
Major Company Decisions Related To Employee Information Transparency Professional PDF
This slide highlights various company related decision regarding employee data privacy which helps assess transparency level between staff and business. It provides information regarding company success, business outcomes, supply chain, company layoffs and employee firing. Pitch your topic with ease and precision using this Major Company Decisions Related To Employee Information Transparency Professional PDF. This layout presents information on Projected Business Outcomes, Supply Chain, Company Layoffs. It is also available for immediate download and adjustment. So, changes can be made in the color, design, graphics or any other component to create a unique layout.
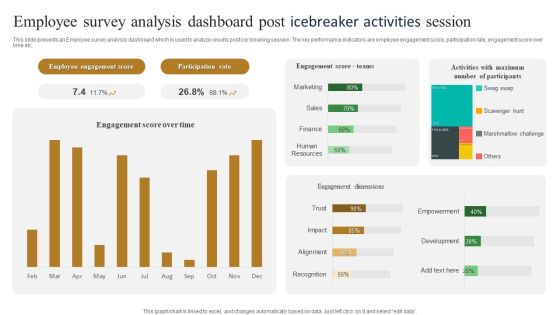
Employee Survey Analysis Dashboard Post Icebreaker Activities Session Slides PDF
This slide presents an Employee survey analysis dashboard which is used to analyze results post ice breaking session. The key performance indicators are employee engagement score, participation rate, engagement score over time etc. Pitch your topic with ease and precision using this Employee Survey Analysis Dashboard Post Icebreaker Activities Session Slides PDF. This layout presents information on Participation Rate, Employee Engagement Score. It is also available for immediate download and adjustment. So, changes can be made in the color, design, graphics or any other component to create a unique layout.

Dashboard To Depict Robot Utilization In Robotic Desktop Automation Download PDF
This slide consists of a Dashboard which can be used by managers to depict robot utilization in attended automation. Key performance indicators relate to total utilization, robot types, hours saved etc. Pitch your topic with ease and precision using this Dashboard To Depict Robot Utilization In Robotic Desktop Automation Download PDF. This layout presents information on Dashboard, Depict Robot Utilization, Robotic Desktop Automation. It is also available for immediate download and adjustment. So, changes can be made in the color, design, graphics or any other component to create a unique layout.

Graphical Representation Of Sectors Deploying Robotic Desktop Automation Formats PDF
This slide showcases a graphical representation of various sectors which employ attended automation for streamlining business activities. The sectors consist of information technology, human resources, finance, sales etc. Pitch your topic with ease and precision using this Graphical Representation Of Sectors Deploying Robotic Desktop Automation Formats PDF. This layout presents information on Productivity, Cost Reductions, Finance. It is also available for immediate download and adjustment. So, changes can be made in the color, design, graphics or any other component to create a unique layout.
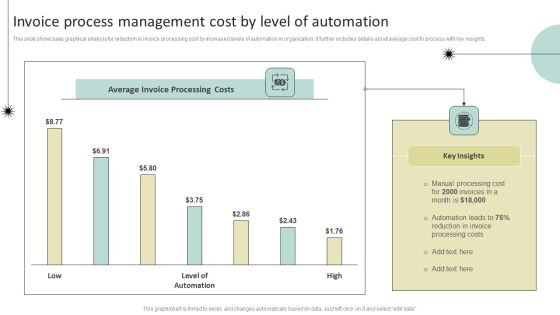
Invoice Process Management Cost By Level Of Automation Demonstration PDF
This slide showcases graphical analysis for reduction in invoice processing cost by increased levels of automation in organization. It further includes details about average cost to process with key insights. Pitch your topic with ease and precision using this Invoice Process Management Cost By Level Of Automation Demonstration PDF. This layout presents information on Average Invoice Processing Costs, Key Insights, Manual Processing Cost. It is also available for immediate download and adjustment. So, changes can be made in the color, design, graphics or any other component to create a unique layout.

Budget Assessment Dashboard With Benefits And Costs Demonstration PDF
The following slide shows budget portfolio for active projects with planned benefits and costs. It provides information about current budget, estimation, finance, marketing, legal, IT, HR, risk reduction, process improvement, etc. Pitch your topic with ease and precision using this Budget Assessment Dashboard With Benefits And Costs Demonstration PDF. This layout presents information on Benefit Plans By Category, Projects Plans, Benefits Category. It is also available for immediate download and adjustment. So, changes can be made in the color, design, graphics or any other component to create a unique layout.

Budget Assessment Dashboard With Total Incomes And Expenses Information PDF
The following slides shows budget portfolio dashboard with incomes and expenses. It includes information about accounts payable, actual income, month, balance, Pitch your topic with ease and precision using this Budget Assessment Dashboard With Total Incomes And Expenses Information PDF. This layout presents information on Actual Income, Actual Expenses. It is also available for immediate download and adjustment. So, changes can be made in the color, design, graphics or any other component to create a unique layout.
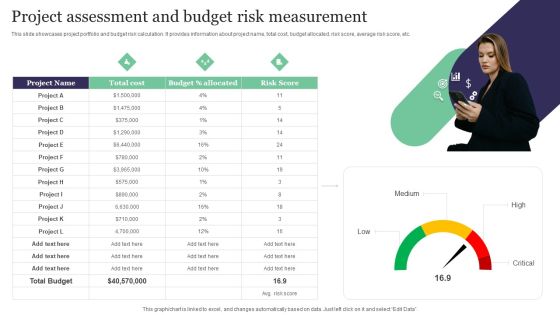
Project Assessment And Budget Risk Measurement Pictures PDF
This slide showcases project portfolio and budget risk calculation. It provides information about project name, total cost, budget allocated, risk score, average risk score, etc. Pitch your topic with ease and precision using this Project Assessment And Budget Risk Measurement Pictures PDF. This layout presents information on Project Assessment, Budget Risk, Measurement. It is also available for immediate download and adjustment. So, changes can be made in the color, design, graphics or any other component to create a unique layout.

Fleet Management Operations Metrics For Logistics Organization Graphics PDF
This slide exhibits logistics operations KPIs dashboard for fleet management. It includes vehicle status, maintenance cost, fuel cost, cost breakdown, and insurance by vehicle type. Pitch your topic with ease and precision using this Fleet Management Operations Metrics For Logistics Organization Graphics PDF. This layout presents information on Cost Breakdown, Vehicle Status, Vehicle By Life Span. It is also available for immediate download and adjustment. So, changes can be made in the color, design, graphics or any other component to create a unique layout.


 Continue with Email
 Sign up for an account
 Home
Home