Bar Graph

Vehicle Management System Dashboard Graphics PDF
This slide represents the dashboard to help fleet managers to monitor the vehicles and the drivers in real-time. It represents KPIs such as vehicle status, service reminders, open issues, inspections summary, service costs etc. Pitch your topic with ease and precision using this Vehicle Management System Dashboard Graphics PDF. This layout presents information on Vehicle Management System, Representing Maintenance Status. It is also available for immediate download and adjustment. So, changes can be made in the color, design, graphics or any other component to create a unique layout.

Vehicle Management System KPI Dashboard Introduction PDF
This slide represents the dashboard showing real time data of fleet management to cut down operational costs and improve efficiency. It includes key metrics such as vehicles with errors, warnings, deviation from route, total vehicles, vehicles condition etc. Pitch your topic with ease and precision using this Vehicle Management System KPI Dashboard Introduction PDF. This layout presents information on Vehicle Management System, KPI Dashboard. It is also available for immediate download and adjustment. So, changes can be made in the color, design, graphics or any other component to create a unique layout.

Change Requests Management And Management Dashboard Clipart PDF
This slide illustrates facts and figures related to managing change requests. It includes request statistics, latest change requests, status by assignee, status by priority, etc. Pitch your topic with ease and precision using this Change Requests Management And Management Dashboard Clipart PDF. This layout presents information on Status By Assignee, Status By Priority, Request Statistics. It is also available for immediate download and adjustment. So, changes can be made in the color, design, graphics or any other component to create a unique layout.
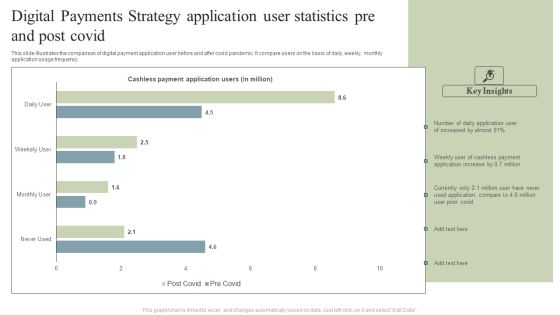
Digital Payments Strategy Application User Statistics Pre And Post Covid Pictures PDF
This slide illustrates the comparison of digital payment application user before and after covid pandemic. It compare users on the basis of daily, weekly, monthly application usage frequency. Pitch your topic with ease and precision using this Digital Payments Strategy Application User Statistics Pre And Post Covid Pictures PDF. This layout presents information on Cashless Payment, Application Users, Cashless Payment, Application Increase. It is also available for immediate download and adjustment. So, changes can be made in the color, design, graphics or any other component to create a unique layout.

B2b Selling Tactics Dashboard To Maintain Productivity Introduction PDF
The following slide represents B2B selling tactics dashboard which allows executives and managers to effectively control sales and monitor them in one central place. It consists of total sales, payments, trends etc.Pitch your topic with ease and precision using this B2b Selling Tactics Dashboard To Maintain Productivity Introduction PDF. This layout presents information on Operational Effects, Stores Sales Trend, Conversion Rate. It is also available for immediate download and adjustment. So, changes can be made in the color, design, graphics or any other component to create a unique layout.
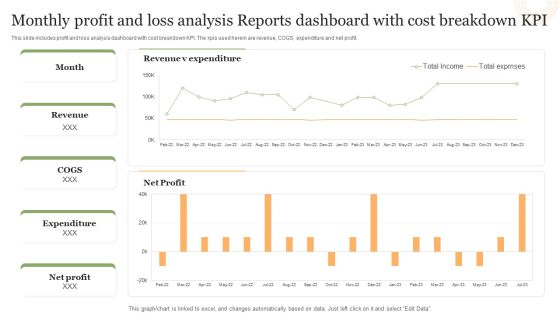
Monthly Profit And Loss Analysis Reports Dashboard With Cost Breakdown Kpi Structure PDF
This slide includes profit and loss analysis dashboard with cost breakdown KPI. The kpis used herein are revenue, COGS, expenditure and net profit.Pitch your topic with ease and precision using this Monthly Profit And Loss Analysis Reports Dashboard With Cost Breakdown Kpi Structure PDF. This layout presents information on Revenue Expenditure, Net Profit, Total Exprnses. It is also available for immediate download and adjustment. So, changes can be made in the color, design, graphics or any other component to create a unique layout.

Monthly Profit And Loss Statement Reports Analysis Dashboard Brochure PDF
This slide shows a monthly profit and loss statement dashboard. The constituting elements herein are total net revenue, cost of goods sold and gross profit.Pitch your topic with ease and precision using this Monthly Profit And Loss Statement Reports Analysis Dashboard Brochure PDF. This layout presents information on Costs Good Sold, Earnings Before, Interest Expense. It is also available for immediate download and adjustment. So, changes can be made in the color, design, graphics or any other component to create a unique layout.
Multiple Project Progress Tracking Report Dashboard With Key Performance Indicators Brochure PDF
This slide shows the dashboard representing status of various projects and tracking their performance with the help of key performance indicators which are as follows schedule, budget, resources, risk and issues and quality of projects.Pitch your topic with ease and precision using this Multiple Project Progress Tracking Report Dashboard With Key Performance Indicators Brochure PDF. This layout presents information on Risks Issues, Quality Open Defects, Techno Blogger. It is also available for immediate download and adjustment. So, changes can be made in the color, design, graphics or any other component to create a unique layout.
Multiple Projects Progress Tracking Report Management Dashboard With Duration Summary PDF
This slide shows the dashboard representing status of various projects which would be helpful in project management. It shows information related to project status, tasks status, milestones completed, upcoming milestones, critical tasks, projects names along with their start and end date, duration etc.Pitch your topic with ease and precision using this Multiple Projects Progress Tracking Report Management Dashboard With Duration Summary PDF. This layout presents information on Start Date, Finish Date, Percent Complete. It is also available for immediate download and adjustment. So, changes can be made in the color, design, graphics or any other component to create a unique layout.
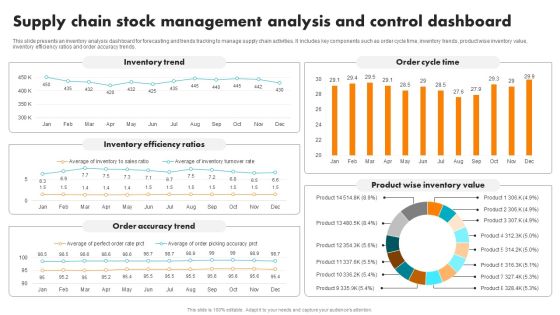
Supply Chain Stock Management Analysis And Control Dashboard Brochure PDF
This slide presents an inventory analysis dashboard for forecasting and trends tracking to manage supply chain activities. It includes key components such as order cycle time, inventory trends, product wise inventory value, inventory efficiency ratios and order accuracy trends. Pitch your topic with ease and precision using this Supply Chain Stock Management Analysis And Control Dashboard Brochure PDF. This layout presents information on Inventory Trend, Inventory Efficiency Ratios, Order Accuracy Trend, Order Cycle Time, Product Wise Inventory Value. It is also available for immediate download and adjustment. So, changes can be made in the color, design, graphics or any other component to create a unique layout.

Building Construction Project Progress Report Map Icon Professional PDF
This slide defines the dashboard for analyzing the status of a building constructing project. It includes information related to progress, cost breakdown, budget and work schedule. Pitch your topic with ease and precision using this Building Construction Project Progress Report Map Icon Professional PDF. This layout presents information on Design Build, Project Start, Project End. It is also available for immediate download and adjustment. So, changes can be made in the color, design, graphics or any other component to create a unique layout.
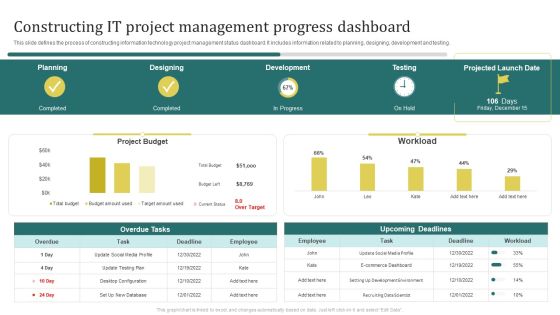
Constructing It Project Management Progress Dashboard Brochure PDF
This slide defines the process of constructing information technology project management status dashboard. It includes information related to planning, designing, development and testing.Pitch your topic with ease and precision using this Constructing It Project Management Progress Dashboard Brochure PDF. This layout presents information on E Commerce Dashboard, Development Environment, Recruiting Data Scientist. It is also available for immediate download and adjustment. So, changes can be made in the color, design, graphics or any other component to create a unique layout.
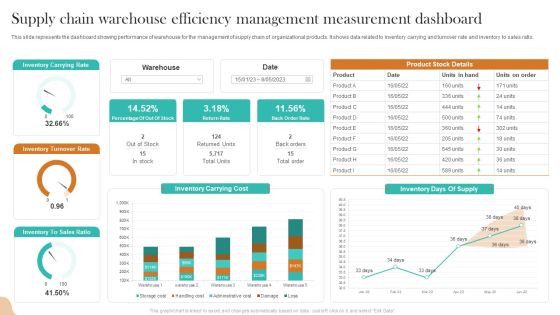
Supply Chain Warehouse Efficiency Management Measurement Dashboard Inspiration PDF
This slide represents the dashboard showing performance of warehouse for the management of supply chain of organizational products. It shows data related to inventory carrying and turnover rate and inventory to sales ratio. Pitch your topic with ease and precision using this Supply Chain Warehouse Efficiency Management Measurement Dashboard Inspiration PDF. This layout presents information on Inventory Carrying Rate, Inventory Turnover Rate, Inventory Carrying Cost. It is also available for immediate download and adjustment. So, changes can be made in the color, design, graphics or any other component to create a unique layout.

Warehouse Efficiency Management Dashboard Showing Query Execution Rules PDF
This slide shows the dashboard representing data related to the performance of warehouse for its management. It shows query- provisioning and overload time along with its execution. Pitch your topic with ease and precision using this Warehouse Efficiency Management Dashboard Showing Query Execution Rules PDF. This layout presents information on Warehouse Performance, Warehouse Size, Database. It is also available for immediate download and adjustment. So, changes can be made in the color, design, graphics or any other component to create a unique layout.
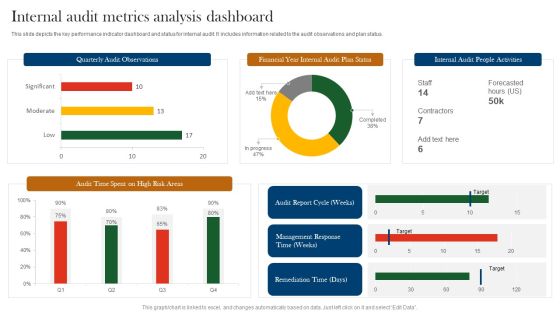
Internal Audit Metrics Analysis Dashboard Ppt Ideas Clipart Images PDF
This slide depicts the key performance indicator dashboard and status for internal audit. It includes information related to the audit observations and plan status. Pitch your topic with ease and precision using this Internal Audit Metrics Analysis Dashboard Ppt Ideas Clipart Images PDF. This layout presents information on Quarterly Audit Observations, Financial Year Internal, Audit Plan Status. It is also available for immediate download and adjustment. So, changes can be made in the color, design, graphics or any other component to create a unique layout.

Internal Audit Metrics Dashboard And Status Ppt Layouts Graphic Images PDF
This slide covers the key performance indicator dashboard and status for internal audit. It includes information related to the audit status and risk rating. Pitch your topic with ease and precision using this Internal Audit Metrics Dashboard And Status Ppt Layouts Graphic Images PDF. This layout presents information on Audit Status, Risk Rating, Auditable Entry. It is also available for immediate download and adjustment. So, changes can be made in the color, design, graphics or any other component to create a unique layout.
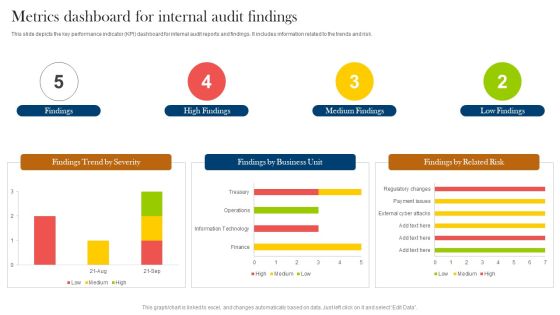
Metrics Dashboard For Internal Audit Findings Ppt Styles Gallery PDF
This slide depicts the key performance indicator KPI dashboard for internal audit reports and findings. It includes information related to the trends and risk. Pitch your topic with ease and precision using this Metrics Dashboard For Internal Audit Findings Ppt Styles Gallery PDF. This layout presents information on Findings, High Findings, Medium Findings, Low Findings. It is also available for immediate download and adjustment. So, changes can be made in the color, design, graphics or any other component to create a unique layout.

Key Performance Indicators Of The Internal Metrics Audit Function Infographics PDF
This slide defines the graphical representation of internal audit key performance indicators. It is a comparison of the means used to evaluate the performance of the internal audit function. Pitch your topic with ease and precision using this Key Performance Indicators Of The Internal Metrics Audit Function Infographics PDF. This layout presents information on High Variance, Budget To Actual, Audit Functions. It is also available for immediate download and adjustment. So, changes can be made in the color, design, graphics or any other component to create a unique layout.

Multiplayer Startup Online Business Simulation Dashboard Demonstration PDF
This slide showcases multiplier startup business simulation dashboard. It provides information about individuals, statistics, team processes, adoption, effectiveness, meetings, alignment, communication, etc. Pitch your topic with ease and precision using this Multiplayer Startup Online Business Simulation Dashboard Demonstration PDF. This layout presents information on Individuals, Team Processes, Statistics. It is also available for immediate download and adjustment. So, changes can be made in the color, design, graphics or any other component to create a unique layout.

Online Business Simulation Activity Dashboard With Quarterly Performance Details Guidelines PDF
This slide shows business simulation tasks with performance information. It provides information about financial and production advisor comments, revenue, rivals, profit, strategies, etc. Pitch your topic with ease and precision using this Online Business Simulation Activity Dashboard With Quarterly Performance Details Guidelines PDF. This layout presents information on Financial Adviser, Production Adviser, Revenue. It is also available for immediate download and adjustment. So, changes can be made in the color, design, graphics or any other component to create a unique layout.
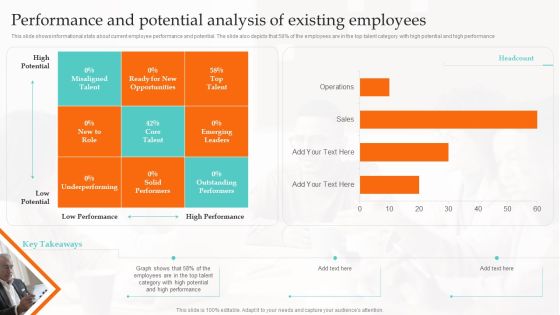
Performance And Potential Analysis Of Existing Ultimate Guide To Employee Succession Planning Designs PDF
This slide shows informational stats about current employee performance and potential. The slide also depicts that 58 precent of the employees are in the top talent category with high potential and high performance Do you have an important presentation coming up Are you looking for something that will make your presentation stand out from the rest Look no further than Performance And Potential Analysis Of Existing Ultimate Guide To Employee Succession Planning Designs PDF. With our professional designs, you can trust that your presentation will pop and make delivering it a smooth process. And with Slidegeeks, you can trust that your presentation will be unique and memorable. So why wait Grab Performance And Potential Analysis Of Existing Ultimate Guide To Employee Succession Planning Designs PDF today and make your presentation stand out from the rest.
Integrating AI To Enhance Dashboard For Tracking Impact Of Supply Chain Automation Themes PDF
This slide covers the dashboard for back-end tracking of overall impact automation. It include KPIs such as retailer capacity, warehouse capacity, truck efficiency, time to reach warehouse, sustainability, etc. Do you have an important presentation coming up Are you looking for something that will make your presentation stand out from the rest Look no further than Integrating AI To Enhance Dashboard For Tracking Impact Of Supply Chain Automation Themes PDF. With our professional designs, you can trust that your presentation will pop and make delivering it a smooth process. And with Slidegeeks, you can trust that your presentation will be unique and memorable. So why wait Grab Integrating AI To Enhance Dashboard For Tracking Impact Of Supply Chain Automation Themes PDF today and make your presentation stand out from the rest.
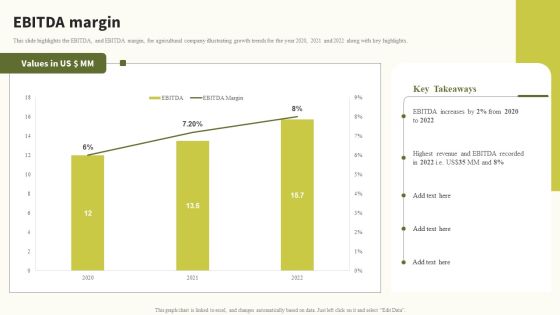
Ebitda Margin Global Food Products Company Profile Slides PDF
This slide highlights the EBITDA, and EBITDA margin, for agricultural company illustrating growth trends for the year 2020, 2021 and 2022 along with key highlights.Presenting this PowerPoint presentation, titled Ebitda Margin Global Food Products Company Profile Slides PDF, with topics curated by our researchers after extensive research. This editable presentation is available for immediate download and provides attractive features when used. Download now and captivate your audience. Presenting this Ebitda Margin Global Food Products Company Profile Slides PDF. Our researchers have carefully researched and created these slides with all aspects taken into consideration. This is a completely customizable Ebitda Margin Global Food Products Company Profile Slides PDF that is available for immediate downloading. Download now and make an impact on your audience. Highlight the attractive features available with our PPTs.

Successful Branding Technique For Electronic Commerce Corporation Key Strategies To Deliver Better Customer Service Clipart PDF
Do you have an important presentation coming up. Are you looking for something that will make your presentation stand out from the rest. Look no further than Successful Branding Technique For Electronic Commerce Corporation Key Strategies To Deliver Better Customer Service Clipart PDF. With our professional designs, you can trust that your presentation will pop and make delivering it a smooth process. And with Slidegeeks, you can trust that your presentation will be unique and memorable. So why wait. Grab Successful Branding Technique For Electronic Commerce Corporation Key Strategies To Deliver Better Customer Service Clipart PDF today and make your presentation stand out from the rest.
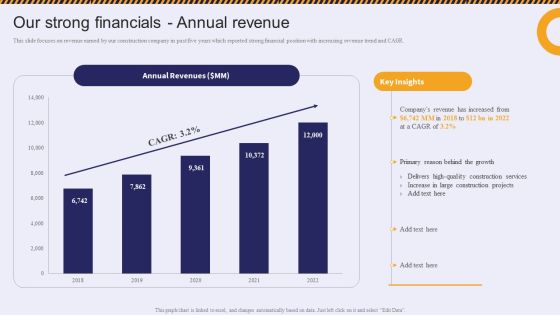
Our Strong Financials Annual Revenue Residential And Commercial Building Construction Topics PDF
This slide focuses on revenue earned by our construction company in past five years which reported strong financial position with increasing revenue trend and CAGR.This Our Strong Financials Annual Revenue Residential And Commercial Building Construction Topics PDF from Slidegeeks makes it easy to present information on your topic with precision. It provides customization options, so you can make changes to the colors, design, graphics, or any other component to create a unique layout. It is also available for immediate download, so you can begin using it right away. Slidegeeks has done good research to ensure that you have everything you need to make your presentation stand out. Make a name out there for a brilliant performance.

Creating Mobile Application For Android Ios Vs Android Market Share From 2012Q1 2021Q1 Formats PDF
Make sure to capture your audiences attention in your business displays with our gratis customizable Creating Mobile Application For Android Ios Vs Android Market Share From 2012Q1 2021Q1 Formats PDF. These are great for business strategies, office conferences, capital raising or task suggestions. If you desire to acquire more customers for your tech business and ensure they stay satisfied, create your own sales presentation with these plain slides.

Talent Administration And Succession Determining Employee Motivation Factors Information PDF
Mentioned slide illustrates information about employee motivation factors along with the details about most dominating factor that impact employee performance. Do you have an important presentation coming up Are you looking for something that will make your presentation stand out from the rest Look no further than Talent Administration And Succession Determining Employee Motivation Factors Information PDF. With our professional designs, you can trust that your presentation will pop and make delivering it a smooth process. And with Slidegeeks, you can trust that your presentation will be unique and memorable. So why wait Grab Talent Administration And Succession Determining Employee Motivation Factors Information PDF today and make your presentation stand out from the rest.
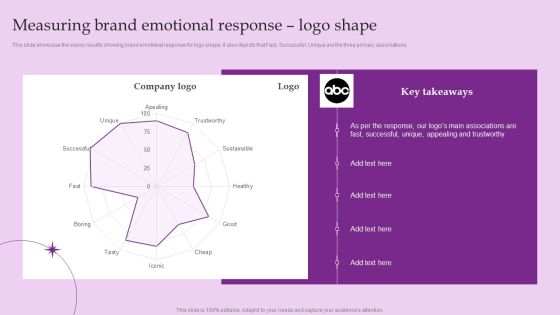
Measuring Brand Emotional Response Logo Shape Brand And Equity Evaluation Techniques Introduction PDF
This slide showcase the survey results showing brand emotional response for logo shape. It also depicts that Fast, Successful, Unique are the three primary associations. This Measuring Brand Emotional Response Logo Shape Brand And Equity Evaluation Techniques Introduction PDF from Slidegeeks makes it easy to present information on your topic with precision. It provides customization options, so you can make changes to the colors, design, graphics, or any other component to create a unique layout. It is also available for immediate download, so you can begin using it right away. Slidegeeks has done good research to ensure that you have everything you need to make your presentation stand out. Make a name out there for a brilliant performance.
Test Conclusion Most Famous Assets Brand And Equity Evaluation Techniques Icons PDF
Following slide addresses the results of brand asset test. It shows that most recognizable assets of the company are its Logo style, Product and its Packaging.Presenting this PowerPoint presentation, titled Test Conclusion Most Famous Assets Brand And Equity Evaluation Techniques Icons PDF, with topics curated by our researchers after extensive research. This editable presentation is available for immediate download and provides attractive features when used. Download now and captivate your audience. Presenting this Test Conclusion Most Famous Assets Brand And Equity Evaluation Techniques Icons PDF. Our researchers have carefully researched and created these slides with all aspects taken into consideration. This is a completely customizable Test Conclusion Most Famous Assets Brand And Equity Evaluation Techniques Icons PDF that is available for immediate downloading. Download now and make an impact on your audience. Highlight the attractive features available with our PPTs.
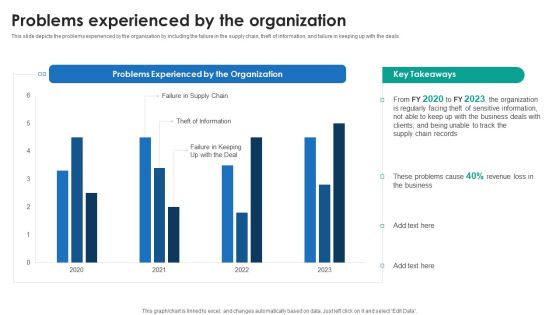
P2P Ledger Problems Experienced By The Organization Slides PDF
This slide depicts the problems experienced by the organization by including the failure in the supply chain, theft of information, and failure in keeping up with the deals. This P2P Ledger Problems Experienced By The Organization Slides PDF from Slidegeeks makes it easy to present information on your topic with precision. It provides customization options, so you can make changes to the colors, design, graphics, or any other component to create a unique layout. It is also available for immediate download, so you can begin using it right away. Slidegeeks has done good research to ensure that you have everything you need to make your presentation stand out. Make a name out there for a brilliant performance.

Integration Automation Major Players Of Global Workflow Automation Market Topics PDF
This slide showcases the comparison of market share percentage among the major player of workflow automation market. It includes companies such as IBM, oracle, Ipsoft, Bizagi, newgen software technology, etc. Make sure to capture your audiences attention in your business displays with our gratis customizable Integration Automation Major Players Of Global Workflow Automation Market Topics PDF. These are great for business strategies, office conferences, capital raising or task suggestions. If you desire to acquire more customers for your tech business and ensure they stay satisfied, create your own sales presentation with these plain slides.

Project Tasks Completion Status Summary By Marketing Manager Mockup PDF
This slide shows the report prepared by the marketing teams manager showing the completion status of the marketing teams project. It includes details related to projects health, tasks, progress, time, cost and workload etc. Pitch your topic with ease and precision using thisProject Tasks Completion Status Summary By Marketing Manager Mockup PDF. This layout presents information on Project Tasks, Completion Status, Summary Marketing Manager. It is also available for immediate download and adjustment. So, changes can be made in the color, design, graphics or any other component to create a unique layout.
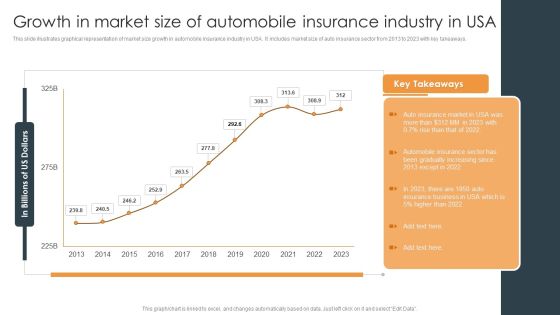
Growth In Market Size Of Automobile Insurance Industry In USA Rules PDF
Pitch your topic with ease and precision using this Growth In Market Size Of Automobile Insurance Industry In USA Rules PDF. This layout presents information on Growth In Growth In Market, Size Of Automobile, Insurance Industry. It is also available for immediate download and adjustment. So, changes can be made in the color, design, graphics or any other component to create a unique layout.

Successful Brand Management Brand Equity Performance Assessment Dashboard Slides PDF
This slide provides information regarding brand equity performance assessment dashboard that highlights customer lifecycle value, customer adoption rate, mentions, engagement, etc. Do you have an important presentation coming up Are you looking for something that will make your presentation stand out from the rest Look no further than Successful Brand Management Brand Equity Performance Assessment Dashboard Slides PDF. With our professional designs, you can trust that your presentation will pop and make delivering it a smooth process. And with Slidegeeks, you can trust that your presentation will be unique and memorable. So why wait Grab Successful Brand Management Brand Equity Performance Assessment Dashboard Slides PDF today and make your presentation stand out from the rest.

Cyber Security Incident Analytics Dashboard With Level Of Security Ppt Ideas Graphics Tutorials PDF
The given slide depicts the cyber threat analytics to track the attacks. It includes the no. of incidents, open and solved tickets, category wise no. of incidents along with malware type etc. Pitch your topic with ease and precision using this Cyber Security Incident Analytics Dashboard With Level Of Security Ppt Ideas Graphics Tutorials PDF. This layout presents information on Power Security Team, Open Incidents, Incidents Solved, Open Tickets. It is also available for immediate download and adjustment. So, changes can be made in the color, design, graphics or any other component to create a unique layout.

Dashboard Showcasing Impact Of Blog Content Marketing Plan Summary PDF
This slide illustrates dashboard showcasing impact of blog content marketing strategy implemented to increase product awareness and conversion rates. It provides various KPIs such as, followers, likes, reach, user engagement, website visits etc. Pitch your topic with ease and precision using this Dashboard Showcasing Impact Of Blog Content Marketing Plan Summary PDF. This layout presents information on User Engagement, Monthly Website Visits, Spend Lifetime Value, Payback Time. It is also available for immediate download and adjustment. So, changes can be made in the color, design, graphics or any other component to create a unique layout.
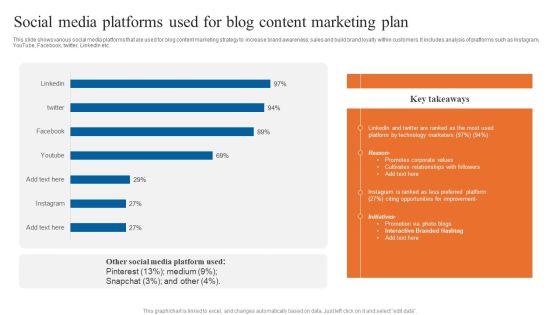
Social Media Platforms Used For Blog Content Marketing Plan Portrait PDF
This slide shows various social media platforms that are used for blog content marketing strategy to increase brand awareness, sales and build brand loyalty within customers. It includes analysis of platforms such as Instagram, YouTube, Facebook, twitter, LinkedIn etc. Pitch your topic with ease and precision using this Social Media Platforms Used For Blog Content Marketing Plan Portrait PDF. This layout presents information on Social Media Platforms, Content Marketing Plan, Promotes Corporate Values. It is also available for immediate download and adjustment. So, changes can be made in the color, design, graphics or any other component to create a unique layout.

Consumer Risk Assessment Dashboard Reporting Ppt Layouts Ideas PDF
This slide showcases the customer risk assessment dashboard with major kpis. It includes reporting risks summary, risk mitigation, risk profile, and detail. It also reflects the risk score and score distribution across different areas and activities. Pitch your topic with ease and precision using this Consumer Risk Assessment Dashboard Reporting Ppt Layouts Ideas PDF. This layout presents information on Risk Summary, Customer Risk Dashboard, Risk Profile. It is also available for immediate download and adjustment. So, changes can be made in the color, design, graphics or any other component to create a unique layout.

Advantages Of Consumer Level Risk Assessment And Management For Banks Infographics PDF
This slide highlights the implemention of customer level risk assessment and management by banks. it includes the transformation of customer centric retail strategy from product based risk management and operations of traditional banking to bank wide holistic customer oriented customer level management. Pitch your topic with ease and precision using this Advantages Of Consumer Level Risk Assessment And Management For Banks Infographics PDF. This layout presents information on Reduced Risk, Increased Profits, Accelerated Marketing. It is also available for immediate download and adjustment. So, changes can be made in the color, design, graphics or any other component to create a unique layout.

Weekly Sales Performance KPI Dashboard For Revenue Generation Brochure PDF
The following slide exhibits dashboard to maintain revenue and management under control. It presents information related to profits, cross selling, costs, etc. Pitch your topic with ease and precision using this Weekly Sales Performance KPI Dashboard For Revenue Generation Brochure PDF. This layout presents information on Total Sales, Revenue, Profit, Cost. It is also available for immediate download and adjustment. So, changes can be made in the color, design, graphics or any other component to create a unique layout.

Risk Assessment Project Portfolio Roadmap And Health Status Summary Mockup PDF
This slide covers timeline and health status report for risk assessment project. It includes KPIs such as BRMS build, customer support, risk assess, credit research and rules engine. Pitch your topic with ease and precision using this Risk Assessment Project Portfolio Roadmap And Health Status Summary Mockup PDF. This layout presents information on Risk Assessment Project, Portfolio Roadmap, Health Status Summary. It is also available for immediate download and adjustment. So, changes can be made in the color, design, graphics or any other component to create a unique layout.

Email Marketing Campaign Outcomes And Social Media Marketing Result Analysis Dashboard Mockup PDF
This slide depicts the dashboard for analyzing the results of email campaign and social media marketing. It includes information related to the comparison, statistics, usage, etc. Pitch your topic with ease and precision using this Email Marketing Campaign Outcomes And Social Media Marketing Result Analysis Dashboard Mockup PDF. This layout presents information on Email Marketing Campaign, Outcomes And Social Media, Marketing Result, Analysis Dashboard. It is also available for immediate download and adjustment. So, changes can be made in the color, design, graphics or any other component to create a unique layout.
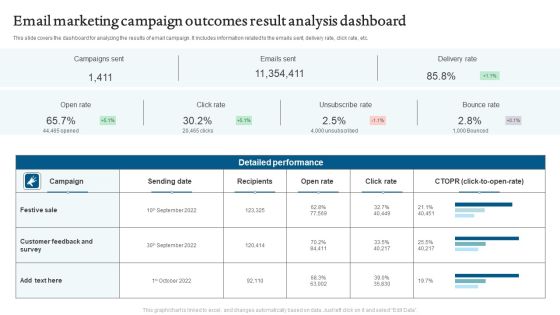
Email Marketing Campaign Outcomes Result Analysis Dashboard Mockup PDF
This slide covers the dashboard for analyzing the email campaign metrics. It includes information related to engagement a key performance indicator KPIs. Pitch your topic with ease and precision using this Email Marketing Campaign Outcomes Result Analysis Dashboard Mockup PDF. This layout presents information on Campaigns Sent, Emails Sent, Delivery Rate. It is also available for immediate download and adjustment. So, changes can be made in the color, design, graphics or any other component to create a unique layout.
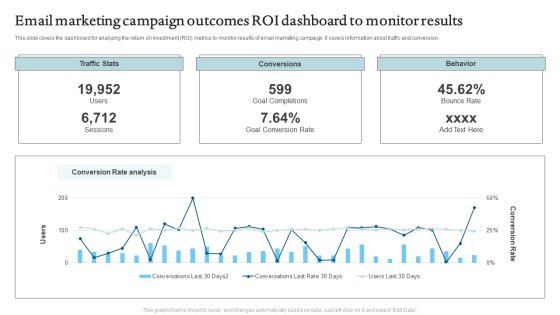
Email Marketing Campaign Outcomes ROI Dashboard To Monitor Results Formats PDF
This slide depicts the dashboard for analyzing the marketing results and campaign performance. It includes information related email sent, delivered, conversions, etc. Pitch your topic with ease and precision using this Email Marketing Campaign Outcomes ROI Dashboard To Monitor Results Formats PDF. This layout presents information on Traffic Stats, Conversions, Behavior. It is also available for immediate download and adjustment. So, changes can be made in the color, design, graphics or any other component to create a unique layout.
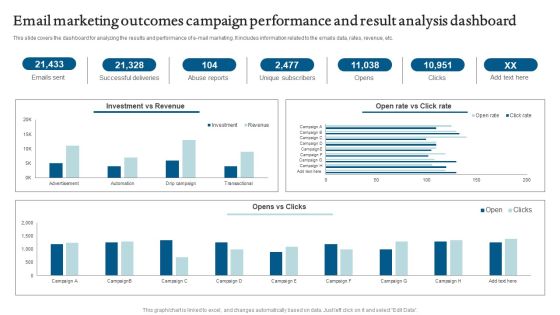
Email Marketing Outcomes Campaign Performance And Result Analysis Dashboard Introduction PDF
Pitch your topic with ease and precision using this Email Marketing Outcomes Campaign Performance And Result Analysis Dashboard Introduction PDF. This layout presents information on Email Marketing Outcomes, Campaign Performance, Result Analysis Dashboard. It is also available for immediate download and adjustment. So, changes can be made in the color, design, graphics or any other component to create a unique layout.
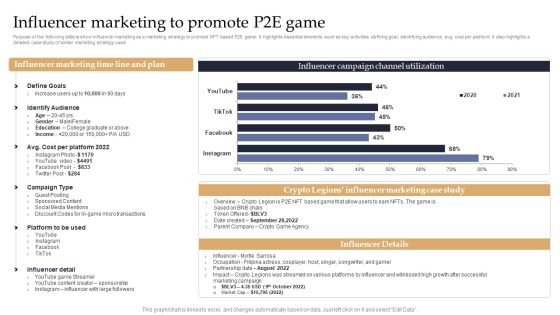
Web 3 0 Blockchain Based P2E Mobile Game Sector Report Promotional Plan Influencer Marketing Formats PDF
Purpose of the following slide is show influencer marketing as a marketing strategy to promote NFT based P2E game. It highlights essential elements such as key activities defining goal, identifying audience, avg. cost per platform. It also highlights a detailed case study of similar marketing strategy used. Do you have an important presentation coming up. Are you looking for something that will make your presentation stand out from the rest. Look no further than Web 3 0 Blockchain Based P2E Mobile Game Sector Report Promotional Plan Influencer Marketing Formats PDF. With our professional designs, you can trust that your presentation will pop and make delivering it a smooth process. And with Slidegeeks, you can trust that your presentation will be unique and memorable. So why wait. Grab Web 3 0 Blockchain Based P2E Mobile Game Sector Report Promotional Plan Influencer Marketing Themes PDF today and make your presentation stand out from the rest.
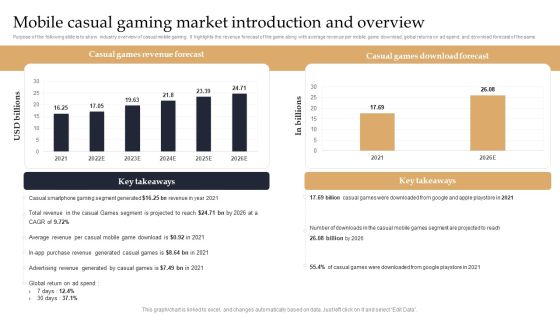
Web 3 0 Blockchain Based P2E Mobile Game Sector Report Promotional Plan Mobile Casual Gaming Market Introduction Elements PDF
Purpose of the following slide is to show industry overview of casual mobile gaming. It highlights the revenue forecast of the game along with average revenue per mobile game download, global returns on ad spend, and download forecast of the same. Make sure to capture your audiences attention in your business displays with our gratis customizableWeb 3 0 Blockchain Based P2E Mobile Game Sector Report Promotional Plan Mobile Casual Gaming Market Introduction Elements PDF. These are great for business strategies, office conferences, capital raising or task suggestions. If you desire to acquire more customers for your tech business and ensure they stay satisfied, create your own sales presentation with these plain slides.

Employee Recruitment Analysis KPI Dashboard Slides PDF
The following slide presents a hiring assessment dashboard to manage HR metrics. It includes KPIs such as average time taken, cost required in hiring process along with the major sources of recruitment etc. Pitch your topic with ease and precision using this Employee Recruitment Analysis KPI Dashboard Slides PDF. This layout presents information on Agile Hiring, Non Agile Hiring, Hiring Cost Assessment. It is also available for immediate download and adjustment. So, changes can be made in the color, design, graphics or any other component to create a unique layout.

Improving Corporate Performance Overview Of Financial Loss Incurred By The Firm Due Ideas PDF
Mentioned slide displays informational stats about financial loss incurred by the firm caused due to risk events. Risk event categories covered in the slide are sales practices, fraud activities, technology failure and natural disaster. Make sure to capture your audiences attention in your business displays with our gratis customizable Improving Corporate Performance Overview Of Financial Loss Incurred By The Firm Due Ideas PDF. These are great for business strategies, office conferences, capital raising or task suggestions. If you desire to acquire more customers for your tech business and ensure they stay satisfied, create your own sales presentation with these plain slides.

Deploying And Managing Recurring Recurring Revenue Dashboard Designs PDF
The following slide display recurring revenue generated over the year, the following dashboard displays MRR, churn rate net recurring revenue and growth rate. Make sure to capture your audiences attention in your business displays with our gratis customizable Deploying And Managing Recurring Recurring Revenue Dashboard Designs PDF. These are great for business strategies, office conferences, capital raising or task suggestions. If you desire to acquire more customers for your tech business and ensure they stay satisfied, create your own sales presentation with these plain slides.

Executing Diversity KPI Dashboard To Monitor Workforce Executing Diversity Structure PDF
This slide illustrates the KPI dashboard for workforce diversity providing details regarding headcount by seniority, gender and gender. It also provides information regarding monthly median age by gender and women at senior level forecast. Presenting this PowerPoint presentation, titled Executing Diversity KPI Dashboard To Monitor Workforce Executing Diversity Structure PDF, with topics curated by our researchers after extensive research. This editable presentation is available for immediate download and provides attractive features when used. Download now and captivate your audience. Presenting this Executing Diversity KPI Dashboard To Monitor Workforce Executing Diversity Structure PDF. Our researchers have carefully researched and created these slides with all aspects taken into consideration. This is a completely customizable Executing Diversity KPI Dashboard To Monitor Workforce Executing Diversity Structure PDF that is available for immediate downloading. Download now and make an impact on your audience. Highlight the attractive features available with our PPTs.

Equity Funding And Debt Financing Pitchbook Major Client And Total Revenue Graphics PDF
The slide provides a list of companys clients in different sectors manufacturing, construction, financials services, energy. Mining, automobile etc. along with the total revenue from each sector. Make sure to capture your audiences attention in your business displays with our gratis customizable Equity Funding And Debt Financing Pitchbook Major Client And Total Revenue Graphics PDF. These are great for business strategies, office conferences, capital raising or task suggestions. If you desire to acquire more customers for your tech business and ensure they stay satisfied, create your own sales presentation with these plain slides.
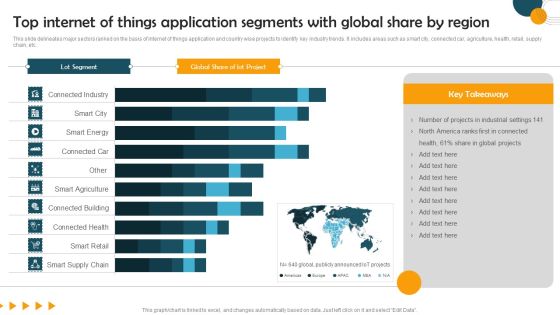
Top Internet Of Things Application Segments With Global Share By Region Formats PDF
This slide delineates major sectors ranked on the basis of internet of things application and country wise projects to identify key industry trends. It includes areas such as smart city, connected car, agriculture, health, retail, supply chain, etc. Pitch your topic with ease and precision using this Top Internet Of Things Application Segments With Global Share By Region Formats PDF. This layout presents information on Lot Segment, Global Share, lot Project. It is also available for immediate download and adjustment. So, changes can be made in the color, design, graphics or any other component to create a unique layout.

Client Acquisition Journey Plan Impact 1 Increased Customer Churn Rate Pictures PDF
This slide showcases the negative impact of customer onboarding challenges on the business. The challenges covered are increased user churn rate and number of onboarding support tickets. Make sure to capture your audiences attention in your business displays with our gratis customizable Client Acquisition Journey Plan Impact 1 Increased Customer Churn Rate Pictures PDF. These are great for business strategies, office conferences, capital raising or task suggestions. If you desire to acquire more customers for your tech business and ensure they stay satisfied, create your own sales presentation with these plain slides.

Comprehensive Market Research Guide Growth Opportunities In Market Research Industry Diagrams PDF
The following slide outlines market size of global market research industry. Information covered in this slide is related to projected revenue from 2022 to 2030 and compound annual growth rate CAGR. Make sure to capture your audiences attention in your business displays with our gratis customizable Comprehensive Market Research Guide Growth Opportunities In Market Research Industry Diagrams PDF. These are great for business strategies, office conferences, capital raising or task suggestions. If you desire to acquire more customers for your tech business and ensure they stay satisfied, create your own sales presentation with these plain slides.

Customer Support Services Customer Support Service Analysis Dashboard Rules PDF
This slide exhibits customer service dashboard to improve visibility. The dashboard includes resolved and active cases, incoming cases by subject, priority, SLA status and age, CSAT and escalated case volume. Make sure to capture your audiences attention in your business displays with our gratis customizable Customer Support Services Customer Support Service Analysis Dashboard Rules PDF. These are great for business strategies, office conferences, capital raising or task suggestions. If you desire to acquire more customers for your tech business and ensure they stay satisfied, create your own sales presentation with these plain slides.

Economic Survey Analysis Highlighting COVID Impact On US Inflation Information PDF
This slide shows economic survey indicating coronavirus impact on USs inflation. It provides information such as cost price index, retailers, manufacturers, revenue, loss recovery, etc. Pitch your topic with ease and precision using this Economic Survey Analysis Highlighting COVID Impact On US Inflation Information PDF. This layout presents information on Economic Survey Analysis, Highlighting COVID, Impact On US Inflation. It is also available for immediate download and adjustment. So, changes can be made in the color, design, graphics or any other component to create a unique layout.
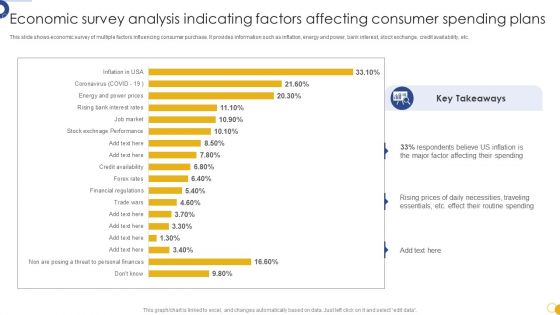
Economic Survey Analysis Indicating Factors Affecting Consumer Spending Plans Download PDF
This slide shows economic survey of multiple factors influencing consumer purchase. It provides information such as inflation, energy and power, bank interest, stock exchange, credit availability, etc. Pitch your topic with ease and precision using this Economic Survey Analysis Indicating Factors Affecting Consumer Spending Plans Download PDF. This layout presents information on Economic Survey Analysis, Indicating Factors Affecting, Consumer Spending Plans. It is also available for immediate download and adjustment. So, changes can be made in the color, design, graphics or any other component to create a unique layout.

Survey Analysis Illustrating Public Priority For Improving US Economic Condition Graphics PDF
This slide shows economic survey displaying US population priority for bringing improvement in the country. It provides information about healthcare, education, COVID 19, crime, jobs, military, climate, trade, social security, Russia-Ukraine war, etc. Pitch your topic with ease and precision using this Survey Analysis Illustrating Public Priority For Improving US Economic Condition Graphics PDF. This layout presents information on Survey Analysis, Illustrating Public, Priority Improving US Economic. It is also available for immediate download and adjustment. So, changes can be made in the color, design, graphics or any other component to create a unique layout.

US Economic Survey Analysis Representing Household Spending Slides PDF
This slide shows united states economic survey showing residential population spends. It provides information about food and beverages, consumption, maintenance, education, transportation, etc. Pitch your topic with ease and precision using this US Economic Survey Analysis Representing Household Spending Slides PDF. This layout presents information on US Economic Survey, Analysis Representing Household. It is also available for immediate download and adjustment. So, changes can be made in the color, design, graphics or any other component to create a unique layout.


 Continue with Email
 Sign up for an account
 Home
Home