Bar Graph

Net Cash Flow To Measure Monetary Financial Study Ppt Layouts Clipart Images PDF
This slide shows net cash flow measurement of financial feasibility to assess the practicality of project. It includes factors such as amount and cumulative net cash flow. Pitch your topic with ease and precision using this Net Cash Flow To Measure Monetary Financial Study Ppt Layouts Clipart Images PDF. This layout presents information on Cash Flow, Profit Generation, Quick Payment Terms. It is also available for immediate download and adjustment. So, changes can be made in the color, design, graphics or any other component to create a unique layout.
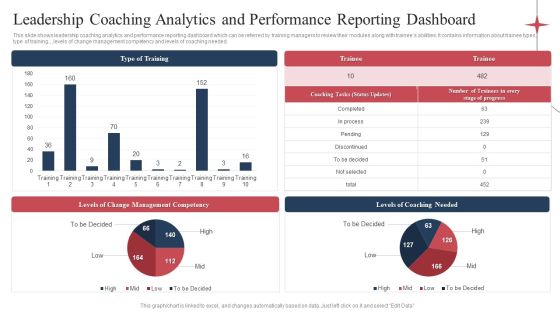
Leadership Coaching Analytics And Performance Reporting Dashboard Demonstration PDF
This slide shows leadership coaching analytics and performance reporting dashboard which can be referred by training managers to review their modules along with trainees abilities. It contains information about trainee types, type of training., ,levels of change management competency and levels of coaching needed. Pitch your topic with ease and precision using this Leadership Coaching Analytics And Performance Reporting Dashboard Demonstration PDF. This layout presents information on Levels Coaching Needed, Levels Change Management, Type Training. It is also available for immediate download and adjustment. So, changes can be made in the color, design, graphics or any other component to create a unique layout.
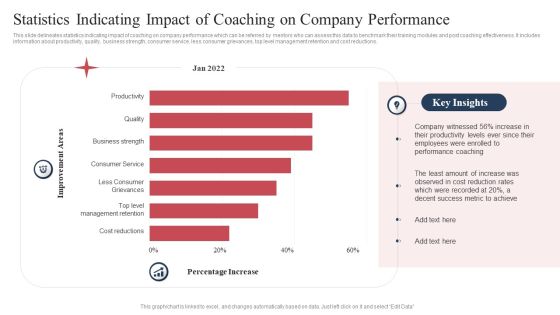
Statistics Indicating Impact Of Coaching On Company Performance Formats PDF
This slide delineates statistics indicating impact of coaching on company performance which can be referred by mentors who can assess this data to benchmark their training modules and post coaching effectiveness. It includes information about productivity, quality, business strength, consumer service, less consumer grievances, top level management retention and cost reductions. Pitch your topic with ease and precision using this Statistics Indicating Impact Of Coaching On Company Performance Formats PDF. This layout presents information on Productivity, Quality, Business Strength. It is also available for immediate download and adjustment. So, changes can be made in the color, design, graphics or any other component to create a unique layout.

Cyber Security Key Performance Indicators Metrics Dashboard Mockup PDF
This slide covers cyber security health status dashboard . It also includes audit and compliance, controls health, project status, incident response process, vulnerability patching schedule, investigation process and training compliance. Pitch your topic with ease and precision using this Cyber Security Key Performance Indicators Metrics Dashboard Mockup PDF. This layout presents information on Cyber Security, Vulnerability Patching Schedule, Compliance Investigation Process. It is also available for immediate download and adjustment. So, changes can be made in the color, design, graphics or any other component to create a unique layout.

Cyber Security Program Management Dashboard With KPI Metrics Ideas PDF
The following slide shows dashboard of CPM cyber security program management which helps to access high value assets and check threats , risks and policies on one platform. It includes current threat postures, risks, policy, service breakdown, assets by category and their control issues. Pitch your topic with ease and precision using this Cyber Security Program Management Dashboard With KPI Metrics Ideas PDF. This layout presents information on Cyber Security, Program Management Dashboard, Kpi Metrics. It is also available for immediate download and adjustment. So, changes can be made in the color, design, graphics or any other component to create a unique layout.

Cyber Security Team Analytics Dashboard With KPI Metrics Icons PDF
The following slide shows cyber analytics dashboard to monitor and inspect threats and accordingly plan preventive actions. It includes open and resolved incidents and tickets. Pitch your topic with ease and precision using this Cyber Security Team Analytics Dashboard With KPI Metrics Icons PDF. This layout presents information on Energy Security Team, Digital Security Center, Security Operations Center. It is also available for immediate download and adjustment. So, changes can be made in the color, design, graphics or any other component to create a unique layout.

Comparative Impact Of Digital Innovation On Different Sectors Background PDF
The following slide highlights the technologies explored in bio pharma after digital revolution. It illustrates N glycan annotation, liquid handling robots, laboratory information system, headspace sampling and metabolics data analysis. Pitch your topic with ease and precision using this Comparative Impact Of Digital Innovation On Different Sectors Background PDF. This layout presents information on Retail, Financial Services Sector, Ecommerce. It is also available for immediate download and adjustment. So, changes can be made in the color, design, graphics or any other component to create a unique layout.

Team Distrust Barrier To Business Effective Communication Infographics PDF
The following slide showcases team distrust that affect workforce communication. Main problems faced by employee are that they dont receive clear instructions, inability to collaborate etc. Pitch your topic with ease and precision using this Team Distrust Barrier To Business Effective Communication Infographics PDF. This layout presents information on Team Distrust Barrier, Business Effective Communication. It is also available for immediate download and adjustment. So, changes can be made in the color, design, graphics or any other component to create a unique layout.

Electronic Banking Dashboard With Bank Transfer And Users Background PDF
This slide showcases dashboard of online banking helps to know the status of funds or finances. It includes other bank transfer, users by OS, browser and country. Pitch your topic with ease and precision using this Electronic Banking Dashboard With Bank Transfer And Users Background PDF. This layout presents information on Electronic Banking Dashboard, Bank Transfer And Users. It is also available for immediate download and adjustment. So, changes can be made in the color, design, graphics or any other component to create a unique layout.

Project Portfolio Management Progress Status Report Ppt Styles Graphics PDF
This slide covers the progress status report of various projects. It illustrates projects in the planning, in progress and completion phases along with their project manager, schedule, and cost. Pitch your topic with ease and precision using this Project Portfolio Management Progress Status Report Ppt Styles Graphics PDF. This layout presents information on Developing, Planning, Financial Workflow Development. It is also available for immediate download and adjustment. So, changes can be made in the color, design, graphics or any other component to create a unique layout.

Project Management Revenue And Customer Progress Report Clipart PDF
This slide exhibits revenue and customer progress status report in the project. It includes revenue, the number of new customers, average revenue per customer, and customer acquisition cost. Pitch your topic with ease and precision using this Project Management Revenue And Customer Progress Report Clipart PDF. This layout presents information on Customer Acquisition Cost, Average Revenue, Per Customer. It is also available for immediate download and adjustment. So, changes can be made in the color, design, graphics or any other component to create a unique layout.

Increment In Social Media Engagement Through Campaign Metrics Professional PDF
This slide covers increment in social media engagement through campaign KPI which include lead break breakdown, online analytics of web traffic and key conversion metrics. Pitch your topic with ease and precision using this Increment In Social Media Engagement Through Campaign Metrics Professional PDF. This layout presents information on Quality, Key Conversion Metrics, Social Media. It is also available for immediate download and adjustment. So, changes can be made in the color, design, graphics or any other component to create a unique layout.
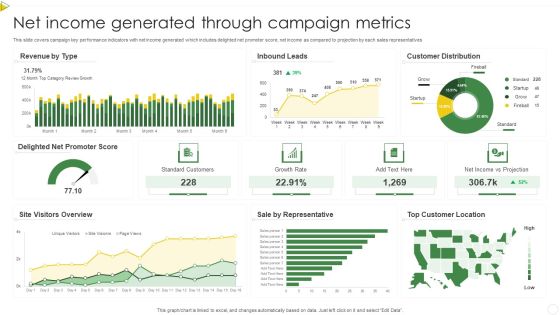
Net Income Generated Through Campaign Metrics Summary PDF
This slide covers campaign key performance indicators with net income generated which includes delighted net promoter score, net income as compared to projection by each sales representatives. Pitch your topic with ease and precision using this Net Income Generated Through Campaign Metrics Summary PDF. This layout presents information on Standard Customers, Growth Rate, Net Income. It is also available for immediate download and adjustment. So, changes can be made in the color, design, graphics or any other component to create a unique layout.
Tracking Channel Campaign Metrics To Measure Web Traffic Sample PDF
This slide covers measuring campaign key performance indicators through tracking channel web traffic which includes total visit, cost per click, engagement rate and total impressions. Pitch your topic with ease and precision using this Tracking Channel Campaign Metrics To Measure Web Traffic Sample PDF. This layout presents information on Revenue By Channel, Website Demographics, Product Sales Trend. It is also available for immediate download and adjustment. So, changes can be made in the color, design, graphics or any other component to create a unique layout.

Web Analysis Summary KPI Dashboard With Conversion Rate Themes PDF
This slide depicts website analytics report dashboard to determine performance. It involves details such as total conversions, number of total users, conversion and engagement rate. Pitch your topic with ease and precision using this Web Analysis Summary KPI Dashboard With Conversion Rate Themes PDF. This layout presents information on Web Analysis Summary, KPI Dashboard, Conversion Rate. It is also available for immediate download and adjustment. So, changes can be made in the color, design, graphics or any other component to create a unique layout.

Web Analysis Summary KPI Dashboard With Visit Trends Professional PDF
This slide covers website analytics report KPI dashboard to track website performance. It involves details such as total number of visits, visit trends by medium, pagers per visit and new vs returning visitors. Pitch your topic with ease and precision using this Web Analysis Summary KPI Dashboard With Visit Trends Professional PDF. This layout presents information on Web Analysis Summary, KPI Dashboard, Visit Trends. It is also available for immediate download and adjustment. So, changes can be made in the color, design, graphics or any other component to create a unique layout.

Web Monthly Usage Analysis Summary Dashboard Clipart PDF
This slide depicts website usage analytics report for tracking performance. It involves number of users, sessions, bounce rate and average session duration. Pitch your topic with ease and precision using this Web Monthly Usage Analysis Summary Dashboard Clipart PDF. This layout presents information on Agency Metrics, Source Rate, Goal. It is also available for immediate download and adjustment. So, changes can be made in the color, design, graphics or any other component to create a unique layout.

Consulting Project Status Report Dashboard With Workspaces Diagrams PDF
The following slide showcases dashboard to provide an insight of active projects, their status and areas that require attention and improvement. Status included are on track, at risk and late Pitch your topic with ease and precision using this Consulting Project Status Report Dashboard With Workspaces Diagrams PDF. This layout presents information on Consulting Project Status Report, Dashboard With Workspaces. It is also available for immediate download and adjustment. So, changes can be made in the color, design, graphics or any other component to create a unique layout.

Consulting Project Status Report With Priority Rules PDF
This slide showcases project status to keep a track of tasks, monitor and mitigate any risk that arises. The following table covers task list, assign, priority, and progress. Pitch your topic with ease and precision using this Consulting Project Status Report With Priority Rules PDF. This layout presents information on Development, Design, Planning. It is also available for immediate download and adjustment. So, changes can be made in the color, design, graphics or any other component to create a unique layout.

Company Top Consulting Projects Progress Status Report Comparison Summary Diagrams PDF
The following slide showcases the status of two projects of a consulting services firm. The slide covers new, opened, in progress, completed and projects kept on hold. Pitch your topic with ease and precision using this Company Top Consulting Projects Progress Status Report Comparison Summary Diagrams PDF. This layout presents information on Company Top Consulting Projects Progress, Status Report Comparison Summary. It is also available for immediate download and adjustment. So, changes can be made in the color, design, graphics or any other component to create a unique layout.
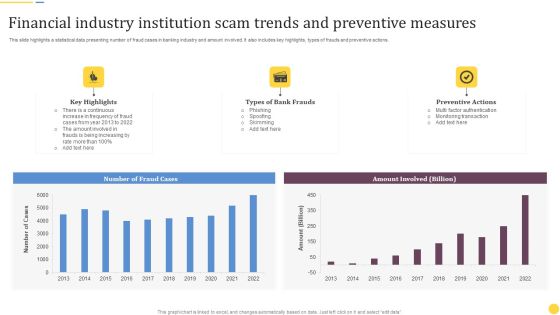
Financial Industry Institution Scam Trends And Preventive Measures Ideas PDF
This slide highlights a statistical data presenting number of fraud cases in banking industry and amount involved. It also includes key highlights, types of frauds and preventive actions. Pitch your topic with ease and precision using this Financial Industry Institution Scam Trends And Preventive Measures Ideas PDF. This layout presents information on Key Highlights, Types Bank Frauds, Preventive Actions. It is also available for immediate download and adjustment. So, changes can be made in the color, design, graphics or any other component to create a unique layout.
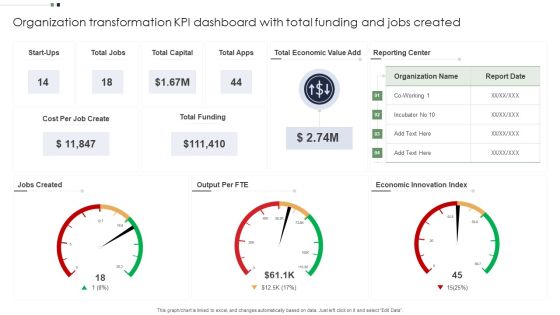
Organization Transformation KPI Dashboard With Total Funding And Jobs Created Information PDF
Pitch your topic with ease and precision using this Organization Transformation KPI Dashboard With Total Funding And Jobs Created Information PDF. This layout presents information on Organization Transformation KPI Dashboard, Economic, Capital. It is also available for immediate download and adjustment. So, changes can be made in the color, design, graphics or any other component to create a unique layout.
Transformation KPI Dashboard With Key Metrics And Status Icons PDF
Pitch your topic with ease and precision using this Transformation KPI Dashboard With Key Metrics And Status Icons PDF. This layout presents information on Measure, System Implemented, Innovation. It is also available for immediate download and adjustment. So, changes can be made in the color, design, graphics or any other component to create a unique layout.
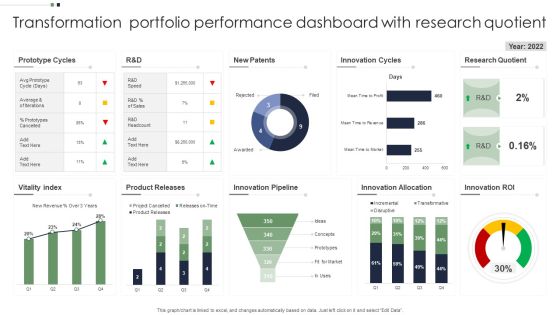
Transformation Portfolio Performance Dashboard With Research Quotient Guidelines PDF
Pitch your topic with ease and precision using this Transformation Portfolio Performance Dashboard With Research Quotient Guidelines PDF. This layout presents information on Transformation Portfolio, Performance Dashboard. It is also available for immediate download and adjustment. So, changes can be made in the color, design, graphics or any other component to create a unique layout.
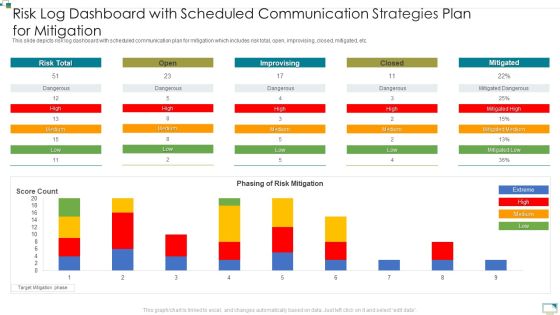
Risk Log Dashboard With Scheduled Communication Strategies Plan For Mitigation Brochure PDF
This slide depicts risk log dashboard with scheduled communication plan for mitigation which includes risk total, open, improvising, closed, mitigated, etc. Pitch your topic with ease and precision using this Risk Log Dashboard With Scheduled Communication Strategies Plan For Mitigation Brochure PDF. This layout presents information on Risk Total, Phasing, Risk Mitigation. It is also available for immediate download and adjustment. So, changes can be made in the color, design, graphics or any other component to create a unique layout.

Dashboard For Tracking Leadership Training And Development Program Progress Topics PDF
This slide illustrates dashboard for tracking leadership development program progress. It also contains information about performing leaders, competency heatmap, executive training, etc. Pitch your topic with ease and precision using this Dashboard For Tracking Leadership Training And Development Program Progress Topics PDF. This layout presents information on People Completed, Number Trainees, Leadership Training. It is also available for immediate download and adjustment. So, changes can be made in the color, design, graphics or any other component to create a unique layout.
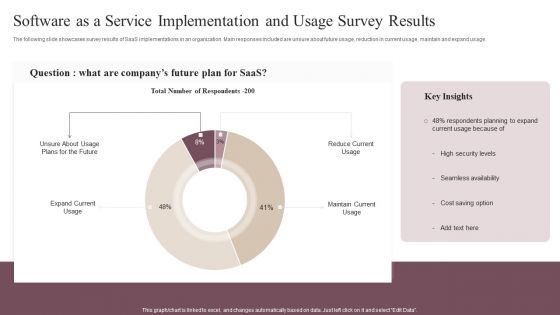
Software As A Service Implementation And Usage Survey Results Clipart PDF
The following slide showcases survey results of SaaS implementations in an organization. Main responses included are unsure about future usage, reduction in current usage, maintain and expand usage. Pitch your topic with ease and precision using this Software As A Service Implementation And Usage Survey Results Clipart PDF. This layout presents information on Reduce Current Usage, Maintain Current Usage, Expand Current Usage . It is also available for immediate download and adjustment. So, changes can be made in the color, design, graphics or any other component to create a unique layout.
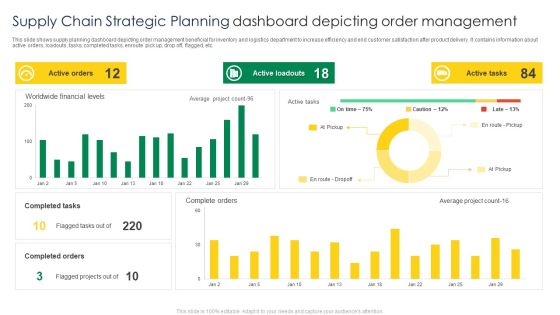
Supply Chain Strategic Planning Dashboard Depicting Order Management Mockup PDF
This slide shows supply planning dashboard depicting order management beneficial for inventory and logistics department to increase efficiency and end customer satisfaction after product delivery. It contains information about active orders, loadouts, tasks, completed tasks, enroute pick up, drop off, flagged, etc. Pitch your topic with ease and precision using this Supply Chain Strategic Planning Dashboard Depicting Order Management Mockup PDF. This layout presents information on Active Orders, Active Loadouts, Active Tasks. It is also available for immediate download and adjustment. So, changes can be made in the color, design, graphics or any other component to create a unique layout.
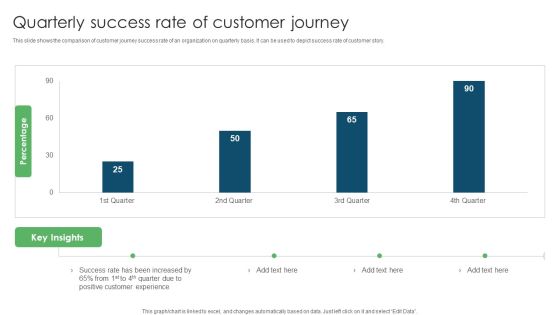
Quarterly Success Rate Of Customer Journey Ppt PowerPoint Presentation Outline Mockup PDF
This slide shows the comparison of customer journey success rate of an organization on quarterly basis. It can be used to depict success rate of customer story. Pitch your topic with ease and precision using this Quarterly Success Rate Of Customer Journey Ppt PowerPoint Presentation Outline Mockup PDF. This layout presents information on Success Rate, Increased Positive, Customer Experience. It is also available for immediate download and adjustment. So, changes can be made in the color, design, graphics or any other component to create a unique layout.

Profitability Comparison Of Business Investments In Securities Ppt PowerPoint Presentation Outline Deck PDF
This slide shows graphical report to analyze market timing and fluctuations in returns to gain maximum from the funds invested in share market. It includes details about most profitable ones, average and least growth. Pitch your topic with ease and precision using this Profitability Comparison Of Business Investments In Securities Ppt PowerPoint Presentation Outline Deck PDF. This layout presents information on Most Profitable, Least Profitable, Least Profitable. It is also available for immediate download and adjustment. So, changes can be made in the color, design, graphics or any other component to create a unique layout.
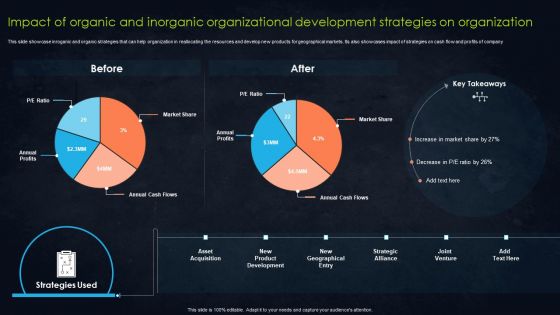
Impact Of Organic And Inorganic Organizational Development Strategies On Organization Demonstration PDF
This slide showcase inroganic and organic strategies that can help organization in reallocating the resources and develop new products for geographical markets. Its also showcases impact of strategies on cash flow and profits of company. Pitch your topic with ease and precision using this Impact Of Organic And Inorganic Organizational Development Strategies On Organization Demonstration PDF. This layout presents information on Annual Profits, Market Share, Strategies. It is also available for immediate download and adjustment. So, changes can be made in the color, design, graphics or any other component to create a unique layout.

Accounting Quick Ratio Assessment Dashboard Ppt PowerPoint Presentation Show Deck PDF
Pitch your topic with ease and precision using this Accounting Quick Ratio Assessment Dashboard Ppt PowerPoint Presentation Show Deck PDF. This layout presents information on Sales Outstanding, Payable Outstanding, Accounts Payable. It is also available for immediate download and adjustment. So, changes can be made in the color, design, graphics or any other component to create a unique layout.
Insurance Claim Procedure Tracking Dashboard Ppt PowerPoint Presentation Show Samples PDF
This slide showcases the insurance claim process tracking dashboard. It includes elements such as claim amount, payout and denied claims and status analysis.Pitch your topic with ease and precision using this Insurance Claim Procedure Tracking Dashboard Ppt PowerPoint Presentation Show Samples PDF. This layout presents information on Amount Comparison, Claim Expense, Assured Amount. It is also available for immediate download and adjustment. So, changes can be made in the color, design, graphics or any other component to create a unique layout.

Commodity Marketing KPI Dashboard For International Business Expansion Formats PDF
This slide signifies the product marketing key performance indicator dashboard for international business expansion. It covers information about sales, target, target achievement, gross profit margin, sales by region, growth and inventory outstanding.Pitch your topic with ease and precision using this Commodity Marketing KPI Dashboard For International Business Expansion Formats PDF. This layout presents information on Target Achievement, Receivale Days, Gross Profit. It is also available for immediate download and adjustment. So, changes can be made in the color, design, graphics or any other component to create a unique layout.

Key Statistics For Commodity Expansion In International Market Pictures PDF
This slide signifies the key stats for business commodity expansion in international market. It covers information about goods like food delivery, hygiene, household cleaning, clothing and health care products.Pitch your topic with ease and precision using this Key Statistics For Commodity Expansion In International Market Pictures PDF. This layout presents information on Product Expansion, Household Cleaning, Items Ranges. It is also available for immediate download and adjustment. So, changes can be made in the color, design, graphics or any other component to create a unique layout.
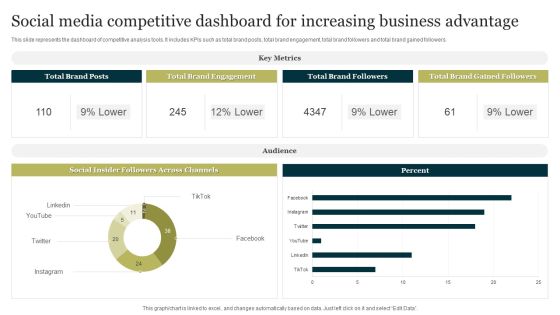
Social Media Competitive Dashboard For Increasing Business Advantage Portrait PDF
This slide represents the dashboard of competitive analysis tools. It includes KPIs such as total brand posts, total brand engagement, total brand followers and total brand gained followers. Pitch your topic with ease and precision using this Social Media Competitive Dashboard For Increasing Business Advantage Portrait PDF. This layout presents information on Social Media Competitive Dashboard, Increasing Business Advantage. It is also available for immediate download and adjustment. So, changes can be made in the color, design, graphics or any other component to create a unique layout.

Customer Relationship Management Lifecycle Analytics Dashboard With Sales Record Brochure PDF
This slide signifies the customer relationship management analytics dashboard. It covers information about sales record by different representative, total products sold, sales by different month, etc.Pitch your topic with ease and precision using this Customer Relationship Management Lifecycle Analytics Dashboard With Sales Record Brochure PDF. This layout presents information on Sales Record, Representative, Total Items. It is also available for immediate download and adjustment. So, changes can be made in the color, design, graphics or any other component to create a unique layout.
Phishing Incident Management Dashboard For Attacks Awareness Training Icons PDF
This slide covers phishing incident management dashboard for effective awareness training. It involves details such as average resolution time, new incidents, incident status, resolved vs unresolved incidents and created vs closed incidents. Pitch your topic with ease and precision using this Phishing Incident Management Dashboard For Attacks Awareness Training Icons PDF. This layout presents information on Phishing Incident Management Dashboard, Attacks Awareness Training. It is also available for immediate download and adjustment. So, changes can be made in the color, design, graphics or any other component to create a unique layout.

Opportunity Analysis Dashboard Indicating Business Performance Information Rules PDF
This slide shows opportunity analysis dashboard indicating market performance which contains opportunity count by size, sales stage, region, revenue and average revenue. Pitch your topic with ease and precision using this Opportunity Analysis Dashboard Indicating Business Performance Information Rules PDF. This layout presents information on Opportunity Count, Revenue, Sales. It is also available for immediate download and adjustment. So, changes can be made in the color, design, graphics or any other component to create a unique layout.

Business Opportunity Dashboard With Customer Metrics Information PDF
This Slide illustrates market opportunity dashboard with customer metrics which contains favorable net promoter score NPS, standard customers, growth rate, cumulative average of customer location, net income vs projection, customer distribution, sales by representatives, etc. Pitch your topic with ease and precision using this Business Opportunity Dashboard With Customer Metrics Information PDF. This layout presents information on Customer Distribution, Growth Rate, Top Customers Locations. It is also available for immediate download and adjustment. So, changes can be made in the color, design, graphics or any other component to create a unique layout.
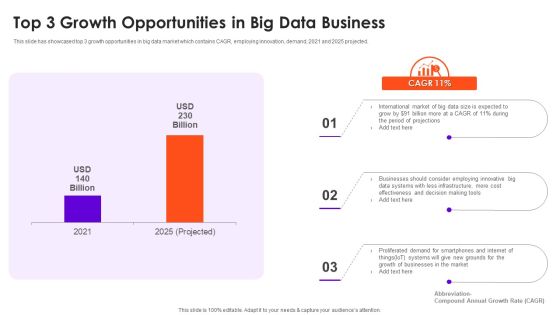
Top 3 Growth Opportunities In Big Data Business Download PDF
This slide has showcased top 3 growth opportunities in big data market which contains CAGR, employing innovation, demand, 2021 and 2025 projected. Pitch your topic with ease and precision using this Top 3 Growth Opportunities In Big Data Business Download PDF. This layout presents information on Cost, Businesses, Data Systems. It is also available for immediate download and adjustment. So, changes can be made in the color, design, graphics or any other component to create a unique layout.

Business Sales Highlights Of Different Manufacturing Companies Demonstration PDF
Pitch your topic with ease and precision using this Business Sales Highlights Of Different Manufacturing Companies Demonstration PDF. This layout presents information on Business Sales Highlights, Different Manufacturing Companies. It is also available for immediate download and adjustment. So, changes can be made in the color, design, graphics or any other component to create a unique layout.

Business Sales Highlights With Pushed Opportunities Infographics PDF
Pitch your topic with ease and precision using this Business Sales Highlights With Pushed Opportunities Infographics PDF. This layout presents information on Business Sales Highlights, Pushed Opportunities. It is also available for immediate download and adjustment. So, changes can be made in the color, design, graphics or any other component to create a unique layout.

Company Business Sales Highlights In Different Years Clipart PDF
Pitch your topic with ease and precision using this Company Business Sales Highlights In Different Years Clipart PDF. This layout presents information on Company Business Sales Highlights, Revenues. It is also available for immediate download and adjustment. So, changes can be made in the color, design, graphics or any other component to create a unique layout.

Company Business Sales Highlights With Target Percentage Background PDF
Pitch your topic with ease and precision using this Company Business Sales Highlights With Target Percentage Background PDF. This layout presents information on Company Business Sales Highlights, Target Percentage. It is also available for immediate download and adjustment. So, changes can be made in the color, design, graphics or any other component to create a unique layout.
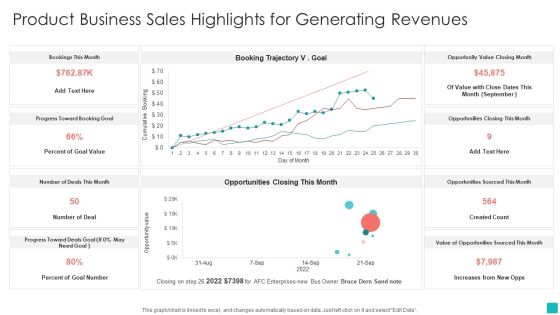
Product Business Sales Highlights For Generating Revenues Demonstration PDF
Pitch your topic with ease and precision using this Product Business Sales Highlights For Generating Revenues Demonstration PDF. This layout presents information on Product Business Sales Highlights, Generating Revenues. It is also available for immediate download and adjustment. So, changes can be made in the color, design, graphics or any other component to create a unique layout.

Electronics Production Annual Market Growth Graphics PDF
This slide contains the information related to the growth of electronic devices manufacturing in the market. Pitch your topic with ease and precision using this Electronics Production Annual Market Growth Graphics PDF. This layout presents information on hnology Advancements, Electronics Market, Demand. It is also available for immediate download and adjustment. So, changes can be made in the color, design, graphics or any other component to create a unique layout.

Glass Production Industry Growth Stats Graphics PDF
This slide displays the glass manufacturing in the market and the growth it shows in the current year. It also showcases the forecasting of the glass manufacturing in the upcoming years 2023 to 2028. Pitch your topic with ease and precision using this Glass Production Industry Growth Stats Graphics PDF. This layout presents information on Global Market Value, Glass Production Industry Growth. It is also available for immediate download and adjustment. So, changes can be made in the color, design, graphics or any other component to create a unique layout.

Market Growth Outlook Of Aerospace Product Manufacturing Sample PDF
This slide consists of the three year market outlook on the manufacturing growth of aerospace products. This could be due to increased demand for air travel technological advances, low interest rates, etc. Pitch your topic with ease and precision using this Market Growth Outlook Of Aerospace Product Manufacturing Sample PDF. This layout presents information on Manufacturing, Products, Demand, Commercial. It is also available for immediate download and adjustment. So, changes can be made in the color, design, graphics or any other component to create a unique layout.

Oil Production And Manufacturing Annual Growth By Region Graphics PDF
This slide covers the information on the region wise. annual growth of crude oil manufacturing. It also includes 4 regions Europe, Middle East, Latin America and Asia. Pitch your topic with ease and precision using this Oil Production And Manufacturing Annual Growth By Region Graphics PDF. This layout presents information on Average Production, Manufacturing Annual Growth. It is also available for immediate download and adjustment. So, changes can be made in the color, design, graphics or any other component to create a unique layout.
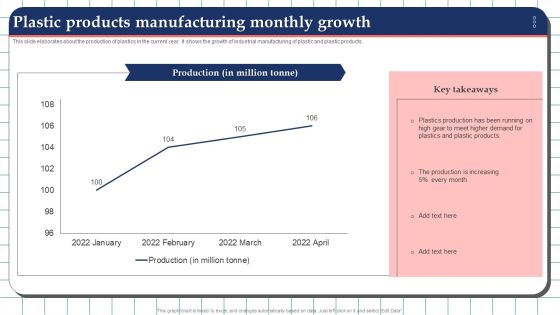
Plastic Products Manufacturing Monthly Growth Guidelines PDF
This slide elaborates about the production of plastics in the current year. It shows the growth of industrial manufacturing of plastic and plastic products. Pitch your topic with ease and precision using this Plastic Products Manufacturing Monthly Growth Guidelines PDF. This layout presents information on Production, Demand, Manufacturing Monthly Growth. It is also available for immediate download and adjustment. So, changes can be made in the color, design, graphics or any other component to create a unique layout.

Production Growth Of Green Building Materials By Product Formats PDF
This slide elaborates the manufacturing growth of green building materials over the last years with the product wise divisions. The product divisions include structural, interior, exterior, etc. Pitch your topic with ease and precision using this Production Growth Of Green Building Materials By Product Formats PDF. This layout presents information on Manufacturing, Materials, Global Crisis. It is also available for immediate download and adjustment. So, changes can be made in the color, design, graphics or any other component to create a unique layout.

Quarterly Beverages Industry Production Growth By Region Designs PDF
This slide contains the information regarding the quarterly manufacturing growth of beverages in the market. Pitch your topic with ease and precision using this Quarterly Beverages Industry Production Growth By Region Designs PDF. This layout presents information on Beverages Manufacturing, Quarterly Beverages Industry, Production Growth. It is also available for immediate download and adjustment. So, changes can be made in the color, design, graphics or any other component to create a unique layout.
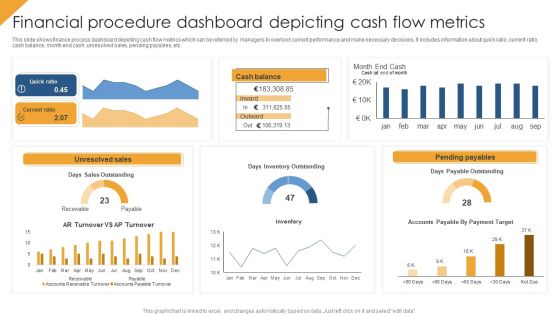
Financial Procedure Dashboard Depicting Cash Flow Metrics Structure PDF
This slide shows finance process dashboard depicting cash flow metrics which can be referred by managers to overlook current performance and make necessary decisions. It includes information about quick ratio, current ratio, cash balance, month end cash, unresolved sales, pending payables, etc. Pitch your topic with ease and precision using this Financial Procedure Dashboard Depicting Cash Flow Metrics Structure PDF. This layout presents information on Quick Ratio, Unresolved Sales, Pending Payables. It is also available for immediate download and adjustment. So, changes can be made in the color, design, graphics or any other component to create a unique layout.
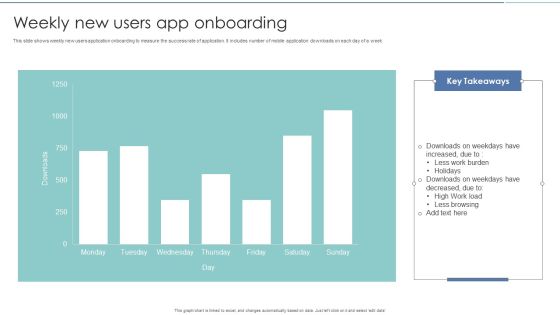
Weekly New Users App Onboarding Diagrams PDF
This slide shows weekly new users application onboarding to measure the success rate of application. It includes number of mobile application downloads on each day of a week. Pitch your topic with ease and precision using this Weekly New Users App Onboarding Diagrams PDF. This layout presents information on Weekly New Users, App Onboarding. It is also available for immediate download and adjustment. So, changes can be made in the color, design, graphics or any other component to create a unique layout.

Market Insights Of Data Center Architecture Management Elements PDF
This slide covers statistical information of data center infrastructure solutions market. It involves details such as CAGR growth, growth rate year over year and growth generated by APAC. Pitch your topic with ease and precision using this Market Insights Of Data Center Architecture Management Elements PDF. This layout presents information on Growth Rate, Market, Investors. It is also available for immediate download and adjustment. So, changes can be made in the color, design, graphics or any other component to create a unique layout.

Company Financials Performance Comparison Of Company Financials Formats PDF
This slide shows the comparison of revenue generated by an organization on company basis in two financial years. Pitch your topic with ease and precision using this Company Financials Performance Comparison Of Company Financials Formats PDF. This layout presents information on Manufacturing Cost, Introduction Customer, Loyalty Programs. It is also available for immediate download and adjustment. So, changes can be made in the color, design, graphics or any other component to create a unique layout.
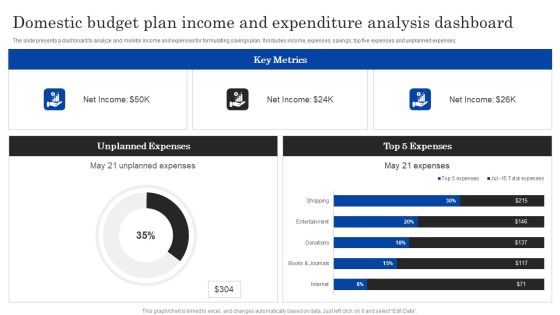
Domestic Budget Plan Income And Expenditure Analysis Dashboard Ppt PowerPoint Presentation Layouts Clipart Images PDF
The slide presents a dashboard to analyze and monitor income and expenses for formulating savings plan. It includes income, expenses, savings, top five expenses and unplanned expenses.Pitch your topic with ease and precision using this Domestic Budget Plan Income And Expenditure Analysis Dashboard Ppt PowerPoint Presentation Layouts Clipart Images PDF. This layout presents information on Unplanned Expenses, Expenses, Key Metrics. It is also available for immediate download and adjustment. So, changes can be made in the color, design, graphics or any other component to create a unique layout.
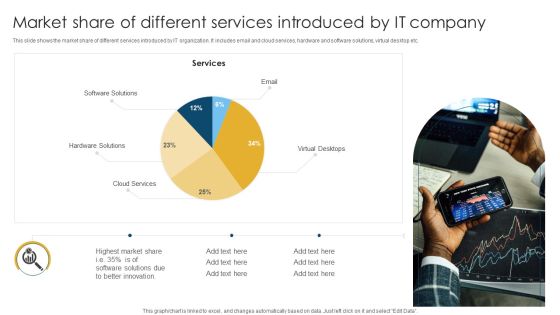
Market Share Of Different Services Introduced By IT Company Download PDF
This slide shows the market share of different services introduced by IT organization. It includes email and cloud services, hardware and software solutions, virtual desktop etc. Pitch your topic with ease and precision using this Market Share Of Different Services Introduced By IT Company Download PDF. This layout presents information on Software Solutions, Hardware Solutions, Highest Market. It is also available for immediate download and adjustment. So, changes can be made in the color, design, graphics or any other component to create a unique layout.

Bio Food Producers And Marketplace Growth Size Ppt Outline Layouts PDF
This slide covers analysis based on size of organic farmland and organic market. It also includes elements such as increase in organic producers, organic farmland growth in top countries along with increase in market growth and producers count. Pitch your topic with ease and precision using this Bio Food Producers And Marketplace Growth Size Ppt Outline Layouts PDF. This layout presents information on Organic Farmland, Organic Producers, Organic Food Market. It is also available for immediate download and adjustment. So, changes can be made in the color, design, graphics or any other component to create a unique layout.


 Continue with Email
 Sign up for an account
 Home
Home