AI PPT Maker
Templates
PPT Bundles
Design Services
Business PPTs
Business Plan
Management
Strategy
Introduction PPT
Roadmap
Self Introduction
Timelines
Process
Marketing
Agenda
Technology
Medical
Startup Business Plan
Cyber Security
Dashboards
SWOT
Proposals
Education
Pitch Deck
Digital Marketing
KPIs
Project Management
Product Management
Artificial Intelligence
Target Market
Communication
Supply Chain
Google Slides
Research Services
 One Pagers
All Categories
-
Home
- Customer Favorites
- Bar Graph
Bar Graph

Customer Relationship Management Software Dashboard For Customer Support System Demonstration PDF
This slide shows the dashboard to be used by the customer support system of the organisation. It represents the number of unresolved issues, average response time and level of customer satisfaction.Pitch your topic with ease and precision using this Customer Relationship Management Software Dashboard For Customer Support System Demonstration PDF This layout presents information on Customer Support, Vendor Management, Loyalty Programs It is also available for immediate download and adjustment. So, changes can be made in the color, design, graphics or any other component to create a unique layout.

Employee Key Performance Indicators With Scores Themes PDF
The following slide highlights the staff key performance Indicators with scores illustrating key headings which includes staff performance , average scores and team result areas Pitch your topic with ease and precision using this Employee Key Performance Indicators With Scores Themes PDF This layout presents information on Staff Performance, Average Scores, Team Result It is also available for immediate download and adjustment. So, changes can be made in the color, design, graphics or any other component to create a unique layout.
Patient Healthcare Online Transformation Dashboard Ppt PowerPoint Presentation Icon Example File PDF
This slide displays the dashboard depicting the results of patients after the digital transformation. It includes the daily activity of the patients on the app, appointments, water balance, etc. Pitch your topic with ease and precision using this Patient Healthcare Online Transformation Dashboard Ppt PowerPoint Presentation Icon Example File PDF. This layout presents information on General Health, Water Balance, Transformation Dashboard. It is also available for immediate download and adjustment. So, changes can be made in the color, design, graphics or any other component to create a unique layout.
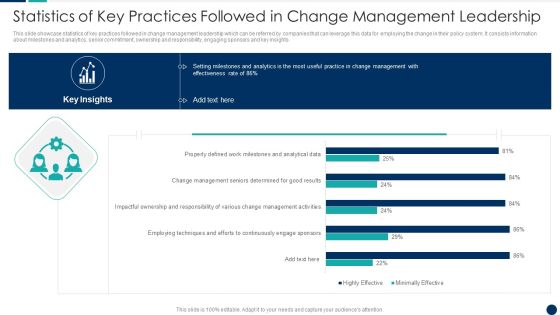
Statistics Of Key Practices Followed In Change Management Leadership Ideas PDF
This slide showcase statistics of key practices followed in change management leadership which can be referred by companies that can leverage this data for employing the change in their policy system. It consists information about milestones and analytics, senior commitment, ownership and responsibility, engaging sponsors and key insights.Pitch your topic with ease and precision using this Statistics Of Key Practices Followed In Change Management Leadership Ideas PDF This layout presents information on Employing Techniques, Efforts Continuously, Engage Sponsors It is also available for immediate download and adjustment. So, changes can be made in the color, design, graphics or any other component to create a unique layout.
Portfolio Tracking Dashboard For Management Procedure Structure PDF
This slide covers portfolio performance tracking KPI dashboard for increasing effectiveness in investment management process. It involves details such as investment, total earning, net profit and monthly portfolio performance.Pitch your topic with ease and precision using this Portfolio Tracking Dashboard For Management Procedure Structure PDF This layout presents information on Investment, Total Earning, Portfolio Performance It is also available for immediate download and adjustment. So, changes can be made in the color, design, graphics or any other component to create a unique layout.
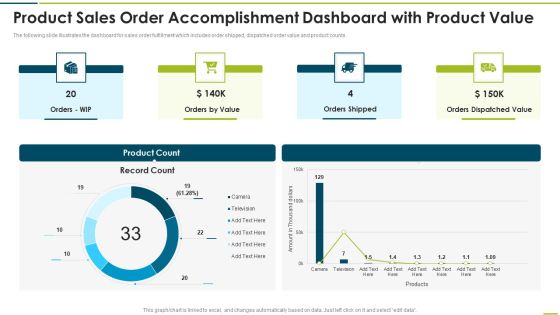
Product Sales Order Accomplishment Dashboard With Product Value Themes PDF
The following slide illustrates the dashboard for sales order fulfillment which includes order shipped, dispatched order value and product counts.Pitch your topic with ease and precision using this Product Sales Order Accomplishment Dashboard With Product Value Themes PDF This layout presents information on Orders Shipped, Dispatched Value, Orders Value It is also available for immediate download and adjustment. So, changes can be made in the color, design, graphics or any other component to create a unique layout.
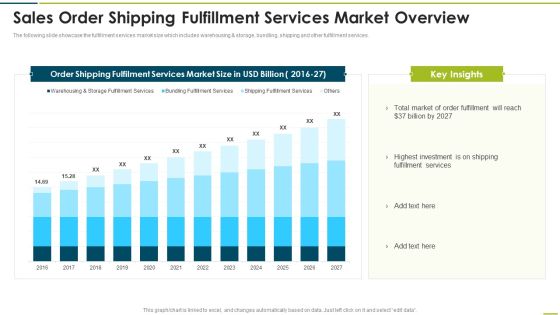
Sales Order Shipping Fulfillment Services Market Overview Diagrams PDF
The following slide showcase the fulfillment services market size which includes warehousing and storage, bundling, shipping and other fulfillment services.Pitch your topic with ease and precision using this Sales Order Shipping Fulfillment Services Market Overview Diagrams PDF This layout presents information on Order Shipping, Highest Investment, Fulfilment Services It is also available for immediate download and adjustment. So, changes can be made in the color, design, graphics or any other component to create a unique layout.

Debt Recovery Dashboard With Cash Flow Metrics Summary PDF
This slide showcase debt collection dashboard with cash flow metrics which contains 12 month collection totals by client, non payers, client with most debtors, paid vs. owed debtor and income by agent. It can assist businesses in reviewing the money collected and lent to various clients.Pitch your topic with ease and precision using this Debt Recovery Dashboard With Cash Flow Metrics Summary PDF This layout presents information on Debt Recovery, Dashboard Cash, Flow Metrics It is also available for immediate download and adjustment. So, changes can be made in the color, design, graphics or any other component to create a unique layout.
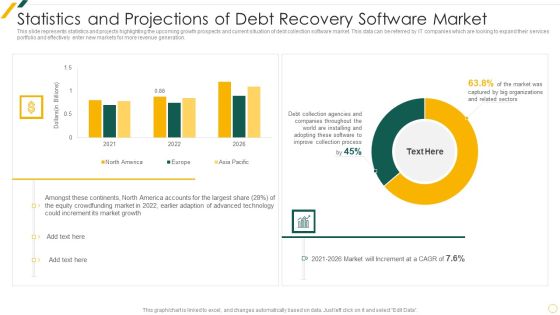
Statistics And Projections Of Debt Recovery Software Market Guidelines PDF
This slide represents statistics and projects highlighting the upcoming growth prospects and current situation of debt collection software market. This data can be referred by IT companies which are looking to expand their services portfolio and effectively enter new markets for more revenue generation.Pitch your topic with ease and precision using this Statistics And Projections Of Debt Recovery Software Market Guidelines PDF This layout presents information on Resuming Aggregable, Agreeable Projected, Allocating Agent It is also available for immediate download and adjustment. So, changes can be made in the color, design, graphics or any other component to create a unique layout.

Asset Allocation Strategy With Investment Impact Sample PDF
This slide shows asset allocation investment strategy with impact analysis. It provides information such as conservative, balanced, growth, aggressive growth, annual return, etc.Pitch your topic with ease and precision using this Asset Allocation Strategy With Investment Impact Sample PDF This layout presents information on Conservative Strategy, Growth Strategy, Aggressive Growth It is also available for immediate download and adjustment. So, changes can be made in the color, design, graphics or any other component to create a unique layout.

Skill Evaluation Dashboard With Turnover Rate Ideas PDF
Mentioned slide delineates talent assessment dashboard which will assist companies to frame efficient recruitment strategy. This dashboard provides detail information about hiring stats, talent turnover rate, talent rating, fired talents etc.Pitch your topic with ease and precision using this Skill Evaluation Dashboard With Turnover Rate Ideas PDF This layout presents information on Talent Management, Talent Satisfaction, Talent Rating It is also available for immediate download and adjustment. So, changes can be made in the color, design, graphics or any other component to create a unique layout.
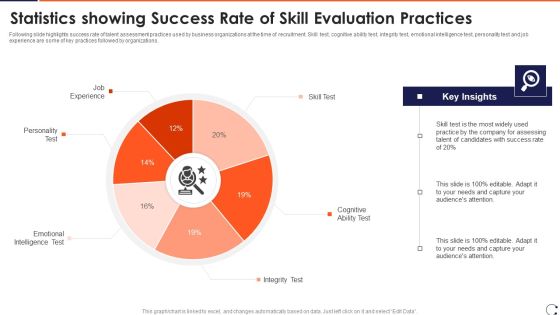
Statistics Showing Success Rate Of Skill Evaluation Practices Topics PDF
Following slide highlights success rate of talent assessment practices used by business organizations at the time of recruitment. Skill test, cognitive ability test, integrity test, emotional intelligence test, personality test and job experience are some of key practices followed by organizations.Pitch your topic with ease and precision using this Statistics Showing Success Rate Of Skill Evaluation Practices Topics PDF This layout presents information on Emotional Intelligence, Test Cognitive, Personality Test It is also available for immediate download and adjustment. So, changes can be made in the color, design, graphics or any other component to create a unique layout.

7 Step Process For Team Building Activities Event Planning Background PDF
Pitch your topic with ease and precision using this 7 Step Process For Team Building Activities Event Planning Background PDF This layout presents information on Determine Timeline, Determine Event, Create Budget It is also available for immediate download and adjustment. So, changes can be made in the color, design, graphics or any other component to create a unique layout.
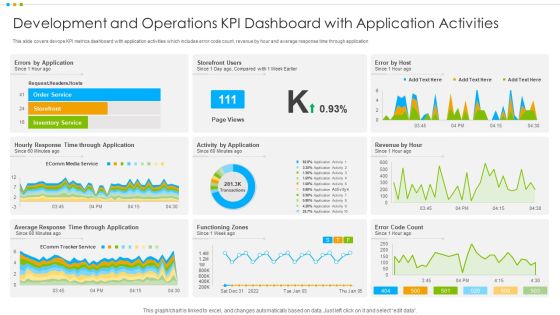
Development And Operations KPI Dashboard With Application Activities Information PDF
This slide covers devops KPI metrics dashboard with application activities which includes error code count, revenue by hour and average response time through application.Pitch your topic with ease and precision using this Development And Operations KPI Dashboard With Application Activities Information PDF This layout presents information on Development Operations Kpi Dashboard, Application Activities It is also available for immediate download and adjustment. So, changes can be made in the color, design, graphics or any other component to create a unique layout.
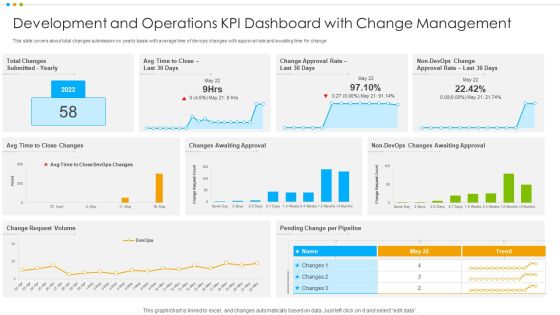
Development And Operations KPI Dashboard With Change Management Elements PDF
This slide covers about total changes submission on yearly basis with average time of devops changes with approval rate and awaiting time for change.Pitch your topic with ease and precision using this Development And Operations KPI Dashboard With Change Management Elements PDF This layout presents information on Awaiting Approval, Change Approval, Total Changes It is also available for immediate download and adjustment. So, changes can be made in the color, design, graphics or any other component to create a unique layout.
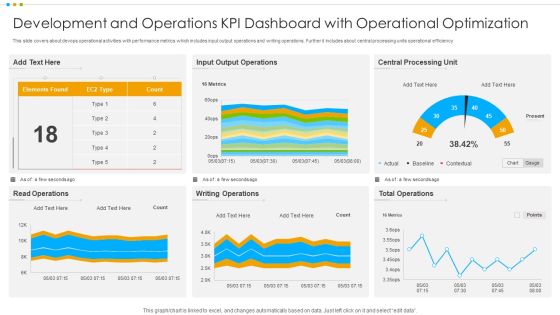
Development And Operations KPI Dashboard With Operational Optimization Pictures PDF
This slide covers about devops operational activities with performance metrics which includes input output operations and writing operations. Further it includes about central processing units operational efficiency.Pitch your topic with ease and precision using this Development And Operations KPI Dashboard With Operational Optimization Pictures PDF This layout presents information on Output Operations, Central Processing, Total Operations It is also available for immediate download and adjustment. So, changes can be made in the color, design, graphics or any other component to create a unique layout.

Development And Operations KPI Dashboard With Traffic Volume Professional PDF
This slide covers about backend errors, anomalies, traffic volume with production errors on hourly basis due as expected.Pitch your topic with ease and precision using this Development And Operations KPI Dashboard With Traffic Volume Professional PDF This layout presents information on Anomalies, Traffics Volume, Production Errors It is also available for immediate download and adjustment. So, changes can be made in the color, design, graphics or any other component to create a unique layout.

Dashboard For Hiring Data Analysis By Recruitment Team Formats PDF
The slide highlights the dashboard for hiring data analysis by recruitment team depicting of open job positions, jobs approved, candidates in recruitment pipeline and job assigned to team.Pitch your topic with ease and precision using this Dashboard For Hiring Data Analysis By Recruitment Team Formats PDF This layout presents information on Candidates Recruitment, Marketing Communication, Approved It is also available for immediate download and adjustment. So, changes can be made in the color, design, graphics or any other component to create a unique layout.
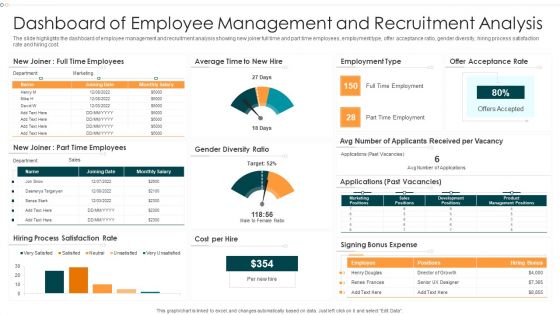
Dashboard Of Employee Management And Recruitment Analysis Infographics PDF
The slide highlights the dashboard of employee management and recruitment analysis showing new joiner full time and part time employees, employment type, offer acceptance ratio, gender diversity, hiring process satisfaction rate and hiring cost.Pitch your topic with ease and precision using this Dashboard Of Employee Management And Recruitment Analysis Infographics PDF This layout presents information on Dashboard Employee, Management, Recruitment Analysis It is also available for immediate download and adjustment. So, changes can be made in the color, design, graphics or any other component to create a unique layout.

Dashboard Of Recruitment Funnel And Key Metrics Information PDF
The slide highlights the dashboard of recruitment funnel and key metrics illustrating recruitment source, department, job level, key metrics, recruitment funnel, number of days per stage, gender ratio and age of applicants.Pitch your topic with ease and precision using this Dashboard Of Recruitment Funnel And Key Metrics Information PDF This layout presents information on Recruitment Funnel, Recruitment Dashboard, Recruitment Cost It is also available for immediate download and adjustment. So, changes can be made in the color, design, graphics or any other component to create a unique layout.
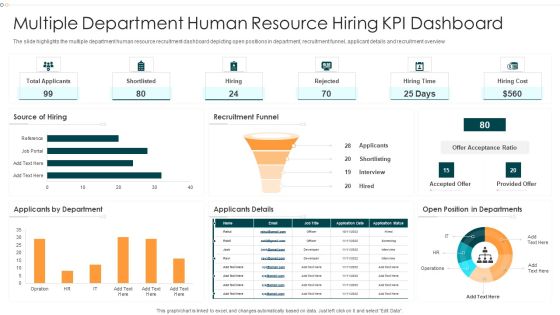
Multiple Department Human Resource Hiring KPI Dashboard Professional PDF
The slide highlights the multiple department human resource recruitment dashboard depicting open positions in department, recruitment funnel, applicant details and recruitment overview.Pitch your topic with ease and precision using this Multiple Department Human Resource Hiring KPI Dashboard Professional PDF This layout presents information on Recruitment Funnel, Position Departments, Source Of Hiring It is also available for immediate download and adjustment. So, changes can be made in the color, design, graphics or any other component to create a unique layout.

Talent Acquisition And Multinational Hiring KPI Dashboard Mockup PDF
The slide highlights the talent acquisition and multinational recruitment dash board depicting number of positions, open positions by location, candidate pipeline, interview and compliance.Pitch your topic with ease and precision using this Talent Acquisition And Multinational Hiring KPI Dashboard Mockup PDF This layout presents information on Candidate Ranking, Positions, Contingent It is also available for immediate download and adjustment. So, changes can be made in the color, design, graphics or any other component to create a unique layout.

Online Marketing Analytics Performance Report Microsoft PDF
This slide shows the digital marketing analytics performance report such as social media, blog and public relation performance with website health.Pitch your topic with ease and precision using this Online Marketing Analytics Performance Report Microsoft PDF This layout presents information on Blog Performance, Media Performance, Effective Engagement It is also available for immediate download and adjustment. So, changes can be made in the color, design, graphics or any other component to create a unique layout.

Online Marketing Report To Analyze Website Traffic Trend Introduction PDF
This slide shows digital marketing report which includes total sessions, bounce rate, goal completions, goal conversion rate, top channels, etc. that helps business to analyze audience traffic on website for making better decisions.Pitch your topic with ease and precision using this Online Marketing Report To Analyze Website Traffic Trend Introduction PDF This layout presents information on Goal Completions, Goal Conversion, Total Sessions It is also available for immediate download and adjustment. So, changes can be made in the color, design, graphics or any other component to create a unique layout.
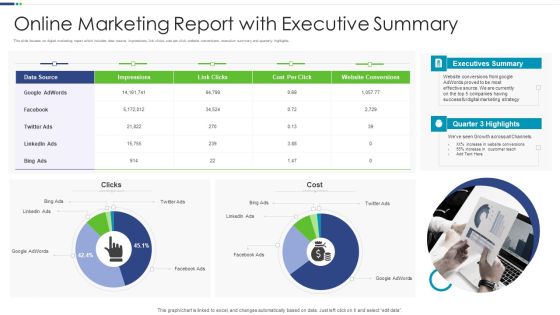
Online Marketing Report With Executive Summary Designs PDF
This slide focuses on digital marketing report which includes data source, impressions, link clicks, cost per click, website conversions, executive summary and quarterly highlights.Pitch your topic with ease and precision using this Online Marketing Report With Executive Summary Designs PDF This layout presents information on Executives Summary, Digital Marketing, Conversions It is also available for immediate download and adjustment. So, changes can be made in the color, design, graphics or any other component to create a unique layout.
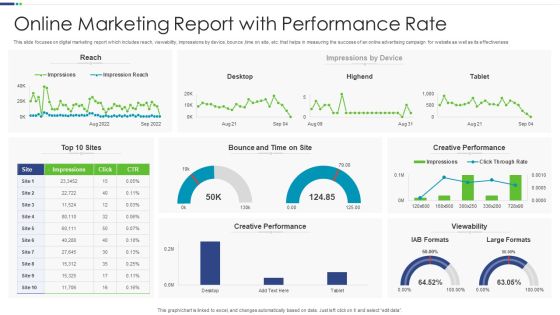
Online Marketing Report With Performance Rate Microsoft PDF
This slide focuses on digital marketing report which includes reach, viewability, impressions by device, bounce ,time on site, etc. that helps in measuring the success of an online advertising campaign for website as well as its effectiveness.Pitch your topic with ease and precision using this Online Marketing Report With Performance Rate Microsoft PDF This layout presents information on Creative Performance, Viewability, Creative Performance It is also available for immediate download and adjustment. So, changes can be made in the color, design, graphics or any other component to create a unique layout.
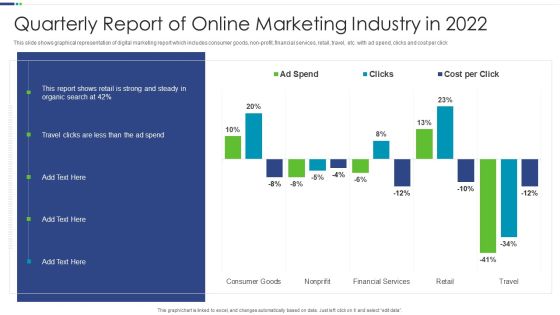
Quarterly Report Of Online Marketing Industry In 2022 Professional PDF
This slide shows graphical representation of digital marketing report which includes consumer goods, non-profit, financial services, retail, travel, etc. with ad spend, clicks and cost per click.Pitch your topic with ease and precision using this Quarterly Report Of Online Marketing Industry In 2022 Professional PDF This layout presents information on Quarterly Report, Online Marketing, Industry It is also available for immediate download and adjustment. So, changes can be made in the color, design, graphics or any other component to create a unique layout.

Data Center Kpis For Power Port Capacity Management Ppt File Slide Download PDF
Pitch your topic with ease and precision using this Data Center Kpis For Power Port Capacity Management Ppt File Slide Download PDF. This layout presents information on Capacity Management, Data Center, Connected Power Supplies. It is also available for immediate download and adjustment. So, changes can be made in the color, design, graphics or any other component to create a unique layout.

Data Center Kpis To Monitor And Optimize Performance Ppt Inspiration Examples PDF
Pitch your topic with ease and precision using this Data Center Kpis To Monitor And Optimize Performance Ppt Inspiration Examples PDF. This layout presents information on Data Center, Optimize Performance, Network And Data. It is also available for immediate download and adjustment. So, changes can be made in the color, design, graphics or any other component to create a unique layout.

Data Center Kpis With Rack Units Fragmentation Ppt Layouts PDF
Pitch your topic with ease and precision using this Data Center Kpis With Rack Units Fragmentation Ppt Layouts PDF. This layout presents information on Data Center, Rack Units Fragmentation, Cabinet Utilization. It is also available for immediate download and adjustment. So, changes can be made in the color, design, graphics or any other component to create a unique layout.
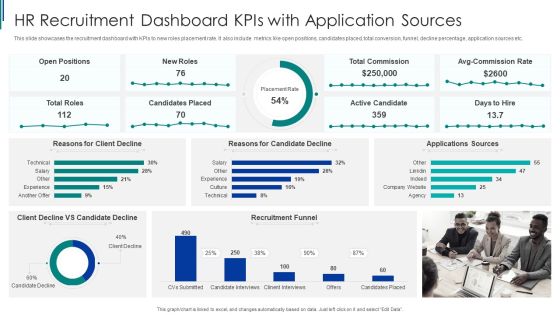
HR Recruitment Dashboard Kpis With Application Sources Ppt Pictures Styles PDF
This slide showcases the recruitment dashboard with KPIs to new roles placement rate. It also include metrics like open positions, candidates placed, total conversion, funnel, decline percentage, application sources etc. Pitch your topic with ease and precision using this HR Recruitment Dashboard Kpis With Application Sources Ppt Pictures Styles PDF. This layout presents information on Recruitment Funnel, HR Recruitment, Dashboard Kpis. It is also available for immediate download and adjustment. So, changes can be made in the color, design, graphics or any other component to create a unique layout.

HR Recruitment Dashboard Kpis With Hires Per Month Ppt Slides Portfolio PDF
This slide showcases the recruitment dashboard of KPIs to know hiring from different sources. It include metrics like hires by department, per month, candidate feedback, offer acceptance rate, interview activity. Pitch your topic with ease and precision using this HR Recruitment Dashboard Kpis With Hires Per Month Ppt Slides Portfolio PDF. This layout presents information on HR Recruitment, Dashboard Kpis, Business Development. It is also available for immediate download and adjustment. So, changes can be made in the color, design, graphics or any other component to create a unique layout.
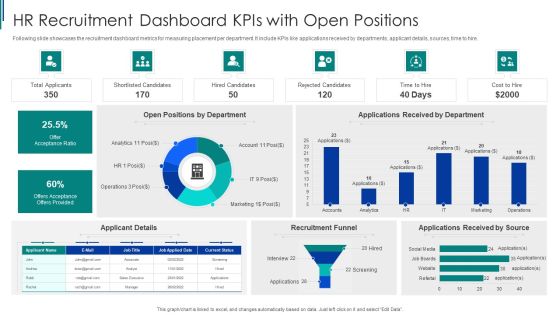
HR Recruitment Dashboard Kpis With Open Positions Ppt Model Good PDF
Following slide showcases the recruitment dashboard metrics for measuring placement per department. It include KPIs like applications received by departments, applicant details, sources, time to hire. Pitch your topic with ease and precision using this HR Recruitment Dashboard Kpis With Open Positions Ppt Model Good PDF. This layout presents information on Offer Acceptance Ratio, Recruitment Funnel, Applicant Details. It is also available for immediate download and adjustment. So, changes can be made in the color, design, graphics or any other component to create a unique layout.
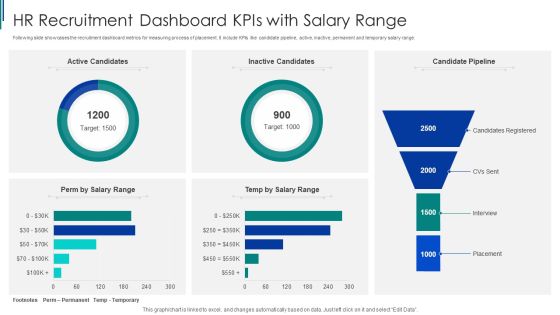
HR Recruitment Dashboard Kpis With Salary Range Ppt Inspiration Rules PDF
Following slide showcases the recruitment dashboard metrics for measuring process of placement. It include KPIs like candidate pipeline, active, inactive, permanent and temporary salary range. Pitch your topic with ease and precision using this HR Recruitment Dashboard Kpis With Salary Range Ppt Inspiration Rules PDF. This layout presents information on HR Recruitment, Dashboard Kpis, Salary Range. It is also available for immediate download and adjustment. So, changes can be made in the color, design, graphics or any other component to create a unique layout.

Cloud Security KPI Dashboard With Key Statistics Ppt Icon Examples PDF
Pitch your topic with ease and precision using this Cloud Security KPI Dashboard With Key Statistics Ppt Icon Examples PDF. This layout presents information on Compliance Trend, Risk Status, Risk Severity. It is also available for immediate download and adjustment. So, changes can be made in the color, design, graphics or any other component to create a unique layout.

Dashboard Icon Showing Security Performance Of A Company Ppt Slides Layout Ideas PDF
Pitch your topic with ease and precision using this Dashboard Icon Showing Security Performance Of A Company Ppt Slides Layout Ideas PDF. This layout presents information on Dashboard Icon, Security Performance. It is also available for immediate download and adjustment. So, changes can be made in the color, design, graphics or any other component to create a unique layout.
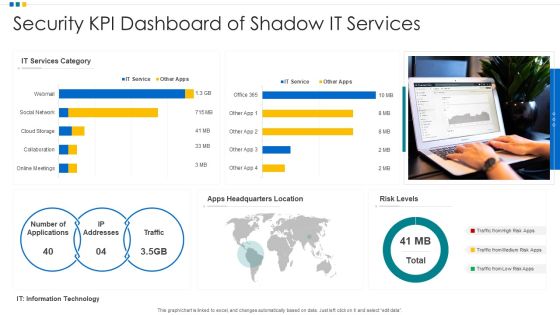
Security KPI Dashboard Of Shadow It Services Ppt Ideas Deck PDF
Pitch your topic with ease and precision using this Security KPI Dashboard Of Shadow It Services Ppt Ideas Deck PDF. This layout presents information on Security KPI Dashboard, Shadow It Services, Risk Levels. It is also available for immediate download and adjustment. So, changes can be made in the color, design, graphics or any other component to create a unique layout.
Social Media Tracking Dashboard With Channel Views Statistics Ppt Icon Gallery PDF
Pitch your topic with ease and precision using this Social Media Tracking Dashboard With Channel Views Statistics Ppt Icon Gallery PDF. This layout presents information on Social Media, Tracking Dashboard, Channel Views Statistics. It is also available for immediate download and adjustment. So, changes can be made in the color, design, graphics or any other component to create a unique layout.
Social Media Tracking Dashboard With Mentions And Unique Authors Ppt Outline Ideas PDF
Pitch your topic with ease and precision using this Social Media Tracking Dashboard With Mentions And Unique Authors Ppt Outline Ideas PDF. This layout presents information on Social Media, Unique Authors, Tracking Dashboard. It is also available for immediate download and adjustment. So, changes can be made in the color, design, graphics or any other component to create a unique layout.
Social Media Tracking Dashboard With User Engagement Ppt Summary Visuals PDF
Pitch your topic with ease and precision using this Social Media Tracking Dashboard With User Engagement Ppt Summary Visuals PDF. This layout presents information on Social Media, Tracking Dashboard. It is also available for immediate download and adjustment. So, changes can be made in the color, design, graphics or any other component to create a unique layout.
Social Media Tracking Dashboard With Website Traffic Ppt Model Demonstration PDF
Pitch your topic with ease and precision using this Social Media Tracking Dashboard With Website Traffic Ppt Model Demonstration PDF. This layout presents information on Social Media, Tracking Dashboard, Website Traffic. It is also available for immediate download and adjustment. So, changes can be made in the color, design, graphics or any other component to create a unique layout.

Sales Team Monthly Report With Variance Background PDF
The following slide highlights the sales team monthly report with variance illustrating key headings which includes key headings month, sales, target, variance, percentage variance and key takeaways. Pitch your topic with ease and precision using this Sales Team Monthly Report With Variance Background PDF. This layout presents information on Sales Team Monthly Report With Variance Background PDF. It is also available for immediate download and adjustment. So, changes can be made in the color, design, graphics or any other component to create a unique layout.

Income Bridge Highlighting Three Year Trends Ppt PowerPoint Presentation File Background Image PDF
This slide showcase revenue bridge. It has major revenue sources like retail, beauty wholesale and licensing. Pitch your topic with ease and precision using this Income Bridge Highlighting Three Year Trends Ppt PowerPoint Presentation File Background Image PDF. This layout presents information on Revenue Growth, Ex Beauty Wholesale. It is also available for immediate download and adjustment. So, changes can be made in the color, design, graphics or any other component to create a unique layout.
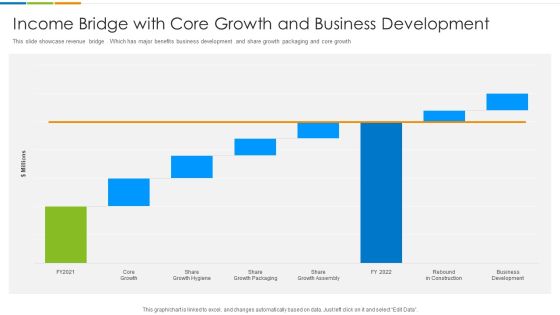
Income Bridge With Core Growth And Business Development Ppt PowerPoint Presentation Gallery Topics PDF
This slide showcase revenue bridge . Which has major benefits business development and share growth packaging and core growth. Pitch your topic with ease and precision using this Income Bridge With Core Growth And Business Development Ppt PowerPoint Presentation Gallery Topics PDF. This layout presents information on Core Growth, Share Growth, Rebound Construction. It is also available for immediate download and adjustment. So, changes can be made in the color, design, graphics or any other component to create a unique layout.

Financial Performance Introduction Of Supply Chain Management Organization Infographics PDF
This slide showcases introduction to statistics that can help supply chain management organization to evaluate the financial performance. Its key components are revenue, net income and revenue sources.Pitch your topic with ease and precision using this Financial Performance Introduction Of Supply Chain Management Organization Infographics PDF This layout presents information on Revenue Sources, Revenue Increased, Income Increased It is also available for immediate download and adjustment. So, changes can be made in the color, design, graphics or any other component to create a unique layout.
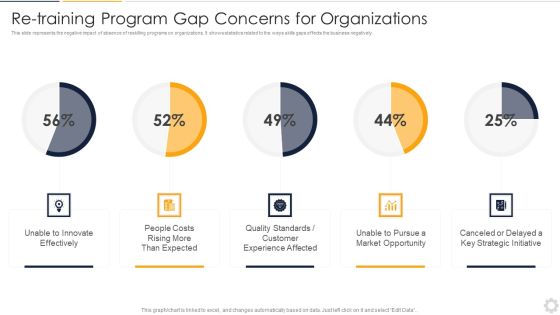
Re Training Program Gap Concerns For Organizations Themes PDF
This slide represents the negative impact of absence of reskilling programs on organizations. It shows statistics related to the ways skills gaps effects the business negatively. Pitch your topic with ease and precision using this Re Training Program Gap Concerns For Organizations Themes PDF. This layout presents information on People Costs, Market Opportunity, Strategic Initiative. It is also available for immediate download and adjustment. So, changes can be made in the color, design, graphics or any other component to create a unique layout.

Capacity Allotment Management For Program Backlog Management Graphics PDF
This slide illustrates capacity allocation which can be helpful for agile teams for reducing program backlogs. It contains information about team context, stakeholders, team backlog, user stories, refactors, maintenance, next program increment, etc. Pitch your topic with ease and precision using this Capacity Allotment Management For Program Backlog Management Graphics PDF. This layout presents information on Increment Commitment Planning, Designs, Technological. It is also available for immediate download and adjustment. So, changes can be made in the color, design, graphics or any other component to create a unique layout.
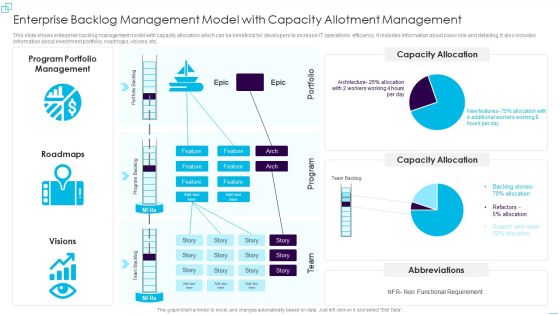
Enterprise Backlog Management Model With Capacity Allotment Management Designs PDF
This slide shows enterprise backlog management model with capacity allocation which can be beneficial for developers to increase IT operations efficiency. It includes information about basic role and detailing. It also includes information about investment portfolio, roadmaps, visions, etc. Pitch your topic with ease and precision using this Enterprise Backlog Management Model With Capacity Allotment Management Designs PDF. This layout presents information on Capacity Allocation, Program Portfolio Management. It is also available for immediate download and adjustment. So, changes can be made in the color, design, graphics or any other component to create a unique layout.

Data Analysis Dashboard Showing Organizations Manufacturing Efficiency Demonstration PDF
This slide shows the dashboard highlighting the improvement in supply chain management of an organization through the use of manufacturing analytics software. Pitch your topic with ease and precision using this Data Analysis Dashboard Showing Organizations Manufacturing Efficiency Demonstration PDF. This layout presents information on Productivity, Revenue, Manufacturing Efficiency. It is also available for immediate download and adjustment. So, changes can be made in the color, design, graphics or any other component to create a unique layout.
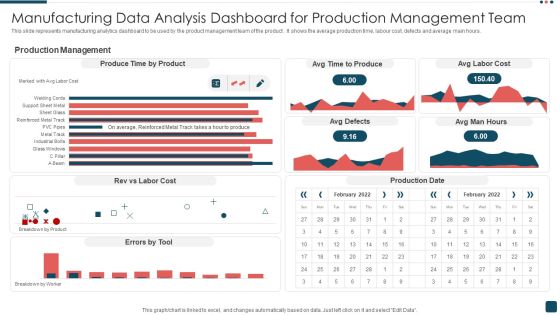
Manufacturing Data Analysis Dashboard For Production Management Team Summary PDF
This slide represents manufacturing analytics dashboard to be used by the product management team of the product . It shows the average production time, labour cost, defects and average main hours. Pitch your topic with ease and precision using this Manufacturing Data Analysis Dashboard For Production Management Team Summary PDF. This layout presents information on Production Management, Product, Cost. It is also available for immediate download and adjustment. So, changes can be made in the color, design, graphics or any other component to create a unique layout.

Case Administration Dashboard With Resolved Cases Graphics PDF
This slide shows dashboard which can be used to monitor the status of case management solved in the organizations. It includes key performance indicators such as active cases by priority, by subject, by age, by branch, etc. Pitch your topic with ease and precision using this Case Administration Dashboard With Resolved Cases Graphics PDF. This layout presents information on Case Administration Dashboard, Resolved Cases. It is also available for immediate download and adjustment. So, changes can be made in the color, design, graphics or any other component to create a unique layout.
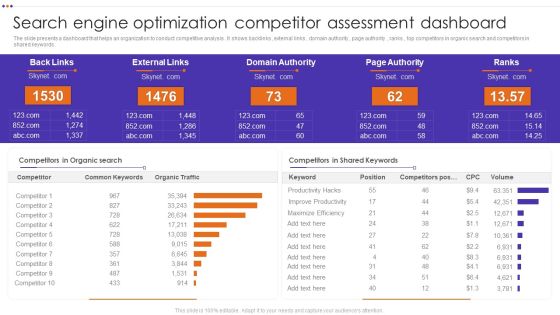
Search Engine Optimization Competitor Assessment Dashboard Graphics PDF
Pitch your topic with ease and precision using this Search Engine Optimization Competitor Assessment Dashboard Graphics PDF. This layout presents information on Domain Authority, External Links, Competitors In Organic. It is also available for immediate download and adjustment. So, changes can be made in the color, design, graphics or any other component to create a unique layout.

Project Health Monitoring Dashboard For Quality Administration Plan Clipart PDF
This slide illustrates quality management dashboard that can help organization to plan and identify the defects and fatal errors of project. Its key elements are total tasks, sample, quality score, defect analysis, quality score and sampling percentage. Pitch your topic with ease and precision using this Project Health Monitoring Dashboard For Quality Administration Plan Clipart PDF. This layout presents information on Quality Score, Quality Administration Plan, Defects Analysis. It is also available for immediate download and adjustment. So, changes can be made in the color, design, graphics or any other component to create a unique layout.
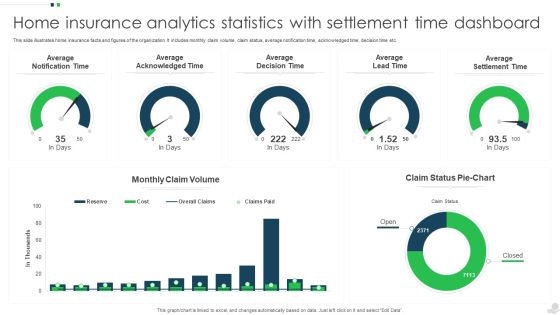
Home Insurance Analytics Statistics With Settlement Time Dashboard Ideas PDF
This slide illustrates home insurance facts and figures of the organization. It includes monthly claim volume, claim status, average notification time, acknowledged time, decision time etc. Pitch your topic with ease and precision using this Home Insurance Analytics Statistics With Settlement Time Dashboard Ideas PDF. This layout presents information on Average Acknowledged Time, Average Decision Time, Average Lead Time. It is also available for immediate download and adjustment. So, changes can be made in the color, design, graphics or any other component to create a unique layout.

Insurance Analytics Corporation Sales Insights Dashboard Structure PDF
This slide illustrates facts and figures in relation to sales and overall policy status. It includes total policies and premiums in current and previous year, quarterly premium revenue and monthly policy status. Pitch your topic with ease and precision using this Insurance Analytics Corporation Sales Insights Dashboard Structure PDF. This layout presents information on Quarterly Premium Revenue, Sales Insights Dashboard, Insurance Analytics Corporation. It is also available for immediate download and adjustment. So, changes can be made in the color, design, graphics or any other component to create a unique layout.
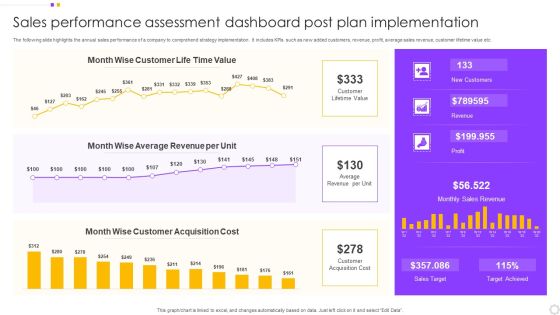
Sales Performance Assessment Dashboard Post Plan Implementation Introduction PDF
The following slide highlights the annual sales performance of a company to comprehend strategy implementation. It includes KPIs such as new added customers, revenue, profit, average sales revenue, customer lifetime value etc. Pitch your topic with ease and precision using this Sales Performance Assessment Dashboard Post Plan Implementation Introduction PDF. This layout presents information on Customer, Value, Average Revenue. It is also available for immediate download and adjustment. So, changes can be made in the color, design, graphics or any other component to create a unique layout.

Dashboard Depicting Customer Engagement In Marketing Campaigns Inspiration PDF
This slide illustrates a dashboard showcasing digital customer management in the campaign. It covers emails sent, delivered, and opened by customers, website clicks, and bounce rate. Pitch your topic with ease and precision using this Dashboard Depicting Customer Engagement In Marketing Campaigns Inspiration PDF. This layout presents information on Program, Campaign, Email Message. It is also available for immediate download and adjustment. So, changes can be made in the color, design, graphics or any other component to create a unique layout.
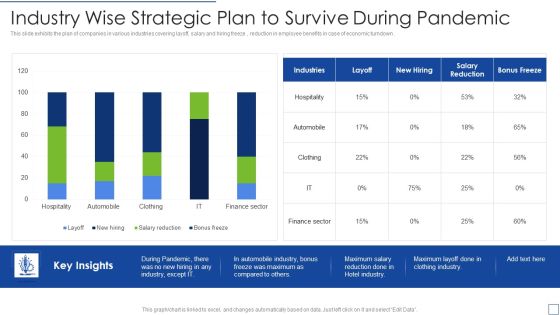
Industry Wise Strategic Plan To Survive During Pandemic Themes PDF
This slide exhibits the plan of companies in various industries covering layoff, salary and hiring freeze , reduction in employee benefits in case of economic turndown. Pitch your topic with ease and precision using this Industry Wise Strategic Plan To Survive During Pandemic Themes PDF. This layout presents information on During Pandemic, Maximum Salary Reduction, Industry. It is also available for immediate download and adjustment. So, changes can be made in the color, design, graphics or any other component to create a unique layout.

Project Cost And Transition Plan Dashboard Clipart PDF
This slide covers project cost and transition plan dashboard which includes new construction in project with research and development. Further, it includes project baseline cost and actual cost. Pitch your topic with ease and precision using this Project Cost And Transition Plan Dashboard Clipart PDF. This layout presents information on Development, Baseline Cost, Project Costs. It is also available for immediate download and adjustment. So, changes can be made in the color, design, graphics or any other component to create a unique layout.
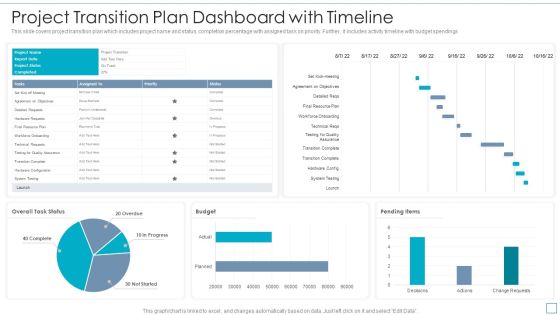
Project Transition Plan Dashboard With Timeline Topics PDF
This slide covers project transition plan which includes project name and status, completion percentage with assigned task on priority. Further, it includes activity timeline with budget spendings. Pitch your topic with ease and precision using this Project Transition Plan Dashboard With Timeline Topics PDF. This layout presents information on Budget, System Testing, Testing For Quality Assurance. It is also available for immediate download and adjustment. So, changes can be made in the color, design, graphics or any other component to create a unique layout.
