Bar Graph
Profit Margin Growth Graph With Percentage Ratio Ppt PowerPoint Presentation Professional Icon PDF
Showcasing this set of slides titled profit margin growth graph with percentage ratio ppt powerpoint presentation professional icon pdf. The topics addressed in these templates are profit margin per sale, target per sales rep, 2017 to 2027. All the content presented in this PPT design is completely editable. Download it and make adjustments in color, background, font etc. as per your unique business setting.

Convertible Debt Financing Pitch Deck Financial Graph Historical And Projection Clipart PDF
Deliver an awe-inspiring pitch with this creative convertible debt financing pitch deck financial graph historical and projection clipart pdf bundle. Topics like revenue, operating income, net income can be discussed with this completely editable template. It is available for immediate download depending on the needs and requirements of the user.
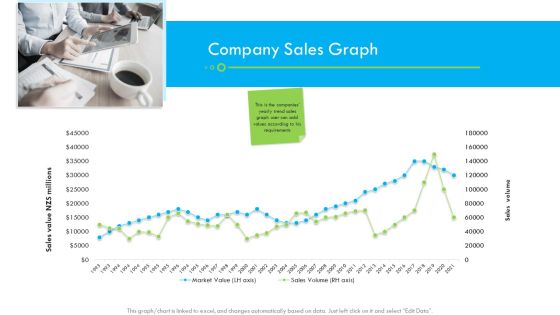
Enterprise Tactical Planning Company Sales Graph Ppt Portfolio Design Inspiration PDF
Deliver an awe-inspiring pitch with this creative enterprise tactical planning company sales graph ppt portfolio design inspiration pdf bundle. Topics like market volume, sales volume can be discussed with this completely editable template. It is available for immediate download depending on the needs and requirements of the user.
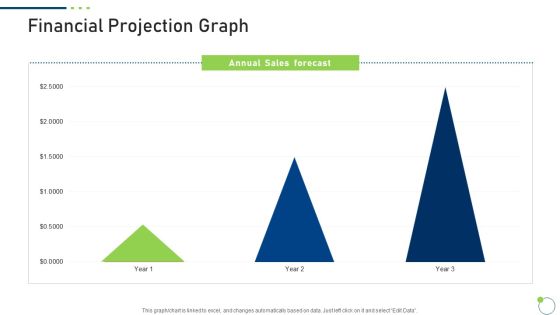
Investor Pitch Deck New Venture Capital Raising Financial Projection Graph Slide2 Portrait PDF
Deliver and pitch your topic in the best possible manner with this investor pitch deck new venture capital raising financial projection graph slide2 portrait pdf. Use them to share invaluable insights on annual sales, gross margin, net profit and impress your audience. This template can be altered and modified as per your expectations. So, grab it now.
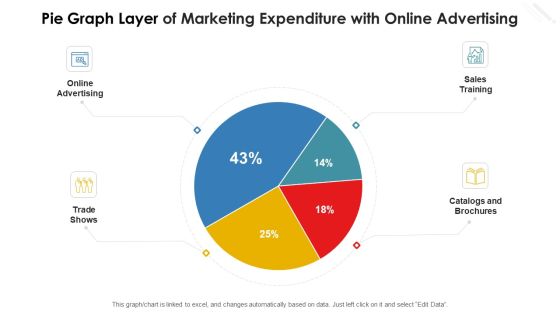
Pie Graph Layer Of Marketing Expenditure With Online Advertising Graphics PDF
Showcasing this set of slides titled pie graph layer of marketing expenditure with online advertising graphics pdf. The topics addressed in these templates are online advertising, trade shows, catalogs and brochures, sales training. All the content presented in this PPT design is completely editable. Download it and make adjustments in color, background, font etc. as per your unique business setting.

Annual Human Resource Report With Employee Hiring And Promotion Graph Mockup PDF
This slide showcases HR report and graph that can help organization to identify number of of employees demoted and promoted in the company. It showcases comparison for a period of last three years. Pitch your topic with ease and precision using this Annual Human Resource Report With Employee Hiring And Promotion Graph Mockup PDF. This layout presents information on Technology, Product, Employees. It is also available for immediate download and adjustment. So, changes can be made in the color, design, graphics or any other component to create a unique layout.

E Commerce Business Sales Monthly Forecast Graph Ppt Infographics Show PDF
This slide shows the table and graph representing monthly sales forecast of an e-commerce business. It shows details related to the expected growth rate, historical data, projected data and actual growth of sales. Pitch your topic with ease and precision using this E Commerce Business Sales Monthly Forecast Graph Ppt Infographics Show PDF. This layout presents information on Expected Growth Rate, Historical, Actual Growth Rate. It is also available for immediate download and adjustment. So, changes can be made in the color, design, graphics or any other component to create a unique layout.

Corporate Training Program Employee Productivity And Efficiency Graph For Last 5 Years Elements PDF
The following slide showcases he employees productivity and efficiency graph for last years which shows that employees productivity has declined during this time period because of lack of training programs and high attrition rate. Make sure to capture your audiences attention in your business displays with our gratis customizable Corporate Training Program Employee Productivity And Efficiency Graph For Last 5 Years Elements PDF. These are great for business strategies, office conferences, capital raising or task suggestions. If you desire to acquire more customers for your tech business and ensure they stay satisfied, create your own sales presentation with these plain slides.

Man Run Up On Graph Business PowerPoint Themes And PowerPoint Slides 0511
Microsoft PowerPoint Slide and Theme with man moving up on graph chart business growth success finances diagram improvement
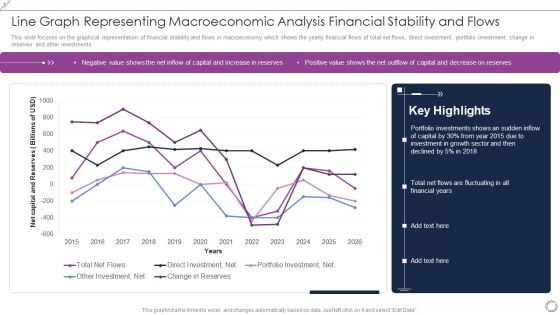
Line Graph Representing Macroeconomic Analysis Financial Stability And Flows Rules PDF
This slide focuses on the graphical representation of financial stability and flows in macroeconomy which shows the yearly financial flows of total net flows, direct investment, portfolio investment, change in reserves and other investments. Showcasing this set of slides titled Line Graph Representing Macroeconomic Analysis Financial Stability And Flows Rules PDF. The topics addressed in these templates are Total Net Flows, Direct Investment, Net, Portfolio Investment, Net. All the content presented in this PPT design is completely editable. Download it and make adjustments in color, background, font etc. as per your unique business setting.
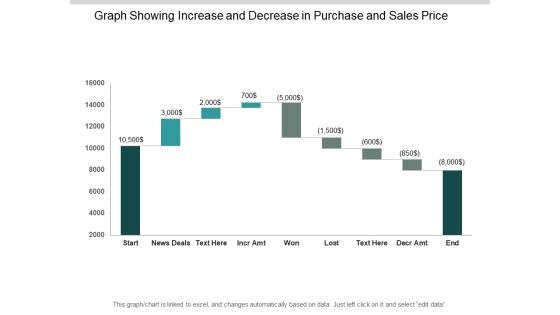
Graph Showing Increase And Decrease In Purchase And Sales Price Ppt PowerPoint Presentation Outline Gallery
This is a graph showing increase and decrease in purchase and sales price ppt powerpoint presentation outline gallery. This is a nine stage process. The stages in this process are sales waterfall, waterfall chart, business.

Sales Graph Showing Payouts Losses And Wins Ppt PowerPoint Presentation Pictures Designs Download
This is a sales graph showing payouts losses and wins ppt powerpoint presentation pictures designs download. This is a eight stage process. The stages in this process are sales waterfall, waterfall chart, business.

Waterfall Graph For Income And Expense Analysis Ppt PowerPoint Presentation File Deck
This is a waterfall graph for income and expense analysis ppt powerpoint presentation file deck. This is a eight stage process. The stages in this process are sales waterfall, waterfall chart, business.

Area Graph Showing Sales Trends Over Time Ppt PowerPoint Presentation Model Background Designs
This is a area graph showing sales trends over time ppt powerpoint presentation model background designs. This is a three stage process. The stages in this process are financial analysis, quantitative, statistical modelling.
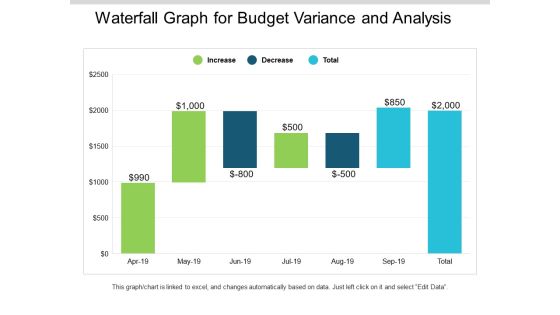
Waterfall Graph For Budget Variance And Analysis Ppt PowerPoint Presentation Slides Mockup
This is a waterfall graph for budget variance and analysis ppt powerpoint presentation slides mockup. This is a three stage process. The stages in this process are profit and loss, balance sheet, income statement, benefit and loss.

Waterfall Graph Showing Net Sales And Gross Profit Ppt PowerPoint Presentation Infographics Format
This is a waterfall graph showing net sales and gross profit ppt powerpoint presentation infographics format. This is a three stage process. The stages in this process are profit and loss, balance sheet, income statement, benefit and loss.
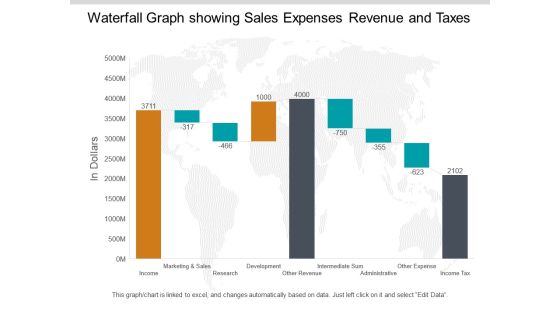
Waterfall Graph Showing Sales Expenses Revenue And Taxes Ppt PowerPoint Presentation Pictures Summary
This is a waterfall graph showing sales expenses revenue and taxes ppt powerpoint presentation pictures summary. This is a three stage process. The stages in this process are profit and loss, balance sheet, income statement, benefit and loss.

Waterfall Graph Summarize Budget 2018 To 2019 Ppt PowerPoint Presentation Summary Slides
This is a waterfall graph summarize budget 2018 to 2019 ppt powerpoint presentation summary slides. This is a three stage process. The stages in this process are profit and loss, balance sheet, income statement, benefit and loss.
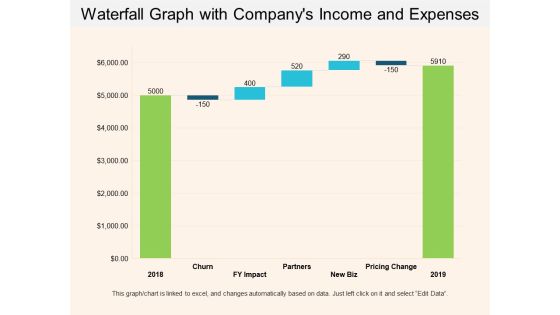
Waterfall Graph With Companys Income And Expenses Ppt PowerPoint Presentation Show Example Introduction
This is a waterfall graph with companys income and expenses ppt powerpoint presentation show example introduction. This is a three stage process. The stages in this process are profit and loss, balance sheet, income statement, benefit and loss.

Waterfall Graph With Monthly Expenses And Savings Ppt PowerPoint Presentation Layouts Clipart Images
This is a waterfall graph with monthly expenses and savings ppt powerpoint presentation layouts clipart images. This is a three stage process. The stages in this process are profit and loss, balance sheet, income statement, benefit and loss.
Pareto Graph Of Consumer Assessment For Business Performance Ppt PowerPoint Presentation Icon Inspiration PDF
Presenting this set of slides with name pareto graph of consumer assessment for business performance ppt powerpoint presentation icon inspiration pdf. The topics discussed in these slides are customer, product, market, pareto chart, sales, value. This is a completely editable PowerPoint presentation and is available for immediate download. Download now and impress your audience.
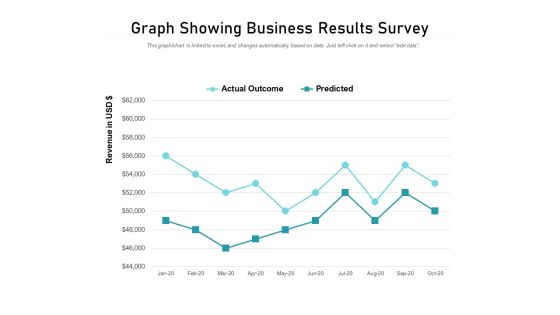
Graph Showing Business Results Survey Ppt PowerPoint Presentation Summary Slide Portrait
Presenting this set of slides with name graph showing business results survey ppt powerpoint presentation summary slide portrait. The topics discussed in these slides are actual outcomes, predicted. This is a completely editable PowerPoint presentation and is available for immediate download. Download now and impress your audience.
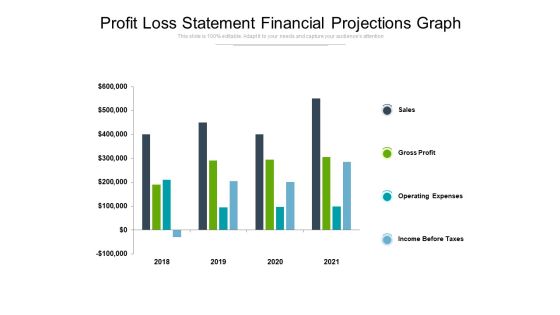
Profit Loss Statement Financial Projections Graph Ppt PowerPoint Presentation Summary Slides
Presenting this set of slides with name profit loss statement financial projections graph ppt powerpoint presentation summary slides. The topics discussed in these slides are sales, gross profit, operating expenses, income before taxes. This is a completely editable PowerPoint presentation and is available for immediate download. Download now and impress your audience.

Current Ratio Interpretation And Analysis Graph Ppt PowerPoint Presentation Outline Inspiration PDF
Presenting this set of slides with name current ratio interpretation and analysis graph ppt powerpoint presentation outline inspiration pdf. The topics discussed in these slides are current ration, quick ration. This is a completely editable PowerPoint presentation and is available for immediate download. Download now and impress your audience.
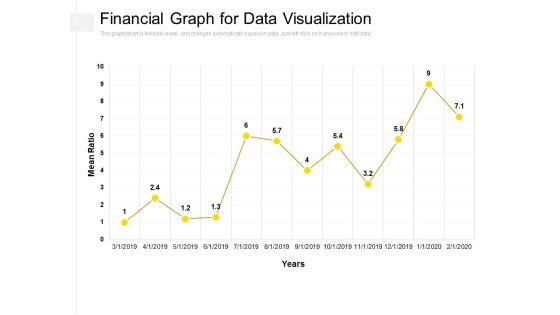
Financial Graph For Data Visualization Ppt PowerPoint Presentation Slides Picture PDF
Presenting this set of slides with name financial graph for data visualization ppt powerpoint presentation slides picture pdf. The topics discussed in these slides are mean ration, year. This is a completely editable PowerPoint presentation and is available for immediate download. Download now and impress your audience.
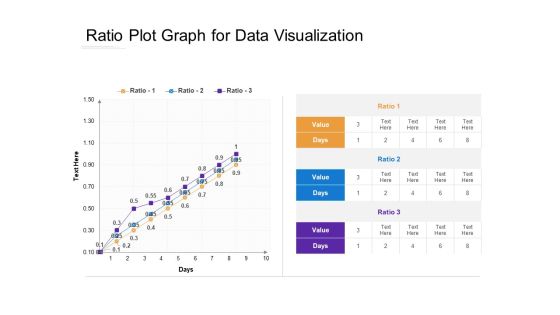
Ratio Plot Graph For Data Visualization Ppt PowerPoint Presentation Ideas Outfit PDF
Presenting this set of slides with name ratio plot graph for data visualization ppt powerpoint presentation ideas outfit pdf. The topics discussed in these slides are ratio, value, days. This is a completely editable PowerPoint presentation and is available for immediate download. Download now and impress your audience.
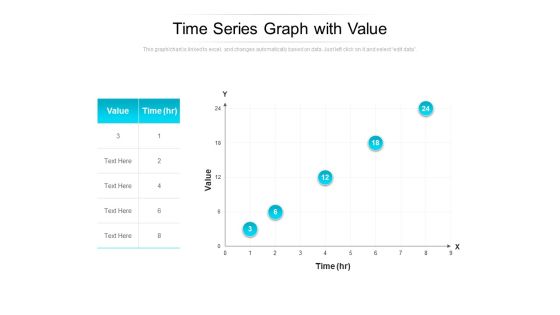
Time Series Graph With Value Ppt PowerPoint Presentation Pictures Graphics Example PDF
Presenting this set of slides with name time series graph with value ppt powerpoint presentation pictures graphics example pdf. The topics discussed in these slides are value, time. This is a completely editable PowerPoint presentation and is available for immediate download. Download now and impress your audience.
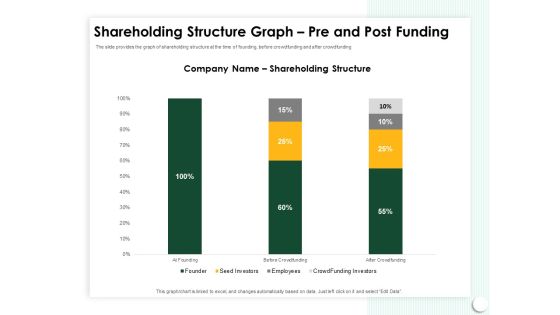
Startup Presentation For Collaborative Capital Funding Shareholding Structure Graph Pre And Post Funding Background PDF
Presenting this set of slides with name startup presentation for collaborative capital funding shareholding structure graph pre and post funding background pdf. The topics discussed in these slides are employee, shareholding structure, seed investors, crowd funding investors. This is a completely editable PowerPoint presentation and is available for immediate download. Download now and impress your audience.
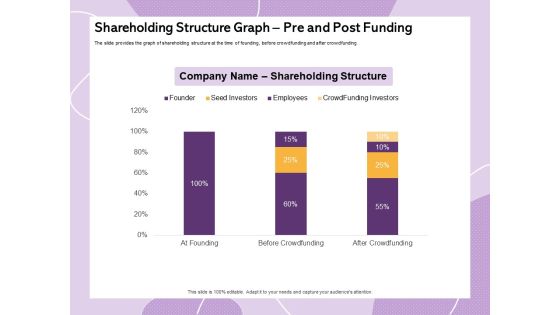
Investor Presentation For Society Funding Shareholding Structure Graph Pre And Post Funding Elements PDF
Presenting this set of slides with name investor presentation for society funding shareholding structure graph pre and post funding elements pdf. The topics discussed in these slides are before funding, after funding, value shares, investor. This is a completely editable PowerPoint presentation and is available for immediate download. Download now and impress your audience.
Gross And Net Revenue Comparison Shown By Graph Ppt PowerPoint Presentation File Icons PDF
Presenting this set of slides with name gross and net revenue comparison shown by graph ppt powerpoint presentation file icons pdf. The topics discussed in these slides are gross profit, net profit. This is a completely editable PowerPoint presentation and is available for immediate download. Download now and impress your audience.

Customer Relationship Management In Freehold Property Shareholding Structure Graph Pre And Post Funding Elements PDF
Presenting this set of slides with name customer relationship management in freehold property shareholding structure graph pre and post funding elements pdf. The topics discussed in these slides are employee, shareholding structure, seed investors, crowd funding investors. This is a completely editable PowerPoint presentation and is available for immediate download. Download now and impress your audience.

Annual Construction Expenses Graph Ppt PowerPoint Presentation Portfolio Slide Download PDF
Presenting this set of slides with name annual construction expenses graph ppt powerpoint presentation portfolio slide download pdf. The topics discussed in these slides are cost, actual, forecost, 2020. This is a completely editable PowerPoint presentation and is available for immediate download. Download now and impress your audience.

Fill Backorder Hours Analysis Graph Ppt PowerPoint Presentation Summary Example File PDF
Presenting this set of slides with name fill backorder hours analysis graph ppt powerpoint presentation summary example file pdf. The topics discussed in these slides are initial fill rates, hour to fill an order, analysis. This is a completely editable PowerPoint presentation and is available for immediate download. Download now and impress your audience.
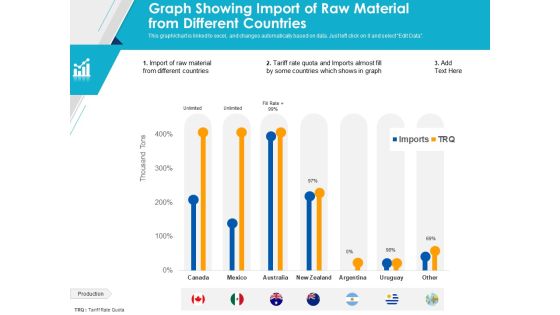
Graph Showing Import Of Raw Material From Different Countries Ppt PowerPoint Presentation Styles Slides PDF
Presenting this set of slides with name graph showing import of raw material from different countries ppt powerpoint presentation styles slides pdf. The topics discussed in these slides are raw material, production, tqr. This is a completely editable PowerPoint presentation and is available for immediate download. Download now and impress your audience.

Graph Showing Claims By Months And Quarters Ppt PowerPoint Presentation Ideas Outline PDF
Presenting this set of slides with name graph showing claims by months and quarters ppt powerpoint presentation ideas outline pdf. The topics discussed in these slides are total claims in quarter, total claims per month, business, life insurance, property, auto. This is a completely editable PowerPoint presentation and is available for immediate download. Download now and impress your audience.

Quarterly Product Sales Analysis Graph Ppt PowerPoint Presentation Portfolio Slide Download PDF
Presenting this set of slides with name quarterly product sales analysis graph ppt powerpoint presentation portfolio slide download pdf. The topics discussed in these slides are product sales, market segment, total sales, number of products sold, year 2020. This is a completely editable PowerPoint presentation and is available for immediate download. Download now and impress your audience.
Online Business Website Competitive Assessment Graph Ppt PowerPoint Presentation Icon Topics PDF
Presenting this set of slides with name online business website competitive assessment graph ppt powerpoint presentation icon topics pdf. The topics discussed in these slides are visitors, purchase, user visiting again, competitor. This is a completely editable PowerPoint presentation and is available for immediate download. Download now and impress your audience.
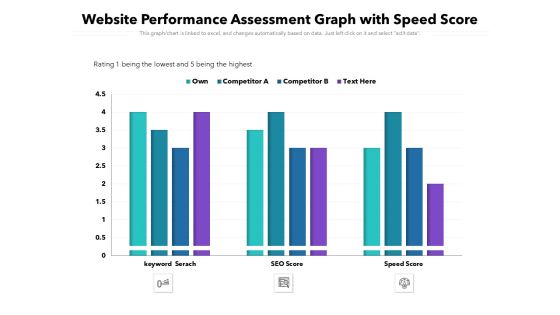
Website Performance Assessment Graph With Speed Score Ppt PowerPoint Presentation Layouts Display
Presenting this set of slides with name website performance assessment graph with speed score ppt powerpoint presentation layouts display. The topics discussed in these slides are keyword search, seo score, speed score, own, competitor. This is a completely editable PowerPoint presentation and is available for immediate download. Download now and impress your audience.

Region Wise Product Sales Graph Ppt PowerPoint Presentation Styles Layout Ideas PDF
Presenting this set of slides with name region wise product sales graph ppt powerpoint presentation styles layout ideas pdf. The topics discussed in these slides are country name ghi country, product name mno product, product sales, 2019, 2020. This is a completely editable PowerPoint presentation and is available for immediate download. Download now and impress your audience.

Business Employee Turnover Graph With New Joiners And Resigned Employees Ppt PowerPoint Presentation Summary Backgrounds PDF
Presenting this set of slides with name business employee turnover graph with new joiners and resigned employees ppt powerpoint presentation summary backgrounds pdf. The topics discussed in these slides are human resource, client servicing, it, marketing, sales, purchase. This is a completely editable PowerPoint presentation and is available for immediate download. Download now and impress your audience.
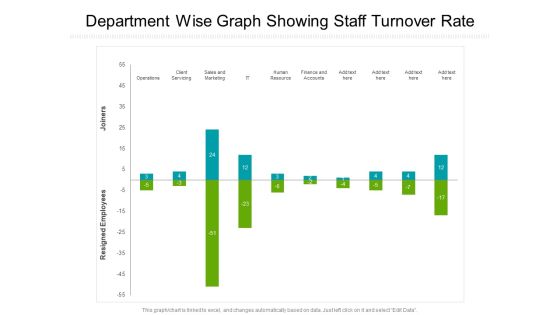
Department Wise Graph Showing Staff Turnover Rate Ppt PowerPoint Presentation Gallery Outfit PDF
Presenting this set of slides with name department wise graph showing staff turnover rate ppt powerpoint presentation gallery outfit pdf. The topics discussed in these slides are operations, client servicing, sales and marketing, it, human resource, finance and accounts. This is a completely editable PowerPoint presentation and is available for immediate download. Download now and impress your audience.
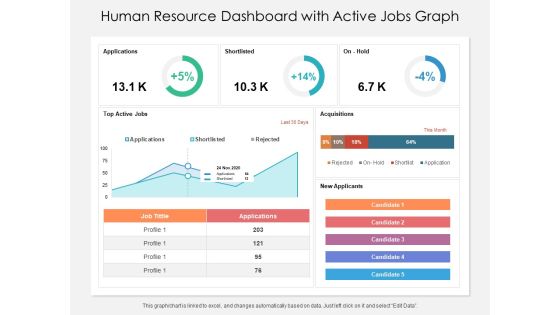
Human Resource Dashboard With Active Jobs Graph Ppt PowerPoint Presentation File Influencers PDF
Presenting this set of slides with name human resource dashboard with active jobs graph ppt powerpoint presentation file influencers pdf. The topics discussed in these slides are acquisitions, applications, shortlisted. This is a completely editable PowerPoint presentation and is available for immediate download. Download now and impress your audience.
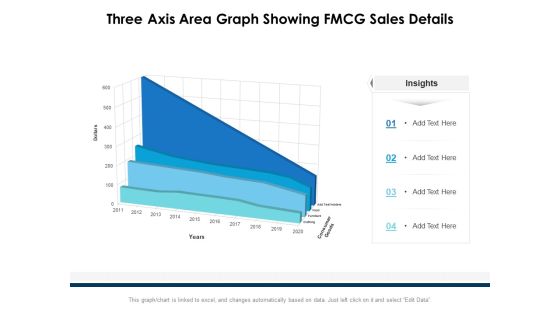
Three Axis Area Graph Showing FMCG Sales Details Ppt PowerPoint Presentation Ideas Layouts PDF
Presenting this set of slides with name three axis area graph showing fmcg sales details ppt powerpoint presentation ideas layouts pdf. The topics discussed in these slides are consumer goods, dollars, 2011 to 2020. This is a completely editable PowerPoint presentation and is available for immediate download. Download now and impress your audience.
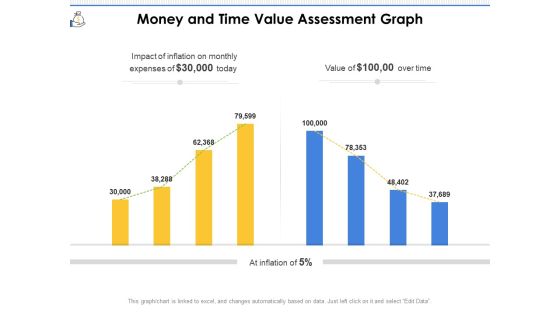
Money And Time Value Assessment Graph Ppt PowerPoint Presentation File Outline PDF
Presenting this set of slides with name money and time value assessment graph ppt powerpoint presentation file outline pdf. The topics discussed in these slides are inflation, expenses, value. This is a completely editable PowerPoint presentation and is available for immediate download. Download now and impress your audience.
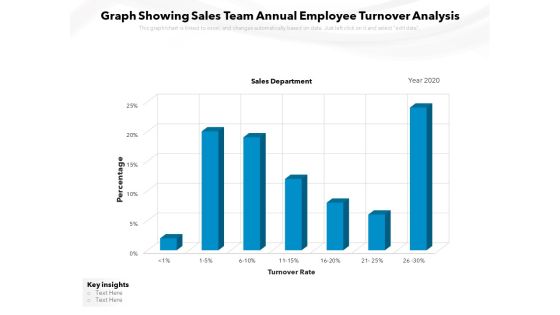
Graph Showing Sales Team Annual Employee Turnover Analysis Ppt PowerPoint Presentation Ideas PDF
Presenting this set of slides with name graph showing sales team annual employee turnover analysis ppt powerpoint presentation ideas pdf. The topics discussed in these slides are sales department, turnover rate, percentage, key insights, 2020. This is a completely editable PowerPoint presentation and is available for immediate download. Download now and impress your audience.

Burndown Graph With Actual And Ideal Hours Ppt PowerPoint Presentation Ideas Example Topics PDF
Presenting this set of slides with name burndown graph with actual and ideal hours ppt powerpoint presentation ideas example topics pdf. The topics discussed in these slides are efforts remaining, reduced work efforts till the day, team. This is a completely editable PowerPoint presentation and is available for immediate download. Download now and impress your audience.

Burndown Graph With Actual Time Remaining Ppt PowerPoint Presentation Styles Professional PDF
Presenting this set of slides with name burndown graph with actual time remaining ppt powerpoint presentation styles professional pdf. The topics discussed in these slides are estimated time remaining, actual time remaining, series. This is a completely editable PowerPoint presentation and is available for immediate download. Download now and impress your audience.

Burndown Graph With Remaining And Completed Tasks Ppt PowerPoint Presentation Icon Show PDF
Presenting this set of slides with name burndown graph with remaining and completed tasks ppt powerpoint presentation icon show pdf. The topics discussed in these slides are task completed, efforts remained, ideal burndown, task remained. This is a completely editable PowerPoint presentation and is available for immediate download. Download now and impress your audience.

Burndown Graph With Sprints And Story Points Ppt PowerPoint Presentation Layouts Professional PDF
Presenting this set of slides with name burndown graph with sprints and story points ppt powerpoint presentation layouts professional pdf. The topics discussed in these slides are actual, average, high, low. This is a completely editable PowerPoint presentation and is available for immediate download. Download now and impress your audience.

Iteration Burndown Graph With Story Points Ppt PowerPoint Presentation Model Background Images PDF
Presenting this set of slides with name iteration burndown graph with story points ppt powerpoint presentation model background images pdf. The topics discussed in these slides are team velocity, story points, series, work remaining. This is a completely editable PowerPoint presentation and is available for immediate download. Download now and impress your audience.
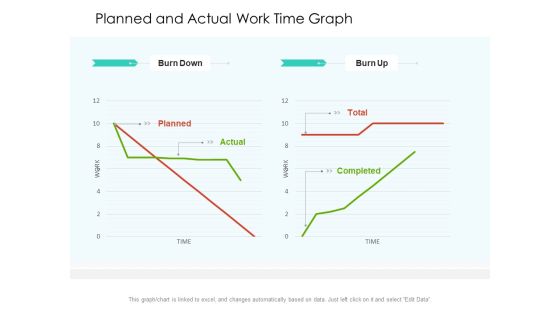
Planned And Actual Work Time Graph Ppt PowerPoint Presentation Layouts Master Slide PDF
Presenting this set of slides with name planned and actual work time graph ppt powerpoint presentation layouts master slide pdf. The topics discussed in these slides are burn down, burn up, planned, actual, completed, time, work. This is a completely editable PowerPoint presentation and is available for immediate download. Download now and impress your audience.
Release Burndown Graph With Target Work To Be Done Ppt PowerPoint Presentation Icon Slideshow PDF
Presenting this set of slides with name release burndown graph with target work to be done ppt powerpoint presentation icon slideshow pdf. The topics discussed in these slides are behind schedule, ahead of schedule, target work, completed work. This is a completely editable PowerPoint presentation and is available for immediate download. Download now and impress your audience.

Business Growth S Curve Graph Ppt PowerPoint Presentation Portfolio Images PDF
Presenting this set of slides with name business growth s curve graph ppt powerpoint presentation portfolio images pdf. The topics discussed in these slides are progress plan, progress actual, eac equivalent annual budget. This is a completely editable PowerPoint presentation and is available for immediate download. Download now and impress your audience.
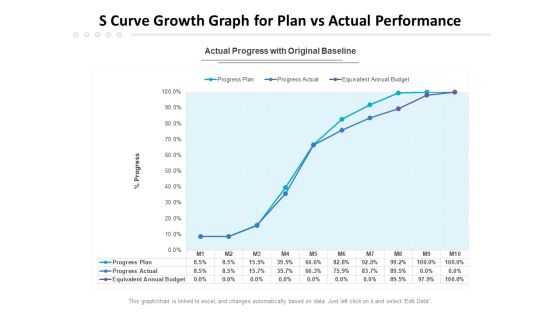
S Curve Growth Graph For Plan Vs Actual Performance Ppt PowerPoint Presentation Show Layouts PDF
Presenting this set of slides with name s curve growth graph for plan vs actual performance ppt powerpoint presentation show layouts pdf. The topics discussed in these slides are progress plan, progress actual, equivalent annual budget. This is a completely editable PowerPoint presentation and is available for immediate download. Download now and impress your audience.

Monthly Sales Growth Graph Of A Business Ppt PowerPoint Presentation Ideas File Formats PDF
Presenting this set of slides with name monthly sales growth graph of a business ppt powerpoint presentation ideas file formats pdf. The topics discussed in these slides are sales growth, cumulative sales year. This is a completely editable PowerPoint presentation and is available for immediate download. Download now and impress your audience.

Downturn Graph Showing Company Comparison Ppt PowerPoint Presentation Professional Graphics Design PDF
Pitch your topic with ease and precision using this downturn graph showing company comparison ppt powerpoint presentation professional graphics design pdf. This layout presents information on company growth rate, red bull, pepsi. It is also available for immediate download and adjustment. So, changes can be made in the color, design, graphics or any other component to create a unique layout.

Activity Based Costing Bag Graph With Vendor Fees Ppt PowerPoint Presentation Portfolio Inspiration PDF
Pitch your topic with ease and precision using this activity based costing bag graph with vendor fees ppt powerpoint presentation portfolio inspiration pdf. This layout presents information on vendor fees, patient recruitment. It is also available for immediate download and adjustment. So, changes can be made in the color, design, graphics or any other component to create a unique layout.

Sprint Burndown Graph With Completed Tasks Ppt PowerPoint Presentation Show Styles PDF
Pitch your topic with ease and precision using this sprint burndown graph with completed tasks ppt powerpoint presentation show styles pdf. This layout presents information on completed tasks, ideal burndown, remaining effort2, remaining task. It is also available for immediate download and adjustment. So, changes can be made in the color, design, graphics or any other component to create a unique layout.

Pie Graph Layer Showing Sector Wise Sales In 2022 Microsoft PDF
Pitch your topic with ease and precision using this pie graph layer showing sector wise sales in 2022 microsoft pdf. This layout presents information on consumer goods, information technology, automobile, financial services, engineering. It is also available for immediate download and adjustment. So, changes can be made in the color, design, graphics or any other component to create a unique layout.

Accounting Ratio Assessment Graph With Cash Flow Ppt PowerPoint Presentation Model Samples PDF
Pitch your topic with ease and precision using this Accounting Ratio Assessment Graph With Cash Flow Ppt PowerPoint Presentation Model Samples PDF. This layout presents information on Cash Flow, Improvement, Total. It is also available for immediate download and adjustment. So, changes can be made in the color, design, graphics or any other component to create a unique layout.
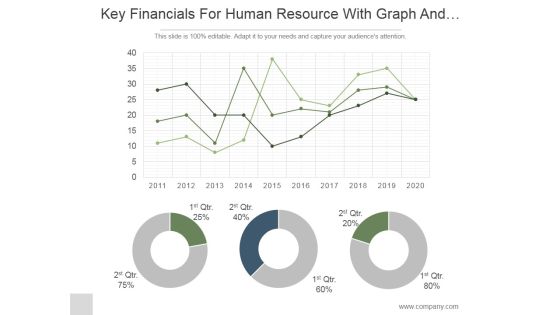
Key Financials For Human Resource With Graph And Pie Chart Ppt PowerPoint Presentation Ideas
This is a key financials for human resource with graph and pie chart ppt powerpoint presentation ideas. This is a three stage process. The stages in this process are business, strategy, marketing, analysis, donut, growth.
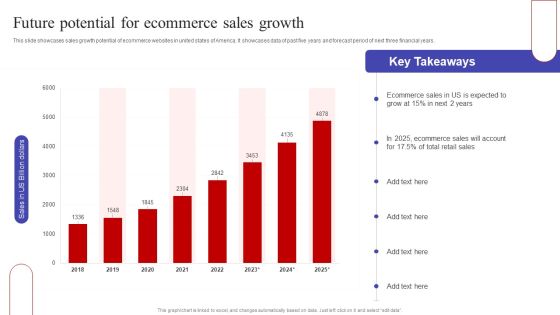
Future Potential For Ecommerce Sales Growth Ppt PowerPoint Presentation Diagram Graph Charts PDF
This slide showcases sales growth potential of ecommerce websites in united states of America. It showcases data of past five years and forecast period of next three financial years. Here you can discover an assortment of the finest PowerPoint and Google Slides templates. With these templates, you can create presentations for a variety of purposes while simultaneously providing your audience with an eye catching visual experience. Download Future Potential For Ecommerce Sales Growth Ppt PowerPoint Presentation Diagram Graph Charts PDF to deliver an impeccable presentation. These templates will make your job of preparing presentations much quicker, yet still, maintain a high level of quality. Slidegeeks has experienced researchers who prepare these templates and write high quality content for you. Later on, you can personalize the content by editing the Future Potential For Ecommerce Sales Growth Ppt PowerPoint Presentation Diagram Graph Charts PDF.
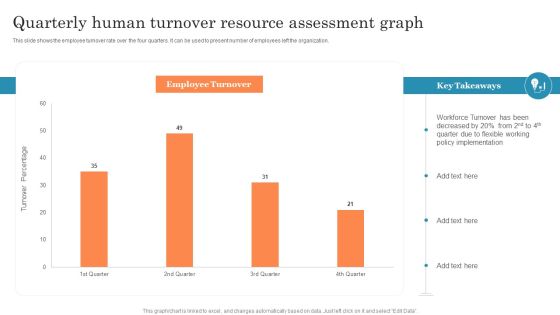
Quarterly Human Turnover Resource Assessment Graph Ppt PowerPoint Presentation Styles Infographic Template PDF
This slide shows the employee turnover rate over the four quarters. It can be used to present number of employees left the organization. Showcasing this set of slides titled Quarterly Human Turnover Resource Assessment Graph Ppt PowerPoint Presentation Styles Infographic Template PDF. The topics addressed in these templates are Flexible Working, Policy Implementation, Turnover Been. All the content presented in this PPT design is completely editable. Download it and make adjustments in color, background, font etc. as per your unique business setting.

Business Case Summary With Graph And Key Findings Ppt PowerPoint Presentation Outline Design Templates PDF
Pitch your topic with ease and precision using this business case summary with graph and key findings ppt powerpoint presentation outline design templates pdf. This layout presents information on business case highlights, market value, time, approach followed, key findings, year 2020, cost. It is also available for immediate download and adjustment. So, changes can be made in the color, design, graphics or any other component to create a unique layout.
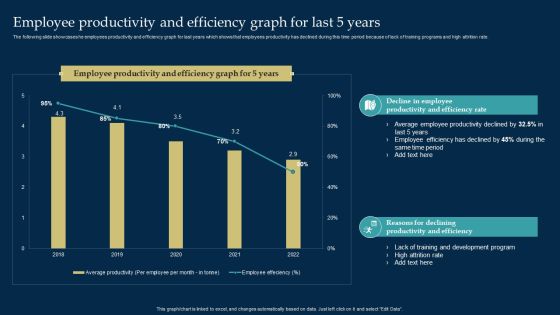
Employee Training And Development Strategy Employee Productivity And Efficiency Graph For Last 5 Years Graphics PDF
The following slide showcases he employees productivity and efficiency graph for last years which shows that employees productivity has declined during this time period because of lack of training programs and high attrition rate. Do you know about Slidesgeeks Employee Training And Development Strategy Employee Productivity And Efficiency Graph For Last 5 Years Graphics PDF These are perfect for delivering any kind od presentation. Using it, create PowerPoint presentations that communicate your ideas and engage audiences. Save time and effort by using our pre designed presentation templates that are perfect for a wide range of topic. Our vast selection of designs covers a range of styles, from creative to business, and are all highly customizable and easy to edit. Download as a PowerPoint template or use them as Google Slides themes.

Graph Highlighting Cost Involved In Multiple Clinical Trial Phases New Clinical Drug Trial Process Mockup PDF
This slide visually represents the money spent in each phase of the clinical trial procedure to check the safety and efficacy of the newly developed drug. Find highly impressive Graph Highlighting Cost Involved In Multiple Clinical Trial Phases New Clinical Drug Trial Process Mockup PDF on Slidegeeks to deliver a meaningful presentation. You can save an ample amount of time using these presentation templates. No need to worry to prepare everything from scratch because Slidegeeks experts have already done a huge research and work for you. You need to download Graph Highlighting Cost Involved In Multiple Clinical Trial Phases New Clinical Drug Trial Process Mockup PDF for your upcoming presentation. All the presentation templates are 100 percent editable and you can change the color and personalize the content accordingly. Download now.
Downturn Graph Showing Decrease In Income Over The Years Ppt PowerPoint Presentation Icon File Formats PDF
Showcasing this set of slides titled downturn graph showing decrease in income over the years ppt powerpoint presentation icon file formats pdf. The topics addressed in these templates are middle class share of total income, middle class share of income, union membership rate, 2013 to 2020. All the content presented in this PPT design is completely editable. Download it and make adjustments in color, background, font etc. as per your unique business setting.

Departmental Workforce Increase Graph Of Organization Ppt Infographics Graphics Pictures PDF
This slide shows increase in headcount of various departments of corporate. It includes departments such as marketing, finance, production, sales, etc. Showcasing this set of slides titled Departmental Workforce Increase Graph Of Organization Ppt Infographics Graphics Pictures PDF. The topics addressed in these templates are Customer Support Department, Number Customers, Highest Headcount. All the content presented in this PPT design is completely editable. Download it and make adjustments in color, background, font etc. as per your unique business setting.
Financial Line Graph Vector Icon Ppt PowerPoint Presentation Infographic Template Mockup
Presenting this set of slides with name financial line graph vector icon ppt powerpoint presentation infographic template mockup. This is a three stage process. The stages in this process are financial line graph vector icon. This is a completely editable PowerPoint presentation and is available for immediate download. Download now and impress your audience.

Problems Related To Current Product Positioning Ppt PowerPoint Presentation Diagram Graph Charts PDF
This slide highlights the problems related to current product positioning which showcases in graphical format depicting downgrading product sales and changing consumer trends. Do you have an important presentation coming up Are you looking for something that will make your presentation stand out from the rest Look no further than Problems Related To Current Product Positioning Ppt PowerPoint Presentation Diagram Graph Charts PDF. With our professional designs, you can trust that your presentation will pop and make delivering it a smooth process. And with Slidegeeks, you can trust that your presentation will be unique and memorable. So why wait Grab Problems Related To Current Product Positioning Ppt PowerPoint Presentation Diagram Graph Charts PDF today and make your presentation stand out from the rest
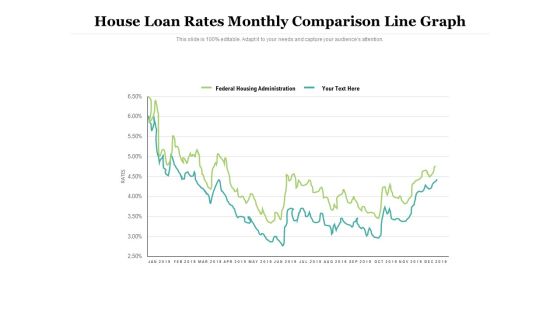
House Loan Rates Monthly Comparison Line Graph Ppt PowerPoint Presentation Slides Graphics Pictures PDF
Showcasing this set of slides titled house loan rates monthly comparison line graph ppt powerpoint presentation slides graphics pictures pdf. The topics addressed in these templates are federal housing administration, house loan rates, line graph. All the content presented in this PPT design is completely editable. Download it and make adjustments in color, background, font etc. as per your unique business setting.
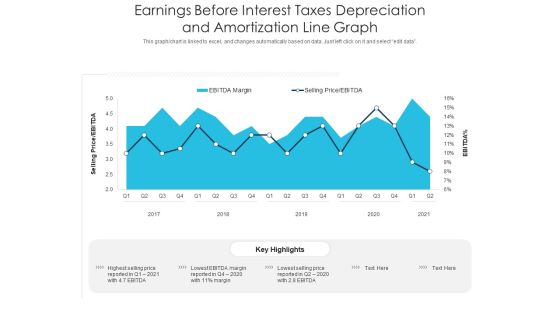
Earnings Before Interest Taxes Depreciation And Amortization Line Graph Ppt PowerPoint Presentation Layouts Aids PDF
Showcasing this set of slides titled earnings before interest taxes depreciation and amortization line graph ppt powerpoint presentation layouts aids pdf. The topics addressed in these templates are earnings before interest taxes depreciation and amortization line graph. All the content presented in this PPT design is completely editable. Download it and make adjustments in color, background, font etc. as per your unique business setting.

Budgetary Trends Graph Icon With Magnifying Glass And Trend Line Introduction PDF
Presenting Budgetary Trends Graph Icon With Magnifying Glass And Trend Line Introduction PDF to dispense important information. This template comprises four stages. It also presents valuable insights into the topics including Budgetary Trends, Graph Icon, Magnifying Glass. This is a completely customizable PowerPoint theme that can be put to use immediately. So, download it and address the topic impactfully.

Stakeholder Assessment Analysis Graph With Power And Interest Ppt Gallery Skills PDF
This slide shows the stakeholder assessment analysis graph with interest and power positions such as procurement, technicians, supervisors, operators, etc. This is a stakeholder assessment analysis graph with power and interest ppt gallery skills pdf. template with various stages. Focus and dispense information on four stages using this creative set, that comes with editable features. It contains large content boxes to add your information on topics like technicians, procurement, supervisors, operators. You can also showcase facts, figures, and other relevant content using this PPT layout. Grab it now.
Expenses And Income Comparison Graph With Budget Summary Ppt PowerPoint Presentation Icon Inspiration PDF
This slide illustrates budget summary of expenditure of a company. it includes income and expenditure comparative data and expenditure chart etc.Pitch your topic with ease and precision using this Expenses And Income Comparison Graph With Budget Summary Ppt PowerPoint Presentation Icon Inspiration PDF. This layout presents information on Budget Summary, Expenditure Comparative, Actual Income. It is also available for immediate download and adjustment. So, changes can be made in the color, design, graphics or any other component to create a unique layout.
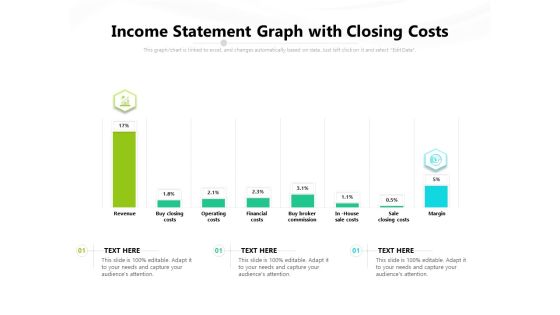
Income Statement Graph With Closing Costs Ppt PowerPoint Presentation Gallery Example Topics PDF
Presenting this set of slides with name income statement graph with closing costs ppt powerpoint presentation gallery example topics pdf. The topics discussed in these slides are revenue, buy closing costs, operating costs, financial costs, buy broker commission, in house sale costs, sale closing costs, margin. This is a completely editable PowerPoint presentation and is available for immediate download. Download now and impress your audience.

Pie Graph Representing United States Coast Guard Soldiers Ethic Diversity Ppt PowerPoint Presentation Layouts Backgrounds PDF
Pitch your topic with ease and precision using this pie graph representing united states coast guard soldiers ethic diversity ppt powerpoint presentation layouts backgrounds pdf. This layout presents information on hispanic, latino, asian, african american, ethnicity unknown, non resident alien. It is also available for immediate download and adjustment. So, changes can be made in the color, design, graphics or any other component to create a unique layout.

Product Graph Showing Cost Of Bad Quality At Various Levels Ppt PowerPoint Styles Model PDF
Pitch your topic with ease and precision using this product graph showing cost of bad quality at various levels ppt powerpoint styles model pdf. This layout presents information on minimum quality cost, minimum quality for minimum cost, total quality cost. It is also available for immediate download and adjustment. So, changes can be made in the color, design, graphics or any other component to create a unique layout.

Pie Graph 15 85 Percent Business PowerPoint Templates And PowerPoint Themes 0512
Pie Graph 15 85 Percent Business PowerPoint Templates And PowerPoint Themes PPT designs-Microsoft Powerpoint Templates and Background with fifteen and eighty five percent proportion pie chart

Substitute Financing Pitch Deck Shareholding Structure Graph Pre And Post Funding Rules PDF
The slide provides the graph of shareholding structure at the time of founding, before crowdfunding and after crowdfunding. Deliver an awe inspiring pitch with this creative substitute financing pitch deck shareholding structure graph pre and post funding rules pdf bundle. Topics like shareholding structure graph pre and post funding can be discussed with this completely editable template. It is available for immediate download depending on the needs and requirements of the user.
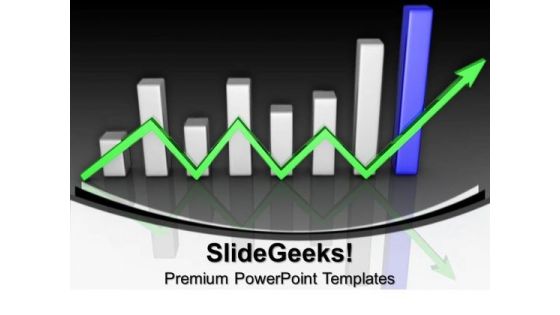
Graph With Success Arrow Finance PowerPoint Templates And PowerPoint Themes 0912
Graph With Success Arrow Finance PowerPoint Templates And PowerPoint Themes 0912-Microsoft Powerpoint Templates and Background with business success with arrow-Business success with arrow, finance, marketing, business, arrows, success

People In Business 3d Men Lifting Graph Piece Growth PowerPoint Templates
We present our people in business 3d men lifting graph piece growth PowerPoint templates.Download our Business PowerPoint Templates because Our PowerPoint Templates and Slides are effectively colour coded to prioritise your plans They automatically highlight the sequence

Business Strategy And Policy 3d Man With Money Market Graph Characters
Connect The Dots With Our business strategy and policy 3d man with money market graph characters Powerpoint Templates. Watch The Whole Picture Clearly Emerge.

Business Diagram Round Annual Graph 8 Stages Business Finance Strategy Development
Our Business Diagram Round Annual Graph 8 Stages Business Finance Strategy Development Powerpoint Templates Team Are A Dogged Lot. They Keep At It Till They Get It Right.
Three Sections Pie Graph With Icons Ppt PowerPoint Presentation Portfolio Good PDF
Presenting this set of slides with name three sections pie graph with icons ppt powerpoint presentation portfolio good pdf. This is a three stage process. The stages in this process are three sections pie graph with icons. This is a completely editable PowerPoint presentation and is available for immediate download. Download now and impress your audience.
Line Graph Icon For Business Statistical Analysis Ppt PowerPoint Presentation Gallery Clipart Images PDF
Presenting this set of slides with name line graph icon for business statistical analysis ppt powerpoint presentation gallery clipart images pdf. The topics discussed in these slide is line graph icon for business statistical analysis. This is a completely editable PowerPoint presentation and is available for immediate download. Download now and impress your audience.

Past Trends In Market Share Of ABC Carbonated Drink Company Ppt Diagram Graph Charts PDF
This slide shows the past trends in market share of ABC Carbonated Beverage Company worldwide. The market share has decreased due to decline in sales as people have become more health conscious and avoid beverages that have high sugar content and caffeine. Deliver an awe inspiring pitch with this creative past trends in market share of abc carbonated drink company ppt diagram graph charts pdf bundle. Topics like past trends in market share of abc carbonated drink company can be discussed with this completely editable template. It is available for immediate download depending on the needs and requirements of the user.

Attain Production Goals And Objectives Graph And Table Ppt Infographic Template Visuals PDF
This slide displays graphical representation of targeted and achieved production variance. It also includes critical insights such as target units, achieved production, achieved percentage, overachieved percentage, etc. Pitch your topic with ease and precision using this Attain Production Goals And Objectives Graph And Table Ppt Infographic Template Visuals PDF. This layout presents information on Target Vs Achieved, Key insight Table, Quarterly. It is also available for immediate download and adjustment. So, changes can be made in the color, design, graphics or any other component to create a unique layout.

Business People Images 3d Men Free PowerPoint Templates Success Graph Slides
We present our business people images 3d men free powerpoint templates success graph Slides.Download our People PowerPoint Templates because You are working at that stage with an air of royalty. Let our PowerPoint Templates and Slides be the jewels in your crown. Present our Business PowerPoint Templates because Our PowerPoint Templates and Slides are conceived by a dedicated team. Use them and give form to your wondrous ideas. Use our Handshake PowerPoint Templates because Your success is our commitment. Our PowerPoint Templates and Slides will ensure you reach your goal. Download and present our Arrows PowerPoint Templates because Our PowerPoint Templates and Slides are truly out of this world. Even the MIB duo has been keeping tabs on our team. Download and present our Flow Charts PowerPoint Templates because Our PowerPoint Templates and Slides are endowed to endure. Ideas conveyed through them will pass the test of time.Use these PowerPoint slides for presentations relating to 3d, abstract, agreement, business, cartoon, character, chart, concept, conceptual,contract, corporate, deal, figure, graph, graphic, handshake, human, illustration,isolated, man, market, partnership, person, presentation, render, stocks, success,symbolic. The prominent colors used in the PowerPoint template are White, Red, Gray. Professionals tell us our business people images 3d men free powerpoint templates success graph Slides look good visually. Professionals tell us our business PowerPoint templates and PPT Slides will make the presenter successul in his career/life. People tell us our business people images 3d men free powerpoint templates success graph Slides are incredible easy to use. Customers tell us our character PowerPoint templates and PPT Slides will help you be quick off the draw. Just enter your specific text and see your points hit home. The feedback we get is that our business people images 3d men free powerpoint templates success graph Slides are topically designed to provide an attractive backdrop to any subject. Use our chart PowerPoint templates and PPT Slides provide you with a vast range of viable options. Select the appropriate ones and just fill in your text.

Quarterly Declining Graph Of A Manufacturing Plant Ppt PowerPoint Presentation File Example Topics PDF
This chart shows how the production of the manufacturing plan is declining in every quarter because of some critical reasons and how it is effecting the companys growth and goodwill. Showcasing this set of slides titled Quarterly Declining Graph Of A Manufacturing Plant Ppt PowerPoint Presentation File Example Topics PDF. The topics addressed in these templates are Production Declined, Lack Of Technology, Unskilled Laborers. All the content presented in this PPT design is completely editable. Download it and make adjustments in color, background, font etc. as per your unique business setting.
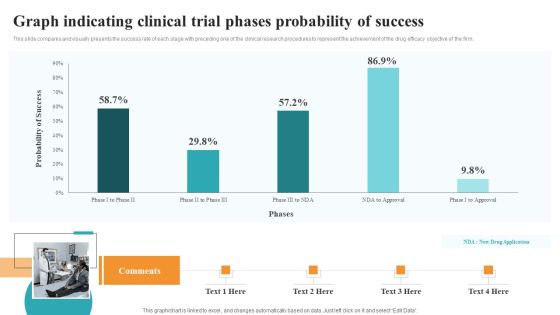
Graph Indicating Clinical Trial Phases Probability Of Success Medical Research Phases For Clinical Tests Graphics PDF
This slide compares and visually presents the success rate of each stage with preceding one of the clinical research procedures to represent the achievement of the drug efficacy objective of the firm. There are so many reasons you need a Graph Indicating Clinical Trial Phases Probability Of Success Medical Research Phases For Clinical Tests Graphics PDF. The first reason is you can not spend time making everything from scratch, Thus, Slidegeeks has made presentation templates for you too. You can easily download these templates from our website easily.

Graph Indicating Clinical Trial Phases Probability Of Success New Clinical Drug Trial Process Information PDF
This slide compares and visually presents the success rate of each stage with preceding one of the clinical research procedures to represent the achievement of the drug efficacy objective of the firm. If your project calls for a presentation, then Slidegeeks is your go-to partner because we have professionally designed, easy-to-edit templates that are perfect for any presentation. After downloading, you can easily edit Graph Indicating Clinical Trial Phases Probability Of Success New Clinical Drug Trial Process Information PDF and make the changes accordingly. You can rearrange slides or fill them with different images. Check out all the handy templates

Digital Advertising Plan For Bakery Business Dough Nut Graph Showing Demand Rules PDF
Do you know about Slidesgeeks Digital Advertising Plan For Bakery Business Dough Nut Graph Showing Demand Rules PDF These are perfect for delivering any kind od presentation. Using it, create PowerPoint presentations that communicate your ideas and engage audiences. Save time and effort by using our pre designed presentation templates that are perfect for a wide range of topic. Our vast selection of designs covers a range of styles, from creative to business, and are all highly customizable and easy to edit. Download as a PowerPoint template or use them as Google Slides themes.
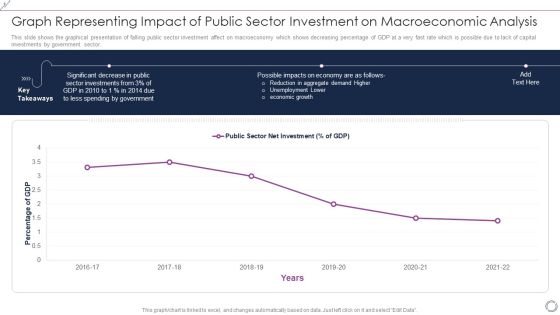
Graph Representing Impact Of Public Sector Investment On Macroeconomic Analysis Themes PDF
This slide shows the graphical presentation of falling public sector investment affect on macroeconomy which shows decreasing percentage of GDP at a very fast rate which is possible due to lack of capital investments by government sector. Showcasing this set of slides titled Graph Representing Impact Of Public Sector Investment On Macroeconomic Analysis Themes PDF. The topics addressed in these templates are Percentage GDP, 2016 to 2022, Public Sector Net Investment. All the content presented in this PPT design is completely editable. Download it and make adjustments in color, background, font etc. as per your unique business setting.

Breakeven Point Graph With Degree Of Operational Leverage Ppt Layouts Graphics Pictures PDF
This slide illustrates graphical representation of breakeven point and key insights. It includes figures of contribution margin, fixed costs, total cost, operating costs etc. Showcasing this set of slides titled Breakeven Point Graph With Degree Of Operational Leverage Ppt Layouts Graphics Pictures PDF. The topics addressed in these templates are Total Sales, Net income, Total Costs, Total Variables Costs. All the content presented in this PPT design is completely editable. Download it and make adjustments in color, background, font etc. as per your unique business setting.

6 Year Revenue Declining Graph Ppt PowerPoint Presentation Outline Sample PDF
This slide shows the revenues of the company over the last years to have a clear idea of organization growth and financial status . It includes the 6 year 2017 to 2022 revenue earned by the company.Showcasing this set of slides titled 6 Year Revenue Declining Graph Ppt PowerPoint Presentation Outline Sample PDF. The topics addressed in these templates are Revenue Company, Highest Comparison, Conditions Restrictions. All the content presented in this PPT design is completely editable. Download it and make adjustments in color, background, font etc. as per your unique business setting.
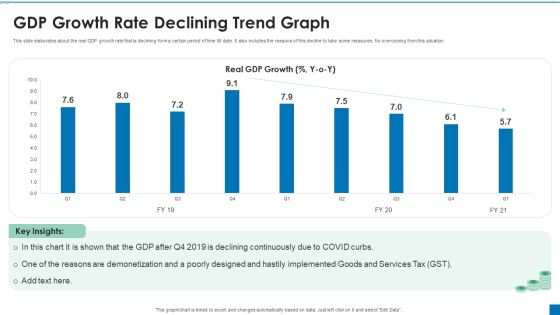
GDP Growth Rate Declining Trend Graph Ppt PowerPoint Presentation Slides Professional PDF
This slide elaborates about the real GDP growth rate that is declining form a certain period of time till date. It also includes the reasons of this decline to take some measures for overcoming from this situation. Showcasing this set of slides titled GDP Growth Rate Declining Trend Graph Ppt PowerPoint Presentation Slides Professional PDF. The topics addressed in these templates are Declining Continuously, Poorly Designed, Reasons Demonetization. All the content presented in this PPT design is completely editable. Download it and make adjustments in color, background, font etc. as per your unique business setting.

Chart Icon Illustrates Diminishing Graph And Chart Company Sales Professional PDF
Presenting Chart Icon Illustrates Diminishing Graph And Chart Company Sales Professional PDF to dispense important information. This template comprises four stages. It also presents valuable insights into the topics including Chart Icon Illustrates Diminishing, Graph Chart Company Sales. This is a completely customizable PowerPoint theme that can be put to use immediately. So, download it and address the topic impactfully.

Pie Chart For Business Graph PowerPoint Templates Ppt Backgrounds For Slides 0413
Drive your passion with our Pie Chart For Business Graph PowerPoint Templates PPT Backgrounds For Slides 0413. Steer yourself to achieve your aims. Drink from the fountain of our Pie Chart For Business Graph PowerPoint Templates PPT Backgrounds For Slides 0413. Refresh your audience with your bubbling ideas.

Financial R2R Icon With Graph And Chart Ppt PowerPoint Presentation Slides Design Inspiration PDF
Presenting Financial R2R Icon With Graph And Chart Ppt PowerPoint Presentation Slides Design Inspiration PDF to dispense important information. This template comprises three stages. It also presents valuable insights into the topics including Financial R2r Icon, Graph Chart. This is a completely customizable PowerPoint theme that can be put to use immediately. So, download it and address the topic impactfully.

5S Methodology Slide For Graph Visualization Tools Ppt PowerPoint Presentation Summary Graphics Template PDF
Presenting 5s methodology slide for graph visualization tools ppt powerpoint presentation summary graphics template pdf to dispense important information. This template comprises five stages. It also presents valuable insights into the topics including 5s methodology for graph visualization tools. This is a completely customizable PowerPoint theme that can be put to use immediately. So, download it and address the topic impactfully.

Colorful Pie Business Graph Marketing PowerPoint Templates Ppt Backgrounds For Slides 0513
Establish your dominion with our Colorful Pie Business Graph Marketing PowerPoint Templates PPT Backgrounds For Slides. Rule the stage with your thoughts. Your ideas demand attention. Our Leadership PowerPoint Templates will get it done.There is never a dull moment with our Colorful Pie Business Graph Marketing PowerPoint Templates Ppt Backgrounds For Slides 0513 PowerPoint Templates. They will keep the excitement at high pitch.

Data Outline Pie Graph Vector Icon Ppt PowerPoint Presentation Infographic Template Maker PDF
Showcasing this set of slides titled data outline pie graph vector icon ppt powerpoint presentation infographic template maker pdf. The topics addressed in these templates are data outline pie graph vector icon. All the content presented in this PPT design is completely editable. Download it and make adjustments in color, background, font etc. as per your unique business setting.
Vector Illustration Of Data Analyst With Pie Graph Ppt PowerPoint Presentation Infographic Template Information PDF
Showcasing this set of slides titled vector illustration of data analyst with pie graph ppt powerpoint presentation infographic template information pdf. The topics addressed in these templates are vector illustration of data analyst with pie graph. All the content presented in this PPT design is completely editable. Download it and make adjustments in color, background, font etc. as per your unique business setting.
Financial Loss Graph Vector Icon Ppt PowerPoint Presentation Infographic Template Layouts PDF
Presenting this set of slides with name financial loss graph vector icon ppt powerpoint presentation infographic template layouts pdf. This is a three stage process. The stages in this process are financial loss graph vector icon. This is a completely editable PowerPoint presentation and is available for immediate download. Download now and impress your audience.
Growth Graph In Magnifying Glass Vector Icon Ppt PowerPoint Presentation Model Graphics Template PDF
Presenting this set of slides with name growth graph in magnifying glass vector icon ppt powerpoint presentation model graphics template pdf. This is a three stage process. The stages in this process are growth graph in magnifying glass vector icon. This is a completely editable PowerPoint presentation and is available for immediate download. Download now and impress your audience.
Edit Graph With Pencil Vector Icon Ppt PowerPoint Presentation Infographic Template Graphics Download PDF
Presenting this set of slides with name edit graph with pencil vector icon ppt powerpoint presentation infographic template graphics download pdf. This is a three stage process. The stages in this process are edit graph with pencil vector icon. This is a completely editable PowerPoint presentation and is available for immediate download. Download now and impress your audience.
Workforce Downward Turnover Graph Vector Icon Ppt PowerPoint Presentation Icon Template PDF
Presenting this set of slides with name workforce downward turnover graph vector icon ppt powerpoint presentation icon template pdf. This is a three stage process. The stages in this process are workforce downward turnover graph vector icon. This is a completely editable PowerPoint presentation and is available for immediate download. Download now and impress your audience.

Company Process Improvement With Gear And Graph Icon Ppt PowerPoint Presentation Gallery Templates PDF
Presenting this set of slides with name company process improvement with gear and graph icon ppt powerpoint presentation gallery templates pdf. This is a three stage process. The stages in this process are company process improvement with gear and graph icon. This is a completely editable PowerPoint presentation and is available for immediate download. Download now and impress your audience.
Graph For Money Flow Assessment With Magnifying Glass Ppt PowerPoint Presentation Gallery Design Templates PDF
Presenting this set of slides with name graph for money flow assessment with magnifying glass ppt powerpoint presentation gallery design templates pdf. This is a three stage process. The stages in this process are graph for money flow assessment with magnifying glass. This is a completely editable PowerPoint presentation and is available for immediate download. Download now and impress your audience.

Business Meeting Icon With Sales Growth Graph Ppt PowerPoint Presentation Slides Template PDF
Presenting this set of slides with name business meeting icon with sales growth graph ppt powerpoint presentation slides template pdf. This is a three stage process. The stages in this process are business meeting icon with sales growth graph. This is a completely editable PowerPoint presentation and is available for immediate download. Download now and impress your audience.

Graph For Fluctuation In Business Cycle Ppt PowerPoint Presentation File Infographic Template PDF
Presenting this set of slides with name graph for fluctuation in business cycle ppt powerpoint presentation file infographic template pdf. This is a two stage process. The stages in this process are graph for fluctuation in business cycle. This is a completely editable PowerPoint presentation and is available for immediate download. Download now and impress your audience.
Downturn Graph Vector Icon With Text Holders Ppt PowerPoint Presentation Infographic Template Layout PDF
Pitch your topic with ease and precision using this downturn graph vector icon with text holders ppt powerpoint presentation infographic template layout pdf. This layout presents information on downturn graph vector icon with text holders. It is also available for immediate download and adjustment. So, changes can be made in the color, design, graphics or any other component to create a unique layout.
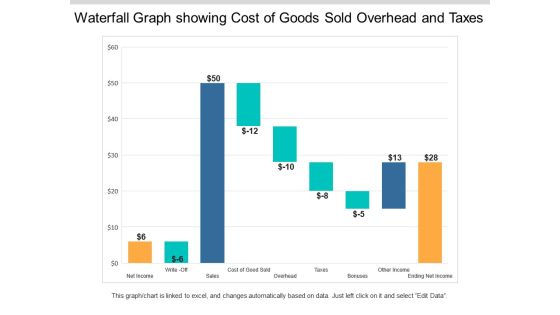
Waterfall Graph Showing Cost Of Goods Sold Overhead And Taxes Ppt PowerPoint Presentation Styles Example Topics
This is a waterfall graph showing cost of goods sold overhead and taxes ppt powerpoint presentation styles example topics. This is a three stage process. The stages in this process are profit and loss, balance sheet, income statement, benefit and loss.
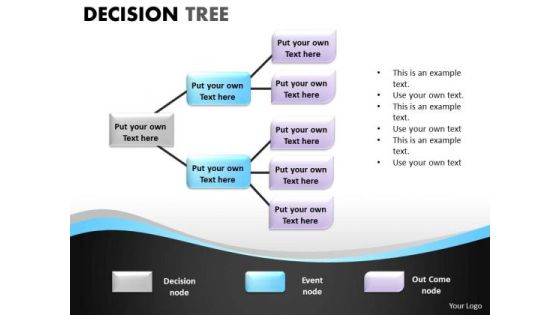
Business Finance Strategy Development Decision Tree Ppt Graph Mba Models And Frameworks
With Our Business Finance Strategy Development Decision Tree PPT graph MBA models and frameworks Powerpoint Templates You Will Be Doubly Sure. They Possess That Stamp Of Authority. Our Business Finance Strategy Development Decision Tree PPT graph MBA models and frameworks Powerpoint Templates Do It In Double Quick Time. Speed Up The Process In A Tangible Way.

Vector Showing Career Growth Graph Of Businessman Ppt PowerPoint Presentation File Background Designs PDF
Presenting vector showing career growth graph of businessman ppt powerpoint presentation file background designs pdf to dispense important information. This template comprises three stages. It also presents valuable insights into the topics including vector showing career growth graph of businessman. This is a completely customizable PowerPoint theme that can be put to use immediately. So, download it and address the topic impactfully.

Business Statistics Assessment Graph Icon Ppt PowerPoint Presentation Slides Background Images PDF
Presenting business statistics assessment graph icon ppt powerpoint presentation slides background images pdf to dispense important information. This template comprises three stages. It also presents valuable insights into the topics including business statistics assessment graph icon. This is a completely customizable PowerPoint theme that can be put to use immediately. So, download it and address the topic impactfully.
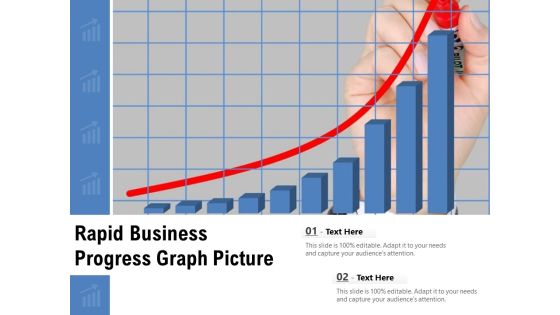
Rapid Business Progress Graph Picture Ppt PowerPoint Presentation Gallery File Formats PDF
Presenting rapid business progress graph picture ppt powerpoint presentation gallery file formats pdf to dispense important information. This template comprises two stages. It also presents valuable insights into the topics including rapid business progress graph picture. This is a completely customizable PowerPoint theme that can be put to use immediately. So, download it and address the topic impactfully.
Good Financial Position Shown With Graph Ppt PowerPoint Presentation Model Elements PDF
Presenting good financial position shown with graph ppt powerpoint presentation model elements pdf to dispense important information. This template comprises two stages. It also presents valuable insights into the topics including good financial position shown with graph. This is a completely customizable PowerPoint theme that can be put to use immediately. So, download it and address the topic impactfully.
Statistics Analysis Graph Vector Icon Ppt PowerPoint Presentation Professional Show PDF
Showcasing this set of slides titled statistics analysis graph vector icon ppt powerpoint presentation professional show pdf. The topics addressed in these templates are statistics analysis graph vector icon. All the content presented in this PPT design is completely editable. Download it and make adjustments in color, background, font etc. as per your unique business setting.

Businessman With Dollar Growth Graph Vector Icon Ppt PowerPoint Presentation File Clipart PDF
Presenting businessman with dollar growth graph vector icon ppt powerpoint presentation file clipart pdf to dispense important information. This template comprises three stages. It also presents valuable insights into the topics including businessman with dollar growth graph vector icon. This is a completely customizable PowerPoint theme that can be put to use immediately. So, download it and address the topic impactfully.
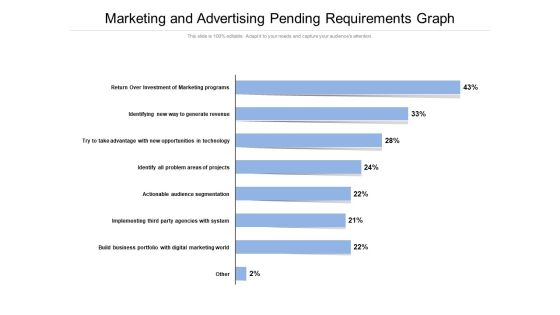
Marketing And Advertising Pending Requirements Graph Ppt PowerPoint Presentation File Shapes PDF
Showcasing this set of slides titled marketing and advertising pending requirements graph ppt powerpoint presentation file shapes pdf. The topics addressed in these templates are marketing and advertising pending requirements graph. All the content presented in this PPT design is completely editable. Download it and make adjustments in color, background, font etc. as per your unique business setting.

Competitive Assessment Graph Through Time Ppt PowerPoint Presentation Gallery Slide Portrait PDF
Showcasing this set of slides titled competitive assessment graph through time ppt powerpoint presentation gallery slide portrait pdf. The topics addressed in these templates are competitive assessment graph through time. All the content presented in this PPT design is completely editable. Download it and make adjustments in color, background, font etc. as per your unique business setting.
Dollar Graph For Sale Growth Ppt PowerPoint Presentation Gallery Example PDF
Presenting dollar graph for sale growth ppt powerpoint presentation gallery example pdf to dispense important information. This template comprises four stages. It also presents valuable insights into the topics including dollar graph for sale growth. This is a completely customizable PowerPoint theme that can be put to use immediately. So, download it and address the topic impactfully.
Gear With Graph For Role Objective Icon Ppt PowerPoint Presentation File Themes PDF
Presenting gear with graph for role objective icon ppt powerpoint presentation file themes pdf to dispense important information. This template comprises three stages. It also presents valuable insights into the topics including gear with graph for role objective icon. This is a completely customizable PowerPoint theme that can be put to use immediately. So, download it and address the topic impactfully.

Business Vision Shown Via Graph Vector Icon Ppt PowerPoint Presentation File Icon PDF
Presenting business vision shown via graph vector icon ppt powerpoint presentation file icon pdf to dispense important information. This template comprises three stages. It also presents valuable insights into the topics including business vision shown via graph vector icon. This is a completely customizable PowerPoint theme that can be put to use immediately. So, download it and address the topic impactfully.

Business Progress Graph Analysis Icon Ppt PowerPoint Presentation Inspiration Styles PDF
Presenting business progress graph analysis icon ppt powerpoint presentation inspiration styles pdf to dispense important information. This template comprises four stages. It also presents valuable insights into the topics including business progress graph analysis icon. This is a completely customizable PowerPoint theme that can be put to use immediately. So, download it and address the topic impactfully.
Goal Vector Illustrating Target And Graph Icon Ppt PowerPoint Presentation Gallery Inspiration PDF
Presenting goal vector illustrating target and graph icon ppt powerpoint presentation gallery inspiration pdf to dispense important information. This template comprises four stages. It also presents valuable insights into the topics including goal vector illustrating target and graph icon. This is a completely customizable PowerPoint theme that can be put to use immediately. So, download it and address the topic impactfully.
Graph With Upward Arrow For Business Growth Icon Ppt PowerPoint Presentation Gallery Summary PDF
Presenting graph with upward arrow for business growth icon ppt powerpoint presentation gallery summary pdf to dispense important information. This template comprises three stages. It also presents valuable insights into the topics including graph with upward arrow for business growth icon. This is a completely customizable PowerPoint theme that can be put to use immediately. So, download it and address the topic impactfully.
Expense Framework With Coin And Pie Graph Vector Icon Ppt PowerPoint Presentation Infographics Maker PDF
Showcasing this set of slides titled expense framework with coin and pie graph vector icon ppt powerpoint presentation infographics maker pdf. The topics addressed in these templates are expense framework with coin pie graph vector icon. All the content presented in this PPT design is completely editable. Download it and make adjustments in color, background, font etc. as per your unique business setting.
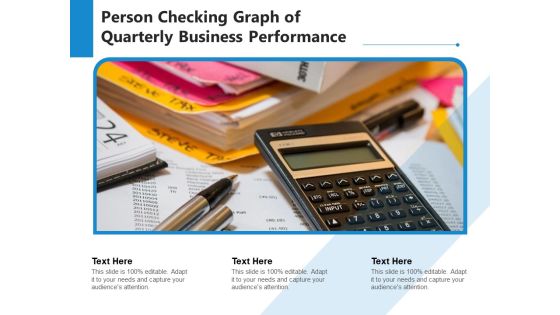
Person Checking Graph Of Quarterly Business Performance Ppt PowerPoint Presentation File Aids PDF
Presenting person checking graph of quarterly business performance ppt powerpoint presentation file aids pdf to dispense important information. This template comprises one stages. It also presents valuable insights into the topics including person checking graph of quarterly business performance. This is a completely customizable PowerPoint theme that can be put to use immediately. So, download it and address the topic impactfully.
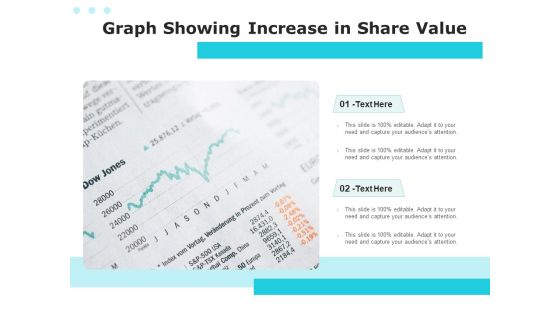
Graph Showing Increase In Share Value Ppt PowerPoint Presentation Backgrounds PDF
Presenting graph showing increase in share value ppt powerpoint presentation backgrounds pdf to dispense important information. This template comprises two stages. It also presents valuable insights into the topics including graph showing increase in share value. This is a completely customizable PowerPoint theme that can be put to use immediately. So, download it and address the topic impactfully.

Share Market Growth Graph Illustration Ppt PowerPoint Presentation Professional Examples PDF
Presenting share market growth graph illustration ppt powerpoint presentation professional examples pdf to dispense important information. This template comprises three stages. It also presents valuable insights into the topics including share market growth graph illustration. This is a completely customizable PowerPoint theme that can be put to use immediately. So, download it and address the topic impactfully.

Multiphase Information Technology Management Graph With Maturity Level Ppt PowerPoint Presentation File Ideas PDF
Showcasing this set of slides titled multiphase information technology management graph with maturity level ppt powerpoint presentation file ideas pd. The topics addressed in these templates are multiphase information technology management graph with maturity level. All the content presented in this PPT design is completely editable. Download it and make adjustments in color, background, font etc. as per your unique business setting.
Revenue Split Pie Graph Vector Icon Ppt PowerPoint Presentation Show Elements PDF
Showcasing this set of slides titled revenue split pie graph vector icon ppt powerpoint presentation show elements pdf. The topics addressed in these templates are revenue split pie graph vector icon. All the content presented in this PPT design is completely editable. Download it and make adjustments in color, background, font etc. as per your unique business setting.
Money Flow Liquidity Icon With Dollar Symbol And Graph Formats PDF
Presenting money flow liquidity icon with dollar symbol and graph formats pdf to dispense important information. This template comprises four stages. It also presents valuable insights into the topics including money flow liquidity icon with dollar symbol and graph. This is a completely customizable PowerPoint theme that can be put to use immediately. So, download it and address the topic impactfully.
Project Management Plan Icon With Graph And Gear Symbol Guidelines PDF
Presenting Project Management Plan Icon With Graph And Gear Symbol Guidelines PDF to dispense important information. This template comprises four stages. It also presents valuable insights into the topics including Project Management Plan Icon With Graph And Gear Symbol. This is a completely customizable PowerPoint theme that can be put to use immediately. So, download it and address the topic impactfully.

Firm KPI Dashboard Icon With Graph And 3 Dots Ppt Professional Slide PDF
Presenting Firm KPI Dashboard Icon With Graph And 3 Dots Ppt Professional Slide PDF to dispense important information. This template comprises three stages. It also presents valuable insights into the topics including Firm KPI Dashboard, Icon With Graph, 3 Dots. This is a completely customizable PowerPoint theme that can be put to use immediately. So, download it and address the topic impactfully.

Employee Stepping On Journey Map Graph Icon Ppt Layouts Ideas PDF
Presenting Employee Stepping On Journey Map Graph Icon Ppt Layouts Ideas PDF to dispense important information. This template comprises four stages. It also presents valuable insights into the topics including Employee Stepping, Journey Map Graph, Icon. This is a completely customizable PowerPoint theme that can be put to use immediately. So, download it and address the topic impactfully.

Gap Assessment Icon With Statistics Graph Ppt PowerPoint Presentation Professional Information PDF
Showcasing this set of slides titled Gap Assessment Icon With Statistics Graph Ppt PowerPoint Presentation Professional Information PDF. The topics addressed in these templates are Gap Assessment, Icon Statistics Graph. All the content presented in this PPT design is completely editable. Download it and make adjustments in color, background, font etc. as per your unique business setting.
Enterprise Declining Graph Icon With Arrow Slide Ppt PowerPoint Presentation Portfolio Designs Download PDF
Showcasing this set of slides titled Enterprise Declining Graph Icon With Arrow Slide Ppt PowerPoint Presentation Portfolio Designs Download PDF. The topics addressed in these templates are Enterprise Declining, Graph Icon Arrow. All the content presented in this PPT design is completely editable. Download it and make adjustments in color, background, font etc. as per your unique business setting.
Human Resource Graph Icon For Employee Hiring And Recruitment Formats PDF
Presenting Human Resource Graph Icon For Employee Hiring And Recruitment Formats PDF to dispense important information. This template comprises three stages. It also presents valuable insights into the topics including Employee Hiring, Human Resource Graph, Recruitment. This is a completely customizable PowerPoint theme that can be put to use immediately. So, download it and address the topic impactfully.

Landing Page Search Engine Optimization Growth And Ranking Graph Icon Designs PDF
Presenting Landing Page Search Engine Optimization Growth And Ranking Graph Icon Designs PDF to dispense important information. This template comprises three stages. It also presents valuable insights into the topics including Landing Page, Search Engine, Optimization Growth, Ranking Graph, Icon. This is a completely customizable PowerPoint theme that can be put to use immediately. So, download it and address the topic impactfully.

Competitor Price Analysis Icon With Vision And Graph Symbol Structure PDF
Presenting Competitor Price Analysis Icon With Vision And Graph Symbol Structure PDF to dispense important information. This template comprises Three stages. It also presents valuable insights into the topics including Price Analysis Icon, Vision And Graph. This is a completely customizable PowerPoint theme that can be put to use immediately. So, download it and address the topic impactfully.

Computer Tablet With Graph Business PowerPoint Templates And PowerPoint Themes 1012
Computer Tablet With Graph Business PowerPoint Templates And PowerPoint Themes 1012-Develop competitive advantage with our above template which contains a diagram of computer tablet with bra graph showing success and growth. It portrays the concept of account, balance, business, data, economy, finance, graph, growth, information, investment, market, profit, report, research, statistics and success. Adjust the above image in your PPT presentations to visually support your content in your Business and Financial PPT slideshows. Present your views using our innovative slides and be assured of leaving a lasting impression.-Computer Tablet With Graph Business PowerPoint Templates And PowerPoint Themes 1012-This PowerPoint template can be used for presentations relating to-Computer Tablet With Graph, Arrows, Finance, Business, Marketing, Symbol

Yearly Net Income Statement Graph With Revenue And Operating Profit Margin Download PDF
This slide showcases chart that can help organization compare and analyze the operating profits generated by organization in different financial years. It also showcases yearly comparison of net income, revenue and operating profit margin. Pitch your topic with ease and precision using this Yearly Net Income Statement Graph With Revenue And Operating Profit Margin Download PDF. This layout presents information on Revenue, Net Income, Operating Profit Margin. It is also available for immediate download and adjustment. So, changes can be made in the color, design, graphics or any other component to create a unique layout.

Customers Declining Graph In Offline Store Ppt PowerPoint Presentation Professional Clipart PDF
This slide contains the information related to the number of numbers that are shifting form in-store purchasing to online shopping because of some factors. Pitch your topic with ease and precision using this Customers Declining Graph In Offline Store Ppt PowerPoint Presentation Professional Clipart PDF. This layout presents information on Customers Choosing, Store Purchase, Time Saving. It is also available for immediate download and adjustment. So, changes can be made in the color, design, graphics or any other component to create a unique layout.
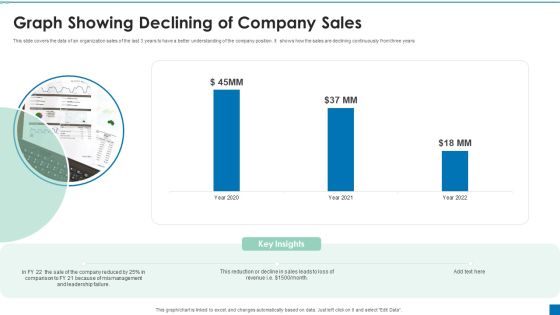
Graph Showing Declining Of Company Sales Ppt PowerPoint Presentation Portfolio Graphics Example PDF
This slide covers the data of an organization sales of the last 3 years to have a better understanding of the company position. It shows how the sales are declining continuously from three years.Pitch your topic with ease and precision using this Graph Showing Declining Of Company Sales Ppt PowerPoint Presentation Portfolio Graphics Example PDF. This layout presents information on Reduction Decline, Comparison, Mismanagement. It is also available for immediate download and adjustment. So, changes can be made in the color, design, graphics or any other component to create a unique layout.

Organic Page Reach Declining Graph With Stock Prices Ppt PowerPoint Presentation Ideas Styles PDF
This slide covers the information related to the share price and organic page reach of an organization to check the position of its working and to have records of them.Pitch your topic with ease and precision using this Organic Page Reach Declining Graph With Stock Prices Ppt PowerPoint Presentation Ideas Styles PDF. This layout presents information on Increasing High, Reach Declining, Supply Market. It is also available for immediate download and adjustment. So, changes can be made in the color, design, graphics or any other component to create a unique layout.

Technology Companies Market Cap Declining Graph Ppt PowerPoint Presentation File Smartart PDF
This slide shows the multiple companies capital that is invested by them in the market for making profits and advancing the technologies. It shows the decline of their capital amount in the following month. Pitch your topic with ease and precision using this Technology Companies Market Cap Declining Graph Ppt PowerPoint Presentation File Smartart PDF. This layout presents information on Overall Decline, Companies Low, Incurred Mor. It is also available for immediate download and adjustment. So, changes can be made in the color, design, graphics or any other component to create a unique layout.

Annual Staff Productivity Enhancement Graph Ppt PowerPoint Presentation Styles Aids PDF
This slide can be used to show improvement in employee productivity over past four years. The main reason for productivity improvement is the managerial and organizational support provided to employees. Pitch your topic with ease and precision using this Annual Staff Productivity Enhancement Graph Ppt PowerPoint Presentation Styles Aids PDF. This layout presents information on Employee Productivity, Improved Last, Due Continuous. It is also available for immediate download and adjustment. So, changes can be made in the color, design, graphics or any other component to create a unique layout.
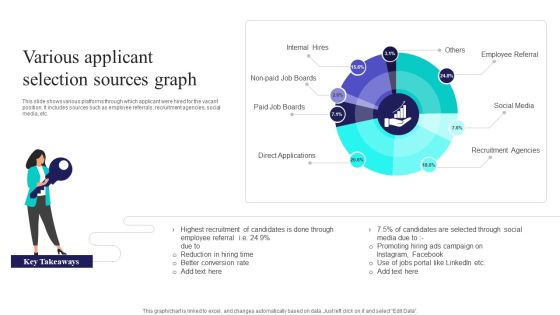
Various Applicant Selection Sources Graph Ppt PowerPoint Presentation Gallery Slide Download PDF
This slide shows various platforms through which applicant were hired for the vacant position. It includes sources such as employee referrals, recruitment agencies, social media, etc. Pitch your topic with ease and precision using this Various Applicant Selection Sources Graph Ppt PowerPoint Presentation Gallery Slide Download PDF. This layout presents information on Internal Hires, Paid Job Boards, Direct Applications. It is also available for immediate download and adjustment. So, changes can be made in the color, design, graphics or any other component to create a unique layout.

Monthly Financial Metrics Graph With Operating Profit And Cost Of Goods Sold Pictures PDF
This slide showcases monthly analytics for to keep company finances organized and identify problem areas. It further includes details about marketing, professional fees, COGS and other operations. Pitch your topic with ease and precision using this Monthly Financial Metrics Graph With Operating Profit And Cost Of Goods Sold Pictures PDF. This layout presents information on Key Insights, Operating Profit, Total Revenue. It is also available for immediate download and adjustment. So, changes can be made in the color, design, graphics or any other component to create a unique layout.

Business Man With Graph Made Of Puzzle Pieces Ppt PowerPoint Presentation Professional Clipart
This is a business man with graph made of puzzle pieces ppt powerpoint presentation professional clipart. This is a four stage process. The stages in this process are puzzle, business, growth, success, pieces.
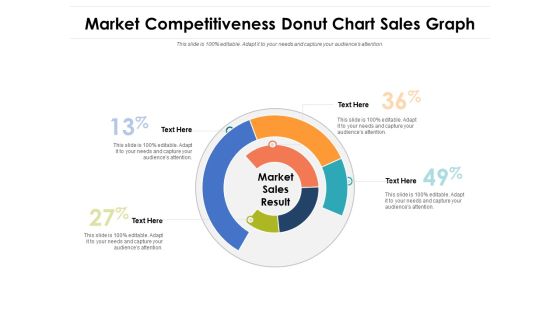
Market Competitiveness Donut Chart Sales Graph Ppt PowerPoint Presentation File Visual Aids PDF
Pitch your topic with ease and precision using this market competitiveness donut chart sales graph ppt powerpoint presentation file visual aids pdf. This layout presents information on market competitiveness donut chart sales graph. It is also available for immediate download and adjustment. So, changes can be made in the color, design, graphics or any other component to create a unique layout.

Budget Line Graph For Innovation Sprint In Safe Trends Diagrams PDF
This slide shows the line graph representing the budget and innovation sprint trends. It shows the average budget spent on innovation and the upcoming trends in the innovation sprint. Pitch your topic with ease and precision using this Budget Line Graph For Innovation Sprint In Safe Trends Diagrams PDF. This layout presents information on Budget Line Graph, For Innovation Sprint, In Safe Trends. It is also available for immediate download and adjustment. So, changes can be made in the color, design, graphics or any other component to create a unique layout.
Tracking Progress Of Project Management Tasks Ppt PowerPoint Presentation Diagram Graph Charts PDF
The following slide illustrates task management tool for tracking project status. It provides information about requirements, coding, development, knowledge, user acceptance testing, standup meeting, etc. Welcome to our selection of the Tracking Progress Of Project Management Tasks Ppt PowerPoint Presentation Diagram Graph Charts PDF. These are designed to help you showcase your creativity and bring your sphere to life. Planning and Innovation are essential for any business that is just starting out. This collection contains the designs that you need for your everyday presentations. All of our PowerPoints are 100 percent editable, so you can customize them to suit your needs. This multi purpose template can be used in various situations. Grab these presentation templates today.

Key Facebook Advertising Trends For 2023 Ppt PowerPoint Presentation Diagram Graph Charts PDF
This slide represents the latest and emerging trends in Facebook advertising for 2022. It includes details related to popular messaging apps used in US in 2022, increase in use of bots in Fb messenger etc. Welcome to our selection of the Key Facebook Advertising Trends For 2023 Ppt PowerPoint Presentation Diagram Graph Charts PDF. These are designed to help you showcase your creativity and bring your sphere to life. Planning and Innovation are essential for any business that is just starting out. This collection contains the designs that you need for your everyday presentations. All of our PowerPoints are 100 percent editable, so you can customize them to suit your needs. This multi purpose template can be used in various situations. Grab these presentation templates today.

Comparison Of Social Media Platforms To Run Online Ads Ppt PowerPoint Presentation Diagram Graph Charts PDF
This slide showcases comparative assessment of social media channels which can help marketers to identify ideal platform for running ad campaigns. Its key components are platform, worldwide users, user demographics, B2B and B2C Slidegeeks is here to make your presentations a breeze with Comparison Of Social Media Platforms To Run Online Ads Ppt PowerPoint Presentation Diagram Graph Charts PDF With our easy to use and customizable templates, you can focus on delivering your ideas rather than worrying about formatting. With a variety of designs to choose from, you are sure to find one that suits your needs. And with animations and unique photos, illustrations, and fonts, you can make your presentation pop. So whether you are giving a sales pitch or presenting to the board, make sure to check out Slidegeeks first.
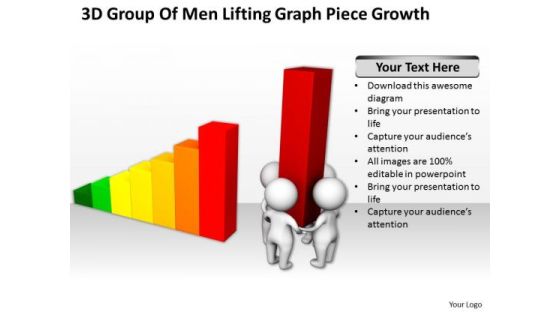
Business People Clipart 3d Group Of Men Lifting Graph Piece Growth PowerPoint Slides
We present our business people clipart 3d group of men lifting graph piece growth PowerPoint Slides.Download and present our Process and Flows PowerPoint Templates because You can Connect the dots. Fan expectations as the whole picture emerges. Use our Business PowerPoint Templates because you should Experience excellence with our PowerPoint Templates and Slides. They will take your breath away. Present our Marketing PowerPoint Templates because It can Leverage your style with our PowerPoint Templates and Slides. Charm your audience with your ability. Present our Shapes PowerPoint Templates because It will Strengthen your hand with your thoughts. They have all the aces you need to win the day. Use our Teamwork PowerPoint Templates because Your success is our commitment. Our PowerPoint Templates and Slides will ensure you reach your goal.Use these PowerPoint slides for presentations relating to 3d,achievement, altogether, bar, barchart, business, businessman,businesspeople, cartoon, character, chart, commerce, concept, economic,economy, finance, financial, goal, graph, growing, growth, guy, help, human,illustration, improvement, increase, investment, lifting, lost, male, manager,market, men, partnership, people, person, presentation, progress, raising, render,rising, statistic, strength, success, team, teamwork, work, worker. The prominent colors used in the PowerPoint template are Red, Yellow, Green.
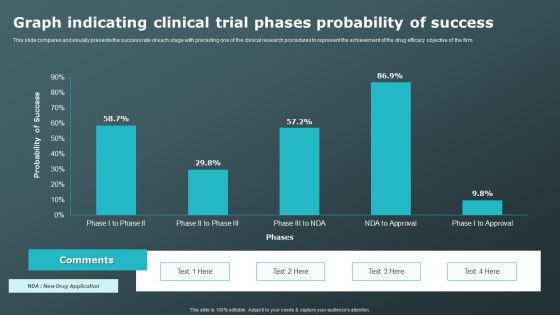
Graph Indicating Clinical Trial Phases Probability Of Success Clinical Research Trial Phases Professional PDF
This slide compares and visually presents the success rate of each stage with preceding one of the clinical research procedures to represent the achievement of the drug efficacy objective of the firm. Slidegeeks has constructed Graph Indicating Clinical Trial Phases Probability Of Success Clinical Research Trial Phases Professional PDF after conducting extensive research and examination. These presentation templates are constantly being generated and modified based on user preferences and critiques from editors. Here, you will find the most attractive templates for a range of purposes while taking into account ratings and remarks from users regarding the content. This is an excellent jumping-off point to explore our content and will give new users an insight into our top-notch PowerPoint Templates.
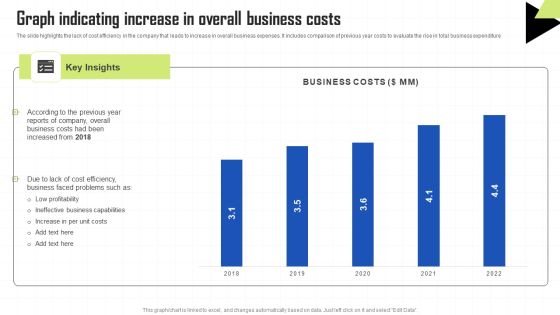
Key Techniques To Enhance Cost Efficiency Graph Indicating Increase In Overall Business Costs Structure PDF
The slide highlights the lack of cost efficiency in the company that leads to increase in overall business expenses. It includes comparison of previous year costs to evaluate the rise in total business expenditure Welcome to our selection of the Key Techniques To Enhance Cost Efficiency Graph Indicating Increase In Overall Business Costs Structure PDF. These are designed to help you showcase your creativity and bring your sphere to life. Planning and Innovation are essential for any business that is just starting out. This collection contains the designs that you need for your everyday presentations. All of our PowerPoints are 100 percent editable, so you can customize them to suit your needs. This multi purpose template can be used in various situations. Grab these presentation templates today.

Contrast Circle Graph Comparison Circular Shape Ppt PowerPoint Presentation Complete Deck
If designing a presentation takes a lot of your time and resources and you are looking for a better alternative, then this contrast circle graph comparison circular shape ppt powerpoint presentation complete deck is the right fit for you. This is a prefabricated set that can help you deliver a great presentation on the topic. All the ten slides included in this sample template can be used to present a birds-eye view of the topic. These slides are also fully editable, giving you enough freedom to add specific details to make this layout more suited to your business setting. Apart from the content, all other elements like color, design, theme are also replaceable and editable. This helps in designing a variety of presentations with a single layout. Not only this, you can use this PPT design in formats like PDF, PNG, and JPG once downloaded. Therefore, without any further ado, download and utilize this sample presentation as per your liking.

Graph Highlighting Cost Involved In Multiple Clinical Trial Phases Clinical Research Trial Phases Infographics PDF
This slide visually represents the money spent in each phase of the clinical trial procedure to check the safety and efficacy of the newly developed drug. Retrieve professionally designed Graph Highlighting Cost Involved In Multiple Clinical Trial Phases Clinical Research Trial Phases Infographics PDF to effectively convey your message and captivate your listeners. Save time by selecting pre-made slideshows that are appropriate for various topics, from business to educational purposes. These themes come in many different styles, from creative to corporate, and all of them are easily adjustable and can be edited quickly. Access them as PowerPoint templates or as Google Slides themes. You do not have to go on a hunt for the perfect presentation because Slidegeeks got you covered from everywhere.
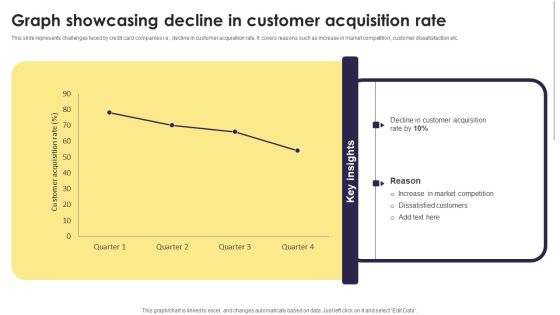
Implementation Of An Efficient Credit Card Promotion Plan Graph Showcasing Decline In Customer Themes PDF
This slide represents challenges faced by credit card companies i.e., decline in customer acquisition rate. It covers reasons such as increase in market competition, customer dissatisfaction etc. Are you in need of a template that can accommodate all of your creative concepts This one is crafted professionally and can be altered to fit any style. Use it with Google Slides or PowerPoint. Include striking photographs, symbols, depictions, and other visuals. Fill, move around, or remove text boxes as desired. Test out color palettes and font mixtures. Edit and save your work, or work with colleagues. Download Implementation Of An Efficient Credit Card Promotion Plan Graph Showcasing Decline In Customer Themes PDF and observe how to make your presentation outstanding. Give an impeccable presentation to your group and make your presentation unforgettable.
Dollar Graph Growth Arrow Business PowerPoint Templates And PowerPoint Themes 1012
Dollar Graph Growth Arrow Business PowerPoint Templates And PowerPoint Themes 1012-This PowerPoint Template shows the Boosting up Arrow with the Dollar Currency and a man holding dollar in his hand. This PowerPoint Template signifies the concept of Finance, Profit, Loss, money, economics, business, investment, backing, sponsorship, funding etc. Colors generate instant reactions in our brains. Use them to your advantage to prioritize your ideas.-Dollar Graph Growth Arrow Business PowerPoint Templates And PowerPoint Themes 1012-This PowerPoint template can be used for presentations relating to-Dollar graph growth arrow, finance, marketing, success, business, symbol

Information Technology Expenditure Summary Dashboard Ppt PowerPoint Presentation Diagram Graph Charts PDF
The following slide showcases the cyber security expense overview to better allocate budget. It includes elements such as IT cost, revenue, security incidents, services down, issue status summary, total business hours lost etc. This Information Technology Expenditure Summary Dashboard Ppt PowerPoint Presentation Diagram Graph Charts PDF from Slidegeeks makes it easy to present information on your topic with precision. It provides customization options, so you can make changes to the colors, design, graphics, or any other component to create a unique layout. It is also available for immediate download, so you can begin using it right away. Slidegeeks has done good research to ensure that you have everything you need to make your presentation stand out. Make a name out there for a brilliant performance.
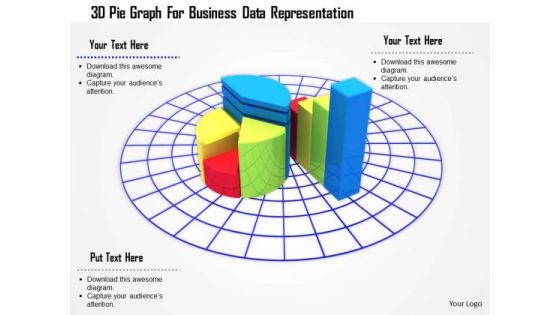
Stock Photo 3d Pie Graph For Business Data Representation PowerPoint Slide
3D business graph has been used to design this PowerPoint template. This Image slide is suitable to make business reports and charts. This slide can be used for business and marketing presentations.
Proportional Controller Graph Ppt PowerPoint Presentation Infographic Template Sample Cpb Pdf
Presenting this set of slides with name proportional controller graph ppt powerpoint presentation infographic template sample cpb pdf. This is an editable Powerpoint six stages graphic that deals with topics like proportional controller graph to help convey your message better graphically. This product is a premium product available for immediate download and is 100 percent editable in Powerpoint. Download this now and use it in your presentations to impress your audience.

Business Development Strategy Template 3d Man On The Top Of Graph Concept
Get The Doers Into Action. Activate Them With Our Business Development Strategy Template 3d Man On The Top Of Graph Concept Powerpoint Templates. Put Your Money On Our Arrows Powerpoint Templates. Your Ideas Will Rake In The Dollars.

Business Diagram Key Shaped Pie Graph For Result Display Presentation Template
Key shaped pie graph has been used to design this business diagram. This slide has key graphic with abcd options. Use this amazing slide to present a business plan. Download this slide to impress your viewers.

Timeline For Application Development Design Implement And Release Ppt PowerPoint Presentation Diagram Graph Charts
This is a timeline for application development design implement and release ppt powerpoint presentation diagram graph charts. This is a five stage process. The stages in this process are overlapping timeline, overlapping roadmap, overlapping linear roadmap.

Business People Walking 3d Men On Top Of Graph PowerPoint Templates
We present our business people walking 3d men on top of graph PowerPoint templates.Download and present our Business PowerPoint Templates because our PowerPoint Templates and Slides are a looking glass. Train them on the magnificent future you have in mind. Download our People PowerPoint Templates because Our PowerPoint Templates and Slides will Activate the energies of your audience. Get their creative juices flowing with your words. Download our Flow Chart PowerPoint Templates because Our PowerPoint Templates and Slides will provide weight to your words. They will bring out the depth of your thought process. Present our Shapes PowerPoint Templates because You can Hit a home run with our PowerPoint Templates and Slides. See your ideas sail into the minds of your audience. Download and present our Future PowerPoint Templates because you should once Tap the ingenuity of our PowerPoint Templates and Slides. They are programmed to succeed.Use these PowerPoint slides for presentations relating to 3d, abstract, agreement, art, background, bank, banking, bargraph, business,businessman, cartoon, cash, cg, cgi, character, concept, conceptual, contract,deal, figure, finance, financial, growth, guy, handshake, human, humanoid, icon,illustration, man, market, money, partnership, person, presentation, render, stylized, success, suit, symbolic, tie. The prominent colors used in the PowerPoint template are White, Yellow, Red. We assure you our business people walking 3d men on top of graph PowerPoint templates will make you look like a winner. You can be sure our banking PowerPoint templates and PPT Slides help you meet deadlines which are an element of today's workplace. Just browse and pick the slides that appeal to your intuitive senses. Use our business people walking 3d men on top of graph PowerPoint templates are readymade to fit into any presentation structure. We assure you our background PowerPoint templates and PPT Slides are readymade to fit into any presentation structure. Use our business people walking 3d men on top of graph PowerPoint templates are aesthetically designed to attract attention. We guarantee that they will grab all the eyeballs you need. Professionals tell us our banking PowerPoint templates and PPT Slides are specially created by a professional team with vast experience. They diligently strive to come up with the right vehicle for your brilliant Ideas.
Perfect Competition Graph Ppt PowerPoint Presentation Icon Design Templates Cpb Pdf
Presenting this set of slides with name perfect competition graph ppt powerpoint presentation icon design templates cpb pdf. This is an editable Powerpoint five stages graphic that deals with topics like perfect competition graph to help convey your message better graphically. This product is a premium product available for immediate download and is 100 percent editable in Powerpoint. Download this now and use it in your presentations to impress your audience.
Graph Icon For Quick And Current Liquidity Ratio Analysis Template PDF
Persuade your audience using this Graph Icon For Quick And Current Liquidity Ratio Analysis Template PDF. This PPT design covers Three stages, thus making it a great tool to use. It also caters to a variety of topics including Graph Icon, Quick And Current, Liquidity Ratio Analysis. Download this PPT design now to present a convincing pitch that not only emphasizes the topic but also showcases your presentation skills.

Growth Graph Success Business PowerPoint Templates Ppt Backgrounds For Slides 1212
We present our Growth Graph Success Business PowerPoint Templates PPT Backgrounds For Slides 1212.Download our Business PowerPoint Templates because like the famed William Tell, they put aside all emotions and concentrate on the target. Use our Success PowerPoint Templates because firing the arrows to emblazon the desired path will let you achieve anticipated results. Use our Finance PowerPoint Templates because this diagram helps you to explain your strategy to co-ordinate activities of these seperate groups. Present our Marketing PowerPoint Templates because our presentation designs are for those on the go. Download and present our Leadership PowerPoint Templates because you can Unravel the desired and essential elements of your overall strategy.Use these PowerPoint slides for presentations relating to Business growth graph, business, success, finance, marketing, leadership. The prominent colors used in the PowerPoint template are Blue, Gray, White. Professionals tell us our Growth Graph Success Business PowerPoint Templates PPT Backgrounds For Slides 1212 are Dazzling. Use our business PowerPoint templates and PPT Slides are One-of-a-kind. We assure you our Growth Graph Success Business PowerPoint Templates PPT Backgrounds For Slides 1212 are Liberated. We assure you our graph PowerPoint templates and PPT Slides are the best it can get when it comes to presenting. Presenters tell us our Growth Graph Success Business PowerPoint Templates PPT Backgrounds For Slides 1212 are Fancy. PowerPoint presentation experts tell us our success PowerPoint templates and PPT Slides are Amazing.

3d Growth Graph Finance Business PowerPoint Templates Ppt Backgrounds For Slides 1212
We present our 3d Growth Graph Finance Business PowerPoint Templates PPT Backgrounds For Slides 1212.Use our Finance PowerPoint Templates because you have the ideas, you have got a brainwave. Use our Business PowerPoint Templates because you are sure you have the right people for your plans. Download our Marketing PowerPoint Templates because customer satisfaction is a mantra of the marketplace. Building a loyal client base is an essential element of your business. Use our Success PowerPoint Templates because you have the right arrows in your quiver. Present our New year PowerPoint Templates because you have the right attitude and great ideas to chart the way in the new year.Use these PowerPoint slides for presentations relating to Financial stat chart business graph, finance, business, new year, success, marketing. The prominent colors used in the PowerPoint template are Blue light, Green, Gray. We assure you our 3d Growth Graph Finance Business PowerPoint Templates PPT Backgrounds For Slides 1212 are Lush. Customers tell us our business PowerPoint templates and PPT Slides are Splendid. Customers tell us our 3d Growth Graph Finance Business PowerPoint Templates PPT Backgrounds For Slides 1212 are Sparkling. The feedback we get is that our graph PowerPoint templates and PPT Slides are second to none. PowerPoint presentation experts tell us our 3d Growth Graph Finance Business PowerPoint Templates PPT Backgrounds For Slides 1212 are Excellent. PowerPoint presentation experts tell us our business PowerPoint templates and PPT Slides are Functional.

Smart Grid Architectural Framework Information And Communication Technology Ppt Powerpoint Presentation Diagram Graph Charts
This is a smart grid architectural framework information and communication technology ppt powerpoint presentation diagram graph charts. This is a three stage process. The stages in this process are functional architecture, functional planning, functional designing.

Ppt Arrow Circle Insert Default Graph Chart PowerPoint 2003 5 Stages Templates
PPT arrow circle insert default graph chart powerpoint 2003 5 stages Templates-This PowerPoint Diagram shows you Inter-connected Layers using Arrows in Horizontal Line which signifies step by step Execution, inter-related approaches etc. You can change color, size and orientation of any icon to your liking.-PPT arrow circle insert default graph chart powerpoint 2003 5 stages Templates-Arrow, Art, Background, Beautiful, Bright, Business, Circle, Collection, Color, Colorful, Concentric, Concept, Connection, Contrast, Creative, Decoration, Design, Effect, Element, Graphic, Green, Group, Icon, Illustration, Image, Isolated, Light, Pattern, Pie, Red, Render, Round, Sample, Shape, Solution, Style, Success, Symbol, Technology, Wheel, White, Yellow
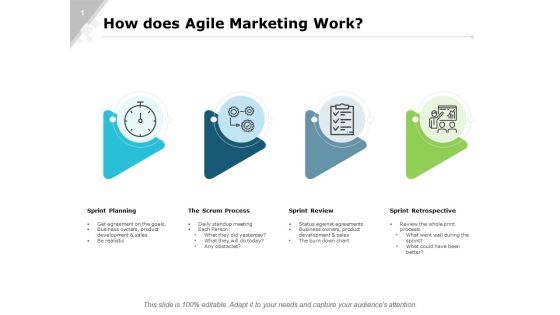
How Does Agile Marketing Work Ppt PowerPoint Presentation Diagram Graph Charts
This is a how does agile marketing work ppt powerpoint presentation diagram graph charts. This is a four stage process. The stages in this process are business, planning, strategy, marketing, management.

 Home
Home