Bar Graph

Doughnut Graph Depicting ROI From Multiple Marketing Activities Rules PDF
This graph or chart is linked to excel, and changes automatically based on data. Just left click on it and select Edit Data. Pitch your topic with ease and precision using this Doughnut Graph Depicting ROI From Multiple Marketing Activities Rules PDF. This layout presents information on Total ROI, Field Campaigns, Print Media, Display Ads. It is also available for immediate download and adjustment. So, changes can be made in the color, design, graphics or any other component to create a unique layout.
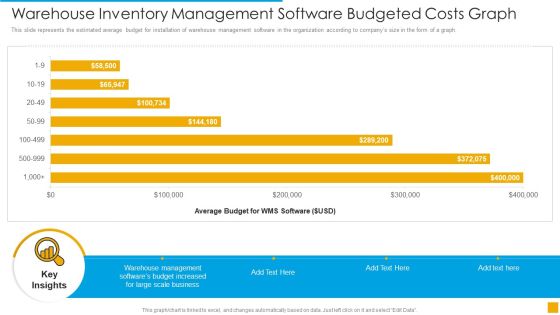
Warehouse Inventory Management Software Budgeted Costs Graph Demonstration PDF
This slide represents the estimated average budget for installation of warehouse management software in the organization according to companys size in the form of a graph Pitch your topic with ease and precision using this Warehouse Inventory Management Software Budgeted Costs Graph Demonstration PDF. This layout presents information on Management, Budget, Average. It is also available for immediate download and adjustment. So, changes can be made in the color, design, graphics or any other component to create a unique layout.

Sales Departmental Goals Achievement Graph Ppt Inspiration Slide Download PDF
This slide illustrates graphical representation of achievement percentage of each team member. It includes achievement percent, name, due date and target of respective member. Pitch your topic with ease and precision using this Sales Departmental Goals Achievement Graph Ppt Inspiration Slide Download PDF. This layout presents information on Sales Departmental, Goals, Achievement Graph. It is also available for immediate download and adjustment. So, changes can be made in the color, design, graphics or any other component to create a unique layout.

Annual Graph For Human Resource Recruitment Trends Summary PDF
The slide shows the HR recruitment trend graph from year 2018 to 2022. It includes number of employees hired per year along with key takeaways. Pitch your topic with ease and precision using this Annual Graph For Human Resource Recruitment Trends Summary PDF. This layout presents information on Employee Recruitment, Rise Employee, Economic Reforms. It is also available for immediate download and adjustment. So, changes can be made in the color, design, graphics or any other component to create a unique layout.

Distributed Network Graph Algorithm Ppt Powerpoint Presentation Outline Master Slide
This is a distributed network graph algorithm ppt powerpoint presentation outline master slide. This is a four stage process. The stages in this process are scatter plot, probability plots, plot diagram.

Product Life Cycle Graph Powerpoint Slide Background Image
This is a product life cycle graph powerpoint slide background image. This is a four stage process. The stages in this process are introduction, growth, maturity, decline.

Retail B2C Ecommerce Selling Forecasts Graph Portrait PDF
This slide depicts sales projections for both retail and ecommerce stores. It includes sales projections for brick and mortar and retail ecommerce stores for period of six years. Pitch your topic with ease and precision using this Retail B2C Ecommerce Selling Forecasts Graph Portrait PDF. This layout presents information on Retail B2C Ecommerce, Selling Forecasts Graph. It is also available for immediate download and adjustment. So, changes can be made in the color, design, graphics or any other component to create a unique layout.

Blocks Graph Business PowerPoint Templates And PowerPoint Themes 0512
Microsoft Powerpoint Templates and Background with blocks-These templates can be used for presentations relating to-Blocks, marketing, business, shapes, success, finance-Blocks Graph Business PowerPoint Templates And PowerPoint Themes 0512
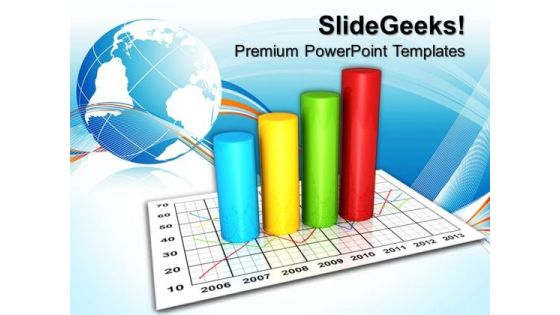
Products Sale Graph Business PowerPoint Templates And PowerPoint Themes 0812
Products Sale Graph Business PowerPoint Templates And PowerPoint Themes 0812-Microsoft Powerpoint Templates and Background with sales growth business chart
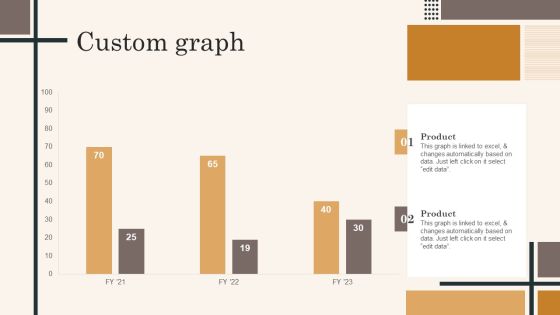
Edtech Service Launch And Promotion Plan Custom Graph Portrait PDF
Here you can discover an assortment of the finest PowerPoint and Google Slides templates. With these templates, you can create presentations for a variety of purposes while simultaneously providing your audience with an eye catching visual experience. Download Edtech Service Launch And Promotion Plan Custom Graph Portrait PDF to deliver an impeccable presentation. These templates will make your job of preparing presentations much quicker, yet still, maintain a high level of quality. Slidegeeks has experienced researchers who prepare these templates and write high quality content for you. Later on, you can personalize the content by editing the Edtech Service Launch And Promotion Plan Custom Graph Portrait PDF.
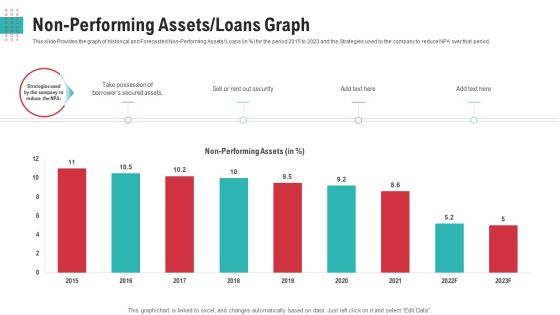
Non Performing Assets Loans Graph Ppt Model Slide Portrait
This slide Provides the graph of historical and Forecasted Non-Performing Assets Loans in persent for the period 2015 to 2023 and the Strategies used by the company to reduce NPA over that period.Deliver and pitch your topic in the best possible manner with this non performing assets loans graph ppt model slide portrait. Use them to share invaluable insights on non performing assets, 2015 to 2023 and impress your audience. This template can be altered and modified as per your expectations. So, grab it now.

Graph Indicating Clinical Trial Phases Probability Of Success Infographics PDF
This slide compares and visually presents the success rate of each stage with preceding one of the clinical research procedures to represent the achievement of the drug efficacy objective of the firm.Deliver and pitch your topic in the best possible manner with this Graph Indicating Clinical Trial Phases Probability Of Success Infographics PDF Use them to share invaluable insights on Graph Indicating Clinical Trial Phases Probability Of Success and impress your audience. This template can be altered and modified as per your expectations. So, grab it now.

Graph For Global Human Resource Employees Salary Trends Demonstration PDF
This slide showcases graph that can help to study the salary trends of HR employees and formulate compensation strategies according to industry standards. Its key components are minimum, average and maximum salary. Showcasing this set of slides titled Graph For Global Human Resource Employees Salary Trends Demonstration PDF. The topics addressed in these templates are Global Human Resource, Employees Salary Trends. All the content presented in this PPT design is completely editable. Download it and make adjustments in color, background, font etc. as per your unique business setting.
Percent Graph Marketing PowerPoint Templates And PowerPoint Themes 0512
Percent Graph Marketing PowerPoint Templates And PowerPoint Themes PPT designs-Microsoft Powerpoint Templates and Background with growing percents

Growing Percent Graph Success PowerPoint Templates And PowerPoint Themes 0612
Growing Percent Graph Success PowerPoint Templates And PowerPoint Themes Business-Microsoft Powerpoint Templates and Background with growing percents

Profit Graph Finance PowerPoint Templates And PowerPoint Themes 0612
Profit Graph Finance PowerPoint Templates And PowerPoint Themes Business-Microsoft Powerpoint Templates and Background with business success with arrow
Business Graph Marketing PowerPoint Templates And PowerPoint Themes 0612
Business Graph Marketing PowerPoint Templates And PowerPoint Themes PPT Slides-Microsoft Powerpoint Templates and Background with business success with arrow
Statistics Graph Business PowerPoint Templates And PowerPoint Themes 0612
Statistics Graph Business PowerPoint Templates And PowerPoint Themes Business PPT-Microsoft Powerpoint Templates and Background with colorful stats icon

Dollar Growth Graph Success PowerPoint Templates And PowerPoint Themes 0712
Dollar Growth Graph Success PowerPoint Templates And PowerPoint Themes 0712-Microsoft Powerpoint Templates and Background with dollar growth

Increasing Oil Prices Graph PowerPoint Templates And PowerPoint Themes 0912
Increasing Oil Prices Graph PowerPoint Templates And PowerPoint Themes 0912-Microsoft Powerpoint Templates and Background with oil barrels with increasing arrow

Career Graph Success PowerPoint Templates And PowerPoint Themes 0912
Career Graph Success PowerPoint Templates And PowerPoint Themes 0912-Microsoft Powerpoint Templates and Background with ladder of career

Business Success Graph PowerPoint Templates And PowerPoint Themes 1012
Business Success Graph PowerPoint Templates And PowerPoint Themes 1012-The PowerPoint Template shows the Growing Percentage Graph with each letter of Success on each step. This template portrays the concepts of winning, leadership, Finance, Success, competition, sports, business, shapes, people and abstract.-Business Success Graph PowerPoint Templates And PowerPoint Themes 1012-This PowerPoint template can be used for presentations relating to-Business graph showing growth, success, business, finance, marketing, stairs

Business Graph People PowerPoint Backgrounds And Templates 1210
Microsoft PowerPoint Template and Background with business graph with arrow going up and coin columns standing below
Recovery In Graph Success PowerPoint Templates And PowerPoint Backgrounds 0511
Microsoft PowerPoint Template and Background with an orange arrow moving upwards over the year 2011 business graph
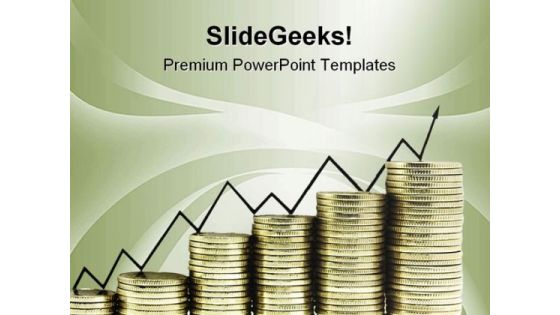
Business Graph Money PowerPoint Templates And PowerPoint Backgrounds 1011
Microsoft PowerPoint Template and Background with business graph with arrow going up and coin columns standing below

Business Framework Model Circular Procedure Graph Diagrams Marketing Diagram
Get The Doers Into Action. Activate Them With Our Business Framework Model Circular Procedure Graph Diagrams Marketing Diagram Powerpoint Templates.
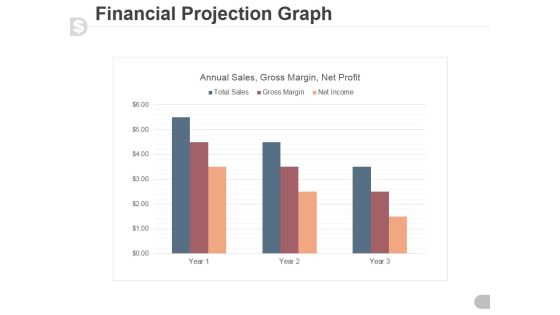
Financial Projection Graph Template 1 Ppt PowerPoint Presentation Guide
This is a financial projection graph template 1 ppt powerpoint presentation guide. This is a three stage process. The stages in this process are annual sales, gross margin, net profit.
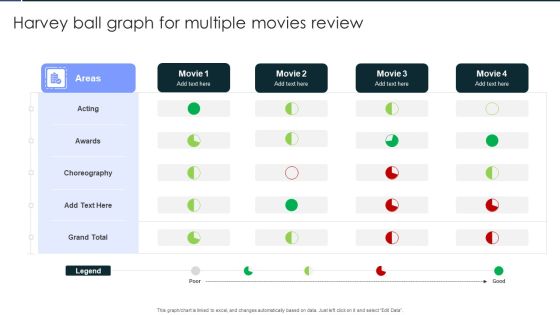
Harvey Ball Graph For Multiple Movies Review Template PDF
Showcasing this set of slides titled Harvey Ball Graph For Multiple Movies Review Template PDF. The topics addressed in these templates are Acting, Awards, Choreography. All the content presented in this PPT design is completely editable. Download it and make adjustments in color, background, font etc. as per your unique business setting.

Business Operations Assessment Company Sales Graph Ppt Portfolio Good PDF
Deliver an awe-inspiring pitch with this creative business operations assessment company sales graph ppt portfolio good pdf bundle. Topics like market value, sales volume can be discussed with this completely editable template. It is available for immediate download depending on the needs and requirements of the user.
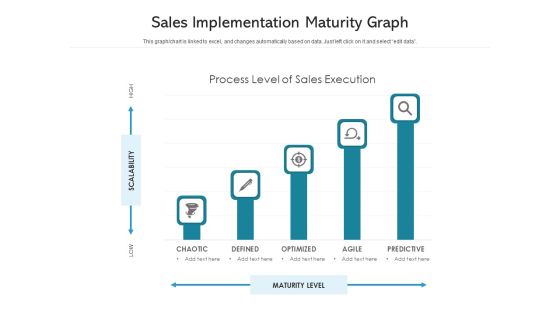
Sales Implementation Maturity Graph Ppt PowerPoint Presentation Inspiration Microsoft PDF
Showcasing this set of slides titled sales implementation maturity graph ppt powerpoint presentation inspiration microsoft pdf. The topics addressed in these templates are chaotic, defined, optimized, agile, predictive. All the content presented in this PPT design is completely editable. Download it and make adjustments in color, background, font etc. as per your unique business setting.

Administrative Regulation Company Sales Graph Ppt PowerPoint Presentation Outline PDF
Deliver an awe-inspiring pitch with this creative administrative regulation company sales graph ppt powerpoint presentation outline pdf bundle. Topics like market value, sales volume can be discussed with this completely editable template. It is available for immediate download depending on the needs and requirements of the user.

Corporate Regulation Company Sales Graph Ppt Infographics Backgrounds PDF
Deliver an awe inspiring pitch with this creative corporate regulation company sales graph ppt infographics backgrounds pdf bundle. Topics like sales, value, market can be discussed with this completely editable template. It is available for immediate download depending on the needs and requirements of the user.

Company Sales Graph Business Analysis Method Ppt Professional Visuals PDF
Deliver an awe inspiring pitch with this creative company sales graph business analysis method ppt professional visuals pdf bundle. Topics like market value, sales can be discussed with this completely editable template. It is available for immediate download depending on the needs and requirements of the user.
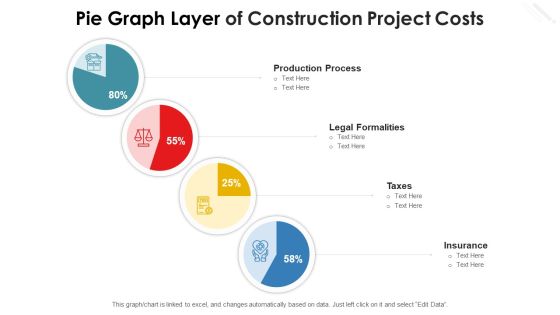
Pie Graph Layer Of Construction Project Costs Diagrams PDF
Showcasing this set of slides titled pie graph layer of construction project costs diagrams pdf. The topics addressed in these templates are production process, taxes, legal formalities, insurance. All the content presented in this PPT design is completely editable. Download it and make adjustments in color, background, font etc. as per your unique business setting.

Pie Graph Layer Presenting Departments Of Organization Infographics PDF
Showcasing this set of slides titled pie graph layer presenting departments of organization infographics pdf. The topics addressed in these templates are sales and marketing, production, manufacturing, research and development. All the content presented in this PPT design is completely editable. Download it and make adjustments in color, background, font etc. as per your unique business setting.

Pie Graph Layer Representing Employment Opportunities By Industry Ideas PDF
Showcasing this set of slides titled pie graph layer representing employment opportunities by industry ideas pdf. The topics addressed in these templates are hospitality, retail trade, manufacturing services, education and health services, professional and business services. All the content presented in this PPT design is completely editable. Download it and make adjustments in color, background, font etc. as per your unique business setting.
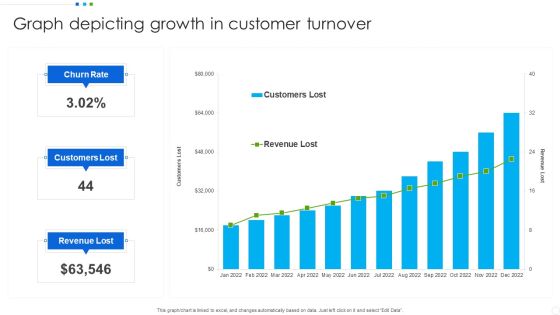
Graph Depicting Growth In Customer Turnover Infographics PDF
Showcasing this set of slides titled Graph Depicting Growth In Customer Turnover Infographics PDF. The topics addressed in these templates are Revenue Lost, Customers Lost, Churn Rate. All the content presented in this PPT design is completely editable. Download it and make adjustments in color, background, font etc. as per your unique business setting.

Product Performance Comparison Graph Showing Revenue Growth Portrait PDF
Showcasing this set of slides titled Product Performance Comparison Graph Showing Revenue Growth Portrait PDF. The topics addressed in these templates are Sales Revenue, Product. All the content presented in this PPT design is completely editable. Download it and make adjustments in color, background, font etc. as per your unique business setting.
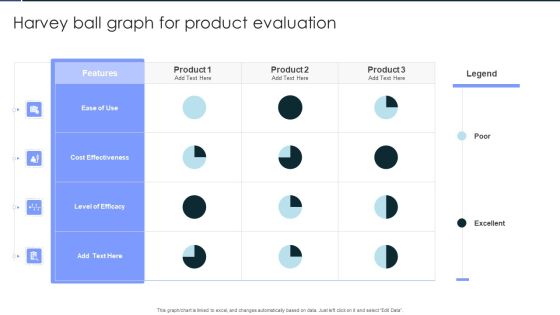
Harvey Ball Graph For Product Evaluation Microsoft PDF
Showcasing this set of slides titled Harvey Ball Graph For Product Evaluation Microsoft PDF. The topics addressed in these templates are Ease Of Use, Cost Effectiveness, Level Of Efficacy. All the content presented in this PPT design is completely editable. Download it and make adjustments in color, background, font etc. as per your unique business setting.
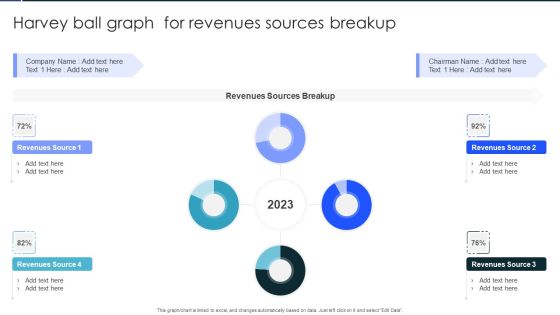
Harvey Ball Graph For Revenues Sources Breakup Infographics PDF
Showcasing this set of slides titled Harvey Ball Graph For Revenues Sources Breakup Infographics PDF. The topics addressed in these templates are Revenues Sources Breakup, Revenues, Sources Breakup. All the content presented in this PPT design is completely editable. Download it and make adjustments in color, background, font etc. as per your unique business setting.

Team Target And Procurement Analysis Graph Powerpoint Slide Deck Samples
This is a team target and procurement analysis graph powerpoint slide deck samples. This is a six stage process. The stages in this process are graph chart, business, success, strategy, management.
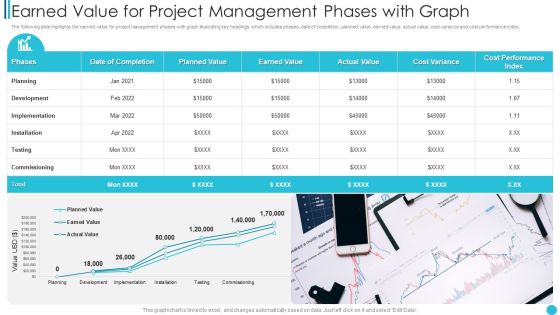
Earned Value For Project Management Phases With Graph Microsoft PDF
The following slide highlights the earned value for project management phases with graph illustrating key headings which includes phases, date of completion, planned value, earned value, actual value, cost variance and cost performance index.Pitch your topic with ease and precision using this Earned Value For Project Management Phases With Graph Microsoft PDF This layout presents information on Implementation, Installation, Commissioning It is also available for immediate download and adjustment. So, changes can be made in the color, design, graphics or any other component to create a unique layout.

Workforce Department Performance Graph Ppt Model Graphics Pictures PDF
This slide shows performance graph of HR department. Information covered in this slide is related to total hirings and turnover in the last four years. Pitch your topic with ease and precision using this Workforce Department Performance Graph Ppt Model Graphics Pictures PDF. This layout presents information on New Hiring, Continuous Increase, Employee Turnover, 2019 To 2022. It is also available for immediate download and adjustment. So, changes can be made in the color, design, graphics or any other component to create a unique layout.
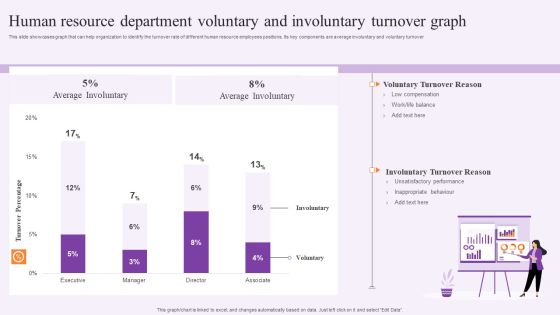
Human Resource Department Voluntary And Involuntary Turnover Graph Summary PDF
This slide showcases graph that can help organization to identify the turnover rate of different human resource employees positions. Its key components are average involuntary and voluntary turnover. Pitch your topic with ease and precision using this Human Resource Department Voluntary And Involuntary Turnover Graph Summary PDF. This layout presents information on Executive, Voluntary Turnover Reason, Average Involuntary. It is also available for immediate download and adjustment. So, changes can be made in the color, design, graphics or any other component to create a unique layout.

Graph Showing Total Operation Expenses By Quarter Themes PDF
This slide contains a graph showing the quarter wise operating expenses of an organization that will help the managers or directors of the company to make decisions for the betterment of an organization.Pitch your topic with ease and precision using this Graph Showing Total Operation Expenses By Quarter Themes PDF. This layout presents information on Operating Expenses, Equipment Purchase, Office Expansion. It is also available for immediate download and adjustment. So, changes can be made in the color, design, graphics or any other component to create a unique layout.
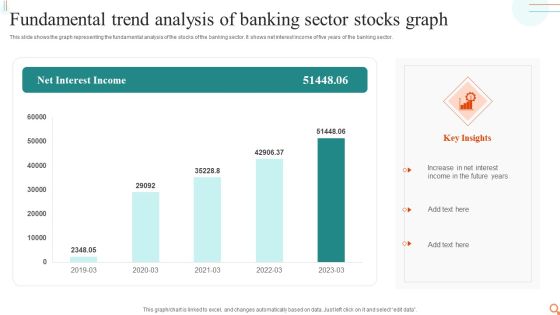
Fundamental Trend Analysis Of Banking Sector Stocks Graph Mockup PDF
This slide shows the graph representing the fundamental analysis of the stocks of the banking sector. It shows net interest income of five years of the banking sector.Pitch your topic with ease and precision using this Fundamental Trend Analysis Of Banking Sector Stocks Graph Mockup PDF. This layout presents information on Increase Interest, Income Future, Interest Income. It is also available for immediate download and adjustment. So, changes can be made in the color, design, graphics or any other component to create a unique layout.
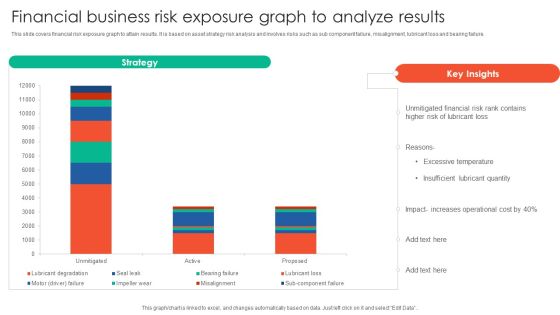
Financial Business Risk Exposure Graph To Analyze Results Elements PDF
This slide covers financial risk exposure graph to attain results. It is based on asset strategy risk analysis and involves risks such as sub component failure, misalignment, lubricant loss and bearing failure. Pitch your topic with ease and precision using this Financial Business Risk Exposure Graph To Analyze Results Elements PDF. This layout presents information on Strategy, Unmitigated Financial, Risk Rank Contains. It is also available for immediate download and adjustment. So, changes can be made in the color, design, graphics or any other component to create a unique layout.
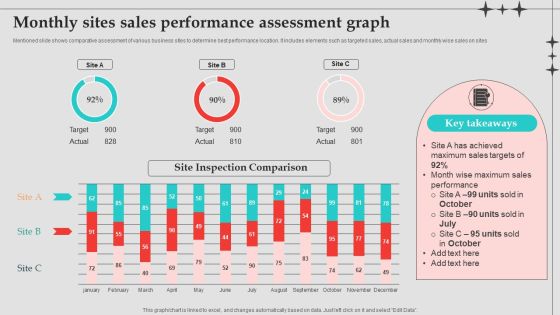
Monthly Sites Sales Performance Assessment Graph Designs PDF
Mentioned slide shows comparative assessment of various business sites to determine best performance location. It includes elements such as targeted sales, actual sales and monthly wise sales on sites. Pitch your topic with ease and precision using this Monthly Sites Sales Performance Assessment Graph Designs PDF. This layout presents information on Sales Performance, Sales Targets, Performance Assessment Graph . It is also available for immediate download and adjustment. So, changes can be made in the color, design, graphics or any other component to create a unique layout.
Financial Projection Graph Template 1 Ppt PowerPoint Presentation Icon Summary
This is a financial projection graph template 1 ppt powerpoint presentation icon summary. This is a three stage process. The stages in this process are annual sales forecast, years, business, marketing, management.
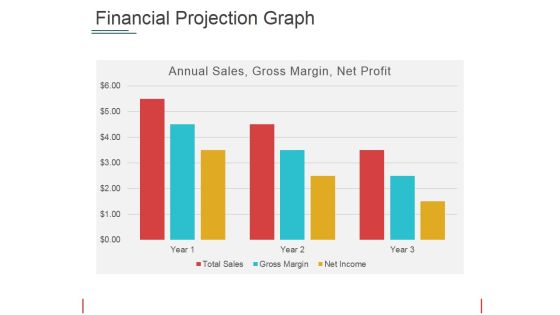
Financial Projection Graph Template 2 Ppt PowerPoint Presentation Show Picture
This is a financial projection graph template 2 ppt powerpoint presentation show picture. This is a three stage process. The stages in this process are annual sales, gross margin, net profit, years.
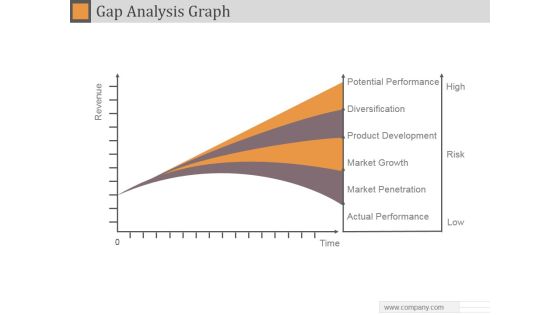
Gap Analysis Graph Ppt PowerPoint Presentation Example 2015
This is a gap analysis graph ppt powerpoint presentation example 2015. This is a four stage process. The stages in this process are potential performance, diversification, product development, market growth, market penetration, actual performance.

Waterfall Graph Showing Business Progress Ppt PowerPoint Presentation Styles Model
This is a waterfall graph showing business progress ppt powerpoint presentation styles model. This is a three stage process. The stages in this process are profit and loss, balance sheet, income statement, benefit and loss.
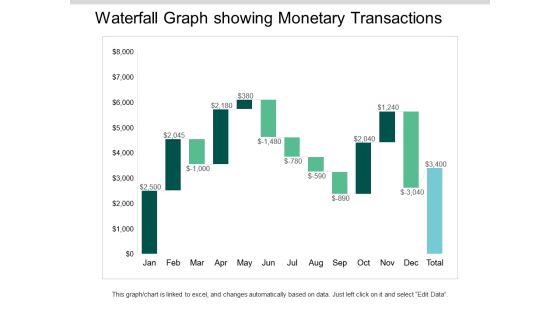
Waterfall Graph Showing Monetary Transactions Ppt PowerPoint Presentation Ideas Visuals
This is a waterfall graph showing monetary transactions ppt powerpoint presentation ideas visuals. This is a three stage process. The stages in this process are profit and loss, balance sheet, income statement, benefit and loss.

Energy Performance Assessment Dashboard Graph Ppt PowerPoint Presentation Slide
Presenting this set of slides with name energy performance assessment dashboard graph ppt powerpoint presentation slide. The topics discussed in these slides are marketing, business, management, planning, strategy. This is a completely editable PowerPoint presentation and is available for immediate download. Download now and impress your audience.

Competition Market Share Analysis Graph Ppt PowerPoint Presentation Infographics Inspiration
Presenting this set of slides with name competition market share analysis graph ppt powerpoint presentation infographics inspiration. The topics discussed in these slides are marketing, business, management, planning, strategy. This is a completely editable PowerPoint presentation and is available for immediate download. Download now and impress your audience.

Area Graph Analysis Ppt PowerPoint Presentation Summary Graphics Example
Presenting this set of slides with name area graph analysis ppt powerpoint presentation summary graphics example. The topics discussed in these slides are finance, marketing, management, investment, analysis. This is a completely editable PowerPoint presentation and is available for immediate download. Download now and impress your audience.
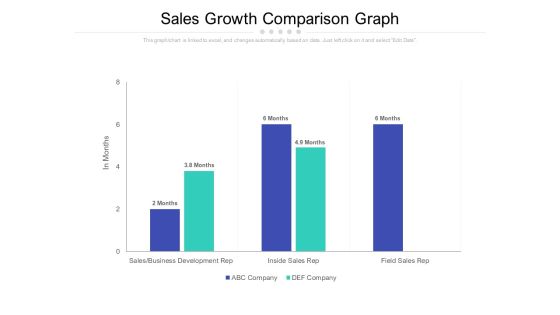
Sales Growth Comparison Graph Ppt PowerPoint Presentation Outline Demonstration
Presenting this set of slides with name sales growth comparison graph ppt powerpoint presentation outline demonstration. The topics discussed in these slides are sales, business development rep, inside sales rep, field sales rep. This is a completely editable PowerPoint presentation and is available for immediate download. Download now and impress your audience.
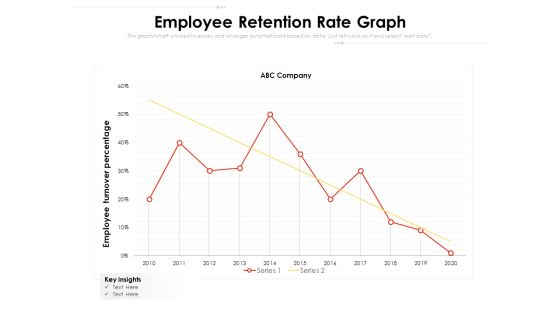
Employee Retention Rate Graph Ppt PowerPoint Presentation Pictures Portrait PDF
Presenting this set of slides with name employee retention rate graph ppt powerpoint presentation pictures portrait pdf. The topics discussed in these slides are key insights, 2010 to 2020, employee turnover percentage. This is a completely editable PowerPoint presentation and is available for immediate download. Download now and impress your audience.
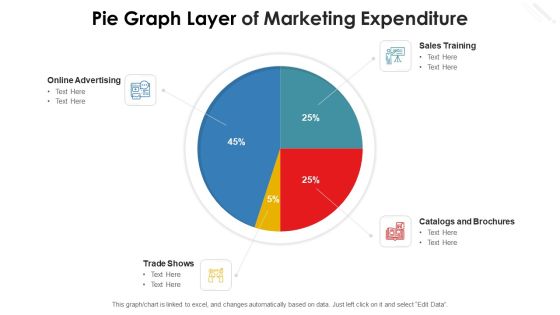
Pie Graph Layer Of Marketing Expenditure Themes PDF
Pitch your topic with ease and precision using this pie graph layer of marketing expenditure themes pdf. This layout presents information on online advertising, trade shows, sales training, catalogs and brochures. It is also available for immediate download and adjustment. So, changes can be made in the color, design, graphics or any other component to create a unique layout.

Pie Graph Layer Of Organizational Report Themes PDF
Pitch your topic with ease and precision using this pie graph layer of organizational report themes pdf. This layout presents information on revenues increased by, business growth and expansion, customer traffic increased by. It is also available for immediate download and adjustment. So, changes can be made in the color, design, graphics or any other component to create a unique layout.

Pie Graph Layer Presenting Business Expenses Topics PDF
Pitch your topic with ease and precision using this pie graph layer presenting business expenses topics pdf. This layout presents information on investment, material procurement, training, employees salary, factory rent. It is also available for immediate download and adjustment. So, changes can be made in the color, design, graphics or any other component to create a unique layout.

Pie Graph Layer Representing Company Budget Sample PDF
Pitch your topic with ease and precision using this pie graph layer representing company budget sample pdf. This layout presents information on maintenance and repairs, operating expenses, research and development, salaries and wages. It is also available for immediate download and adjustment. So, changes can be made in the color, design, graphics or any other component to create a unique layout.
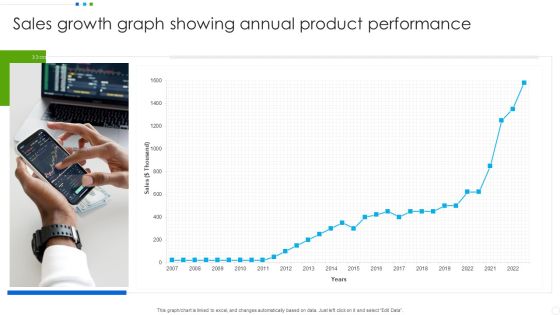
Sales Growth Graph Showing Annual Product Performance Slides PDF
Pitch your topic with ease and precision using this Sales Growth Graph Showing Annual Product Performance Slides PDF. This layout presents information on Sales Growth, Product Performance. It is also available for immediate download and adjustment. So, changes can be made in the color, design, graphics or any other component to create a unique layout.
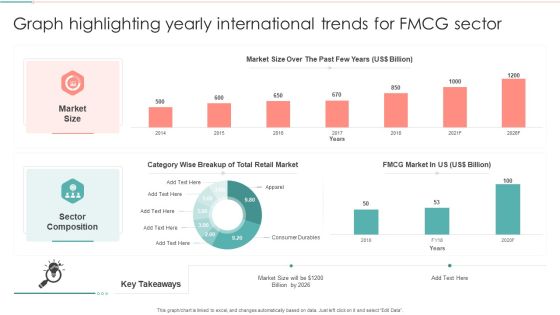
Graph Highlighting Yearly International Trends For FMCG Sector Information PDF
Pitch your topic with ease and precision using this Graph Highlighting Yearly International Trends For FMCG Sector Information PDF. This layout presents information on Sector Composition, Wise Breakup, Retail Market. It is also available for immediate download and adjustment. So, changes can be made in the color, design, graphics or any other component to create a unique layout.

Harvey Ball Graph For Employee Life Cycle Pictures PDF
Pitch your topic with ease and precision using this Harvey Ball Graph For Employee Life Cycle Pictures PDF. This layout presents information on Employee Life Cycle, Design Organisation Structure, Personnel Development Plans . It is also available for immediate download and adjustment. So, changes can be made in the color, design, graphics or any other component to create a unique layout.

U S Environmental High Tech Industry Revenue Graph Professional PDF
This slide shows the revenue generated from different environmental technologies in US . It includes analytical services , wastewater treatment woks , solid waste management , etc. Showcasing this set of slides titled U S Environmental High Tech Industry Revenue Graph Professional PDF. The topics addressed in these templates are Management, Materials Collection, Revenues. All the content presented in this PPT design is completely editable. Download it and make adjustments in color, background, font etc. as per your unique business setting.

USA Recruitment Process Outsourcing Market Size Graph Topics PDF
This slide shows market size of RPO in US market. It includes size of enterprise, on-demand and function based. Showcasing this set of slides titled USA Recruitment Process Outsourcing Market Size Graph Topics PDF. The topics addressed in these templates are RPO Enterprises, Largest Market Size. All the content presented in this PPT design is completely editable. Download it and make adjustments in color, background, font etc. as per your unique business setting.

Cost For Quality Graph Ppt PowerPoint Presentation Graphics
This is a cost for quality graph ppt powerpoint presentation graphics. This is a four stage process. The stages in this process are external failure, internal failure, prevention, appraisal, quality improvement.

Cost For Quality Graph Ppt PowerPoint Presentation Ideas Files
This is a cost for quality graph ppt powerpoint presentation ideas files. This is a four stage process. The stages in this process are external failure, internal failure, prevention, appraisal, quality improvement.

Elevator Pitch Template 1 Ppt PowerPoint Presentation Diagram Graph Charts
This is a elevator pitch template 1 ppt powerpoint presentation diagram graph charts. This is a three stage process. The stages in this process are what, why, how.

Combo Chart Graph Ppt PowerPoint Presentation Inspiration Template
This is a combo chart graph ppt powerpoint presentation inspiration template. This is a three stage process. The stages in this process are finance, marketing, management, investment, analysis.
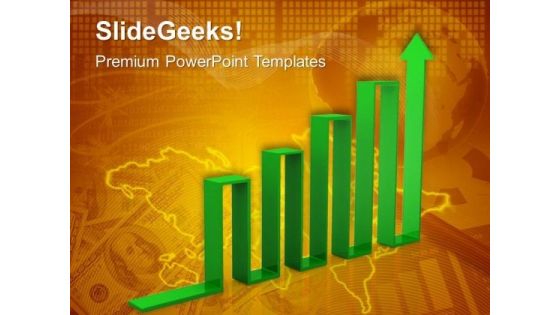
Arrow Graph Success PowerPoint Templates And PowerPoint Themes 1012
Arrow Graph Success PowerPoint Templates And PowerPoint Themes 1012-This PowerPoint Template shows arrow graph with increase. This image signifies the Financial or Business Growth. The Template assumes business concept. Use this template for Global Business. The structure of our templates allows you to effectively highlight the key issues concerning the growth of your business.-Arrow Graph Success PowerPoint Templates And PowerPoint Themes 1012-This PowerPoint template can be used for presentations relating to-Arrow to success, business, marketing, finance, arrows, success

Annual Customer Sales Performance Comparison Graph Portrait PDF
This slide shows the annual sales comparison chart. It also includes total and monthly sales target. Pitch your topic with ease and precision using this Annual Customer Sales Performance Comparison Graph Portrait PDF. This layout presents information on Total Sales Target, Sales Target, Achievement. It is also available for immediate download and adjustment. So, changes can be made in the color, design, graphics or any other component to create a unique layout.
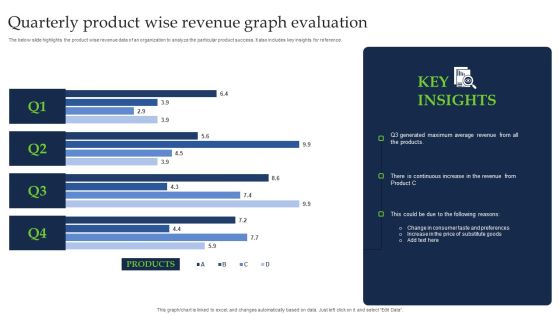
Quarterly Product Wise Revenue Graph Evaluation Brochure PDF
The below slide highlights the product wise revenue data of an organization to analyze the particular product success. It also includes key insights for reference. Pitch your topic with ease and precision using this Quarterly Product Wise Revenue Graph Evaluation Brochure PDF. This layout presents information on Products, Average Revenue. It is also available for immediate download and adjustment. So, changes can be made in the color, design, graphics or any other component to create a unique layout.
Business Graph Handshake PowerPoint Templates And PowerPoint Themes 0512
Microsoft Powerpoint Templates and Background with handshake-These templates can be used for presentations relating to-Handshake, success, business, finance, marketing, Shapes-Business Graph Handshake PowerPoint Templates And PowerPoint Themes 0512
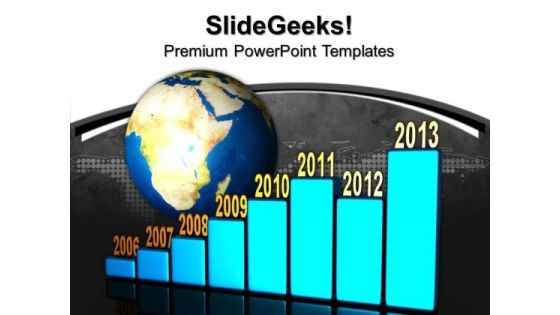
Yearly Business Graph Global PowerPoint Templates And PowerPoint Themes 0912
Yearly Business Graph Global PowerPoint Templates And PowerPoint Themes 0912-Microsoft Powerpoint Templates and Background with business concept-Business concept, business, success, global, finance, sales
Business Development Strategy Template 3d Man With Growth Graph Characters
Doll Up Your Thoughts With Our Business Development Strategy Template 3D Man With Growth Graph Characters Powerpoint Templates. They Will Make A Pretty Picture.

Business Development Strategy Template 3d Man With Success Graph Characters
Establish The Dominance Of Your Ideas. Our Business Development Strategy Template 3D Man With Success Graph Characters Powerpoint Templates Will Put Them On Top.

Stock Photo Pie Graph For Business Performance Ppt Template
Our Stock Photo Pie Graph For Business Performance PPT template Powerpoint Templates Allow You To Do It With Ease. Just Like Picking The Low Hanging Fruit.

Graph In 2011 Business PowerPoint Backgrounds And Templates 1210
Microsoft PowerPoint Template and Background with An orange arrow moving upwards over the 3D rendering of the year 2011 business graph on a white reflective background

Graph On Tablet For Segmentation Strategy Powerpoint Template
Concept of segmentation strategy can be explained with this diagram. This PowerPoint template contains graph on computer tablet. Download this diagram slide to make interactive presentations.
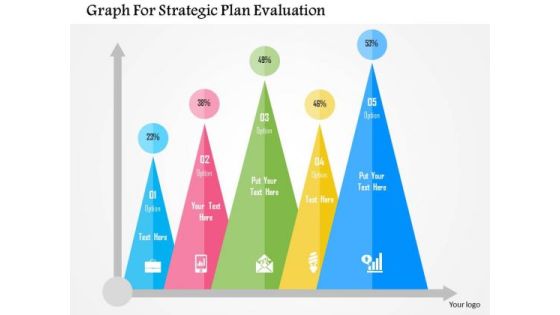
Business Diagram Graph For Strategic Plan Evaluation Presentation Template
Strategic plan evaluation can be explained with this diagram. It contains business statistics graph with icons. Download this diagram slide to make impressive presentations.

Innovative Marketing Concepts 3d Team Around Business Graph Characters
Highlight Your Drive With Our innovative marketing concepts 3d team around business graph characters Powerpoint Templates. Prove The Fact That You Have Control.
Business Growth Strategy 3d Man On Graph Character
Doll Up Your Thoughts With Our business growth strategy 3d man on graph character Powerpoint Templates. They Will Make A Pretty Picture.
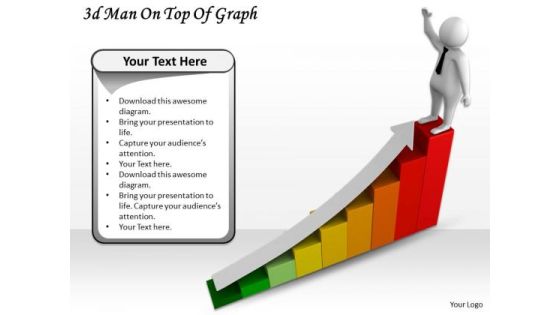
Business Growth Strategy 3d Man On Top Of Graph Character
Establish The Dominance Of Your Ideas. Our business growth strategy 3d man on top of graph character Powerpoint Templates Will Put Them On Top.

Business Strategy 3d Successful Man On Graph Concepts
Double The Impact With Our business strategy 3d successful man on graph concepts Powerpoint Templates. Your Thoughts Will Have An Imposing Effect.
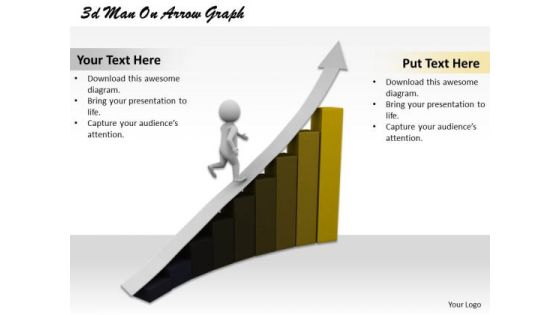
Creative Marketing Concepts 3d Man Arrow Graph Characters
Draft It Out On Our creative marketing concepts 3d man arrow graph characters Powerpoint Templates. Give The Final Touches With Your Ideas.
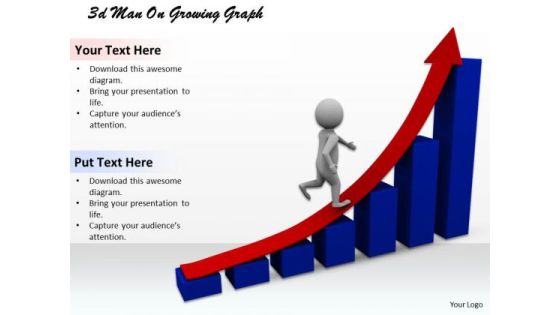
Innovative Marketing Concepts 3d Man Growing Graph Adaptable Business
Add Some Dramatization To Your Thoughts. Our innovative marketing concepts 3d man growing graph adaptable business Powerpoint Templates Make Useful Props.

Business Strategy Execution 3d Man Top Of Graph Character Modeling
Be The Doer With Our business strategy execution 3d man top of graph character modeling Powerpoint Templates. Put Your Thoughts Into Practice.

Business Strategy Implementation 3d Man Rising With Graph Concept
Put In A Dollop Of Our business strategy implementation 3d man rising with graph concept Powerpoint Templates. Give Your Thoughts A Distinctive Flavor.
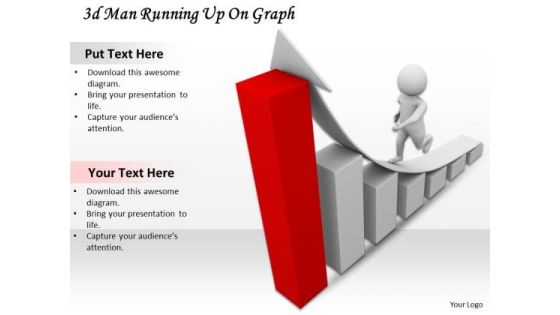
Business Strategy Implementation 3d Man Running Up Graph Concept
Get The Domestics Right With Our business strategy implementation 3d man running up graph concept Powerpoint Templates. Create The Base For Thoughts To Grow.

Modern Marketing Concepts 3d Team Meeting Around Graph Characters
Plan For All Contingencies With Our modern marketing concepts 3d team meeting around graph characters Powerpoint Templates. Douse The Fire Before It Catches.
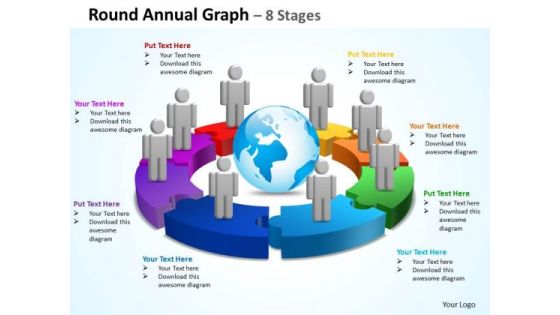
Business Diagram Round Annual Graph 8 Stages Marketing Diagram
Document Your Views On Our Business Diagram Round Annual Graph 8 Stages Marketing Diagram Powerpoint Templates. They Will Create A Strong Impression.

Marketing Diagram Circular Progress Diagrams Graph 8 Stages Strategy Diagram
Get The Doers Into Action. Activate Them With Our Marketing Diagram Circular Progress Diagrams Graph 8 Stages Strategy Diagram Powerpoint Templates.

Business Framework Model Buisness Graph Dashboard Style Consulting Diagram
Get Out Of The Dock With Our Business Framework Model Business Graph Dashboard Style Consulting Diagram Powerpoint Templates. Your Mind Will Be Set Free.
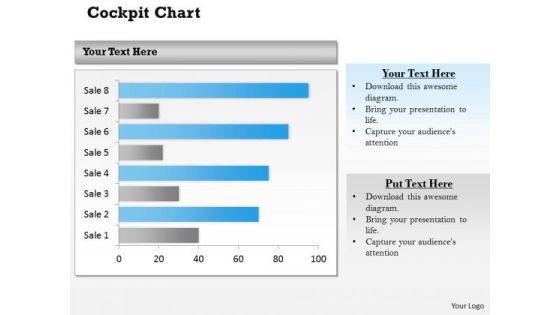
Strategic Management Business Graph Dashboard Layout Business Diagram
Doll Up Your Thoughts With Our Strategic Management Business Graph Dashboard Layout Business Diagram Powerpoint Templates. They Will Make A Pretty Picture.
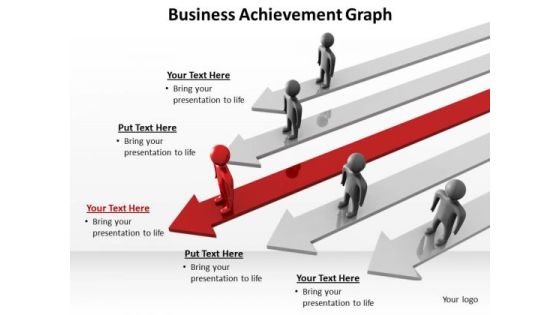
Mba Models And Frameworks Business Achievement Graph Consulting Diagram
Our MBA Models And Frameworks Business Achievement Graph Consulting Diagram Powerpoint Templates And Your Ideas Make A Great Doubles Pair. Play The Net With Assured Hands.
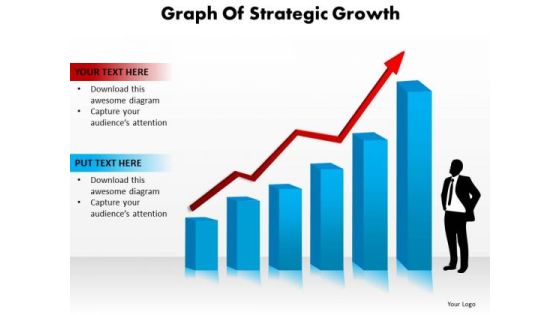
Strategy Diagram Graph Of Strategic Growth Business Cycle Diagram
Our Strategy Diagram Graph Of Strategic Growth Business Cycle Diagram Powerpoint Templates Heighten Concentration. Your Audience Will Be On The Edge.
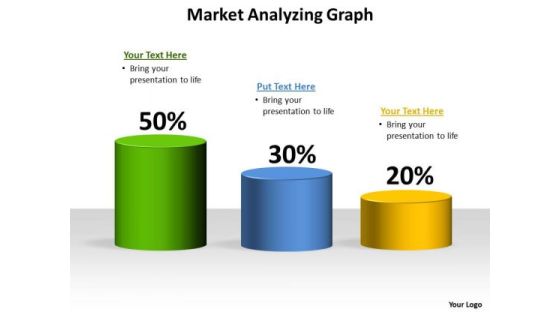
Business Finance Strategy Development Market Analyzing Graph Strategic Management
Establish The Dominance Of Your Ideas. Our Business Finance Strategy Development Market Analyzing Graph Strategic Management Powerpoint Templates Will Put Them On Top.

Insurance Policy Usage Stacked Percentage Graph Template PDF
This slide illustrates use of insurance policy types percentage chart in USA to determine total number of insurances taken. It includes cities and insurance policy percentage. Pitch your topic with ease and precision using this Insurance Policy Usage Stacked Percentage Graph Template PDF. This layout presents information on Motor Vehicle Policies, More Population, Migration Of People. It is also available for immediate download and adjustment. So, changes can be made in the color, design, graphics or any other component to create a unique layout.

Yearly Comparison Graph For Human Resource Employees Salary Template PDF
This slide showcases yearly comparison of salary of different employees in organization and identify the increment growth rate. It showcases comparative assessment for a period of 4 years. Pitch your topic with ease and precision using this Yearly Comparison Graph For Human Resource Employees Salary Template PDF. This layout presents information on Human Resource, Employees Salary. It is also available for immediate download and adjustment. So, changes can be made in the color, design, graphics or any other component to create a unique layout.

Market Segmentation Ppt PowerPoint Presentation Diagram Graph Charts
This is a market segmentation ppt powerpoint presentation diagram graph charts. This is a four stage process. The stages in this process are geographic, demographic, psychographic, behavioral.

Business Marketing Organizational Expense Assessment Graph Information PDF
The following slide depicts the comparative analysis of marketing budget allocation for current and previous year to assess variance. It includes promotional activities such as advertising, paid media, agency fee, publicity etc. Showcasing this set of slides titled Business Marketing Organizational Expense Assessment Graph Information PDF. The topics addressed in these templates are Paid Media, Advertising, Budget Allocated. All the content presented in this PPT design is completely editable. Download it and make adjustments in color, background, font etc. as per your unique business setting.
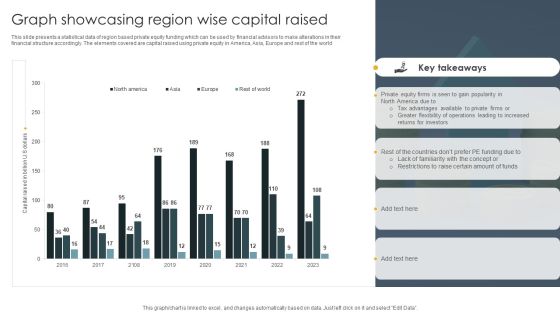
Graph Showcasing Region Wise Capital Raised Demonstration PDF
This slide presents a statistical data of region based private equity funding which can be used by financial advisors to make alterations in their financial structure accordingly. The elements covered are capital raised using private equity in America, Asia, Europe and rest of the world. Showcasing this set of slides titled Graph Showcasing Region Wise Capital Raised Demonstration PDF. The topics addressed in these templates are Investors, Tax Advantages, Private Equity. All the content presented in this PPT design is completely editable. Download it and make adjustments in color, background, font etc. as per your unique business setting.
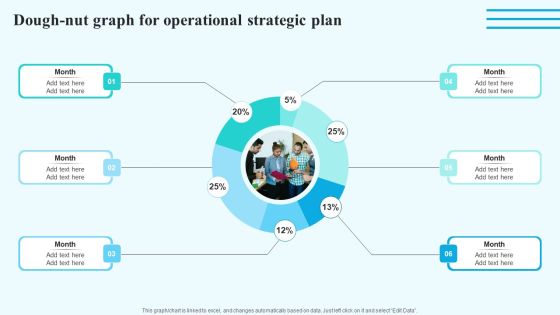
Dough Nut Graph For Operational Strategic Plan Information PDF
Are you in need of a template that can accommodate all of your creative concepts This one is crafted professionally and can be altered to fit any style. Use it with Google Slides or PowerPoint. Include striking photographs, symbols, depictions, and other visuals. Fill, move around, or remove text boxes as desired. Test out color palettes and font mixtures. Edit and save your work, or work with colleagues. Download Dough Nut Graph For Operational Strategic Plan Information PDF and observe how to make your presentation outstanding. Give an impeccable presentation to your group and make your presentation unforgettable.
Direct Sales Lead Ppt Powerpoint Presentation Diagram Graph Charts Cpb
This is a direct sales lead ppt powerpoint presentation diagram graph charts cpb. This is a two stage process. The stages in this process are direct sales lead.
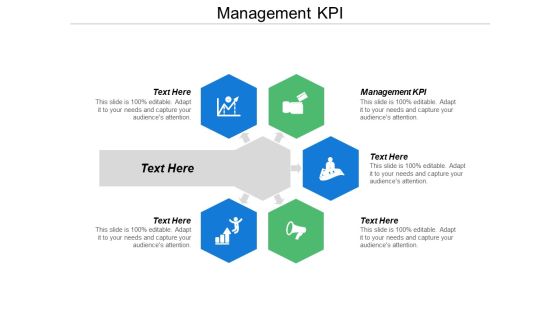
Management Kpi Ppt Powerpoint Presentation Diagram Graph Charts Cpb
This is a management kpi ppt powerpoint presentation diagram graph charts cpb. This is a five stage process. The stages in this process are management kpi.

Column Chart Graph Ppt PowerPoint Presentation Outline Information
This is a column chart graph ppt powerpoint presentation outline information. This is a three stage process. The stages in this process are compare, marketing, business, management, planning.

Stock Chart Graph Ppt PowerPoint Presentation Ideas Demonstration
This is a stock chart graph ppt powerpoint presentation ideas demonstration. This is a three stage process. The stages in this process are finance, marketing, management, investment, analysis.
Project Management Gantt Chart Graph Ppt PowerPoint Presentation Styles Icon
This is a project management gantt chart graph ppt powerpoint presentation styles icon. This is a four stage process. The stages in this process are four.

Combo Chart Graph Ppt PowerPoint Presentation Infographics Guide
This is a combo chart graph ppt powerpoint presentation infographics guide. This is a two stage process. The stages in this process are marketing, business, management, planning, strategy.

Clustered Chart Graph Ppt PowerPoint Presentation Gallery Backgrounds
This is a clustered chart graph ppt powerpoint presentation gallery backgrounds. This is a three stage process. The stages in this process are finance, marketing, analysis, investment, million.

Combo Chart Graph Ppt PowerPoint Presentation Professional Guidelines
This is a combo chart graph ppt powerpoint presentation professional guidelines. This is a three stage process. The stages in this process are finance, marketing, analysis, investment, million.

Diminishing Graph And Chart Icon With Arrow Sign Clipart PDF
Presenting Diminishing Graph And Chart Icon With Arrow Sign Clipart PDF to dispense important information. This template comprises four stages. It also presents valuable insights into the topics including Diminishing Graph, Chart Icon With Arrow Sign. This is a completely customizable PowerPoint theme that can be put to use immediately. So, download it and address the topic impactfully.

Breakdown By Area In Pie Chart And Graph Introduction PDF
Showcasing this set of slides titled Breakdown By Area In Pie Chart And Graph Introduction PDF. The topics addressed in these templates are Break Down, Area Pie, Chart Graph. All the content presented in this PPT design is completely editable. Download it and make adjustments in color, background, font etc. as per your unique business setting.

Decrease Graph Vector Icon Ppt PowerPoint Presentation Infographic Template Shapes
Presenting this set of slides with name decrease graph vector icon ppt powerpoint presentation infographic template shapes. This is a four stage process. The stages in this process are loss, decrease graph, stock market. This is a completely editable PowerPoint presentation and is available for immediate download. Download now and impress your audience.

Promotion Guildines Graph Representing Growth Icon Template PDF
Persuade your audience using this Promotion Guildines Graph Representing Growth Icon Template PDF. This PPT design covers three stages, thus making it a great tool to use. It also caters to a variety of topics including Promotion Guildines, Graph Representing, Growth Icon. Download this PPT design now to present a convincing pitch that not only emphasizes the topic but also showcases your presentation skills.

Marketing Diagram Cycle Chain Graph Business Cycle Diagram
Get the doers into action. Activate them with our Marketing Diagram Cycle Chain Graph Business Cycle Diagram Powerpoint Templates. Put your money on our Marketing Diagram Cycle Chain Graph Business Cycle Diagram Powerpoint Templates. Your ideas will rake in the dollars.
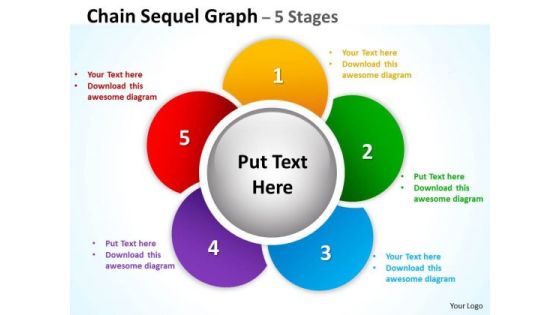
Business Framework Model Chain Sequel Graph Diagrams Consulting Diagram
Our Business Framework Model Chain Sequel Graph diagrams Consulting diagram Powerpoint Templates team are a dogged lot. They keep at it till they get it right. Dole it out with our Business Framework Model Chain Sequel Graph diagrams Consulting diagram Powerpoint Templates. Your thoughts will get the right proportions.
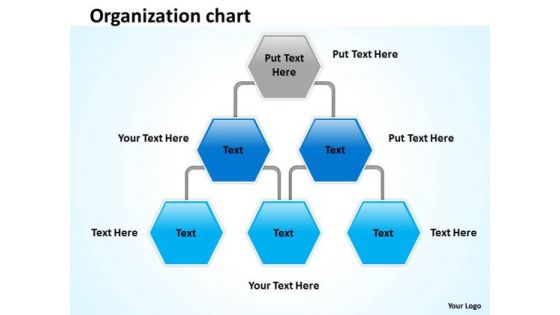
Marketing Diagram Organization Graph Mba Models And Frameworks
Our marketing diagram Organization graph MBA models and frameworks Powerpoint Templates Enjoy Drama. They Provide Entertaining Backdrops. Our marketing diagram Organization graph MBA models and frameworks Powerpoint Templates Help To Make A Draft. They Give You A Good Place To Start.

Consulting Diagram Annual Financial Growth Graph Strategic Management
Analyze Ailments On Our Consulting Diagram Annual Financial Growth Graph Strategic Management Powerpoint Templates. Bring Out The Thinking Doctor In You. Dock Your Thoughts With Our Consulting Diagram Annual Financial Growth Graph Strategic Management Powerpoint Templates. They Will Launch Them Into Orbit.

Stakeholder Assessment Analysis Graph With Power And Interest Formats PDF
Deliver an awe-inspiring pitch with this creative stakeholder assessment analysis graph with power and interest formats pdf bundle. Topics like stakeholder assessment analysis graph with power and interest can be discussed with this completely editable template. It is available for immediate download depending on the needs and requirements of the user.
Staff Performance Evaluation Icon With Rising Graph Summary PDF
Presenting staff performance evaluation icon with rising graph summary pdf to dispense important information. This template comprises three stages. It also presents valuable insights into the topics including staff performance evaluation icon with rising graph. This is a completely customizable PowerPoint theme that can be put to use immediately. So, download it and address the topic impactfully.
Statistical Data Graph Icon Showing Financial Forecast Rules PDF
Presenting statistical data graph icon showing financial forecast rules pdf to dispense important information. This template comprises four stages. It also presents valuable insights into the topics including statistical data graph icon showing financial forecast. This is a completely customizable PowerPoint theme that can be put to use immediately. So, download it and address the topic impactfully.
Graph Depicting Market Fluctuation Of Information Guidelines PDF
Presenting Graph Depicting Market Fluctuation Of Information Guidelines PDF to dispense important information. This template comprises three stages. It also presents valuable insights into the topics including Graph Depicting, Market Fluctuation, Information This is a completely customizable PowerPoint theme that can be put to use immediately. So, download it and address the topic impactfully.

Business Plan Sprint Review Icon With Graph Themes PDF
Presenting Business Plan Sprint Review Icon With Graph Themes PDF to dispense important information. This template comprises four stages. It also presents valuable insights into the topics including Review Icon With Graph, Business Plan Sprint. This is a completely customizable PowerPoint theme that can be put to use immediately. So, download it and address the topic impactfully.

Doughnut Graph Icon Highlighting IT Team Structure Structure PDF
Presenting Doughnut Graph Icon Highlighting IT Team Structure Structure PDF to dispense important information. This template comprises four stages. It also presents valuable insights into the topics including Doughnut Graph, Icon Highlighting, IT Team Structure. This is a completely customizable PowerPoint theme that can be put to use immediately. So, download it and address the topic impactfully.
Graph Comparison Icon For Liquidity Financial Ratios Analysis Summary PDF
Presenting Graph Comparison Icon For Liquidity Financial Ratios Analysis Summary PDF to dispense important information. This template comprises Three stages. It also presents valuable insights into the topics including Graph Comparison, Icon For Liquidity, Financial Ratios Analysis. This is a completely customizable PowerPoint theme that can be put to use immediately. So, download it and address the topic impactfully.
Financial Yearly Forecast Icon With Graph And Checklist Summary PDF
Presenting Financial Yearly Forecast Icon With Graph And Checklist Summary PDF to dispense important information. This template comprises Three stages. It also presents valuable insights into the topics including Financial Yearly Forecast, Graph And Checklist . This is a completely customizable PowerPoint theme that can be put to use immediately. So, download it and address the topic impactfully.
ITIL Demand Management Growth Graph Icon Rules PDF
Presenting ITIL Demand Management Growth Graph Icon Rules PDF to dispense important information. This template comprises three stages. It also presents valuable insights into the topics including Itil Demand Management, Growth Graph Icon. This is a completely customizable PowerPoint theme that can be put to use immediately. So, download it and address the topic impactfully.

Cloud System Checking Monitoring With Graph Icon Mockup PDF
Presenting Cloud System Checking Monitoring With Graph Icon Mockup PDF to dispense important information. This template comprises three stages. It also presents valuable insights into the topics including Cloud System Checking, Monitoring With Graph Icon. This is a completely customizable PowerPoint theme that can be put to use immediately. So, download it and address the topic impactfully.
Industry Decline And Recession Graph Icon Ideas PDF
Presenting Industry Decline And Recession Graph Icon Ideas PDF to dispense important information. This template comprises three stages. It also presents valuable insights into the topics including Industry Decline, Recession Graph Icon. This is a completely customizable PowerPoint theme that can be put to use immediately. So, download it and address the topic impactfully.
Managers Self Advancement Plan Icon With Graph Guidelines PDF
Presenting Managers Self Advancement Plan Icon With Graph Guidelines PDF to dispense important information. This template comprises four stages. It also presents valuable insights into the topics including Managers Self Advancement, Plan Icon With Graph. This is a completely customizable PowerPoint theme that can be put to use immediately. So, download it and address the topic impactfully.

Car Types Used In Usa Stacked Percentage Graph Sample PDF
This slide shows car use percentage chart in USA to compare vehicle buying decisions. It includes types of cars and car use percentage. Pitch your topic with ease and precision using this Car Types Used In Usa Stacked Percentage Graph Sample PDF. This layout presents information on Limited Space In City, Less Parking Space, Easy To Commute. It is also available for immediate download and adjustment. So, changes can be made in the color, design, graphics or any other component to create a unique layout.

Ppt Linear Abstraction Arrow Animated Graph PowerPoint 2007 Templates
PPT linear abstraction arrow animated graph powerpoint 2007 Templates-Use this diagram to show a progression or sequential steps in a task, process, or workflow. They help to lay the base of your trend of thought and enhance the essence of your viable ideas. Create captivating presentations to deliver comparative and weighted arguments.-PPT linear abstraction arrow animated graph powerpoint 2007 Templates-analysis, arrow, background, business, chart, communication, concept, construction, delivery, design, development, engineering, fabrication, feasibiliti, generated, growth, idea, industry, making, production, products, science, sequence, shape
Straight Line Graph Ppt PowerPoint Presentation Visual Aids Inspiration Cpb
Presenting this set of slides with name straight line graph ppt powerpoint presentation visual aids inspiration cpb. This is an editable Powerpoint three stages graphic that deals with topics like straight line graph to help convey your message better graphically. This product is a premium product available for immediate download and is 100 percent editable in Powerpoint. Download this now and use it in your presentations to impress your audience.
Harvey Ball Graph Ppt PowerPoint Presentation Complete Deck With Slides
If designing a presentation takes a lot of your time and resources and you are looking for a better alternative, then this Harvey Ball Graph Ppt PowerPoint Presentation Complete Deck With Slides is the right fit for you. This is a prefabricated set that can help you deliver a great presentation on the topic. All the Twelve slides included in this sample template can be used to present a birds eye view of the topic. These slides are also fully editable, giving you enough freedom to add specific details to make this layout more suited to your business setting. Apart from the content, all other elements like color, design, theme are also replaceable and editable. This helps in designing a variety of presentations with a single layout. Not only this, you can use this PPT design in formats like PDF, PNG, and JPG once downloaded. Therefore, without any further ado, download and utilize this sample presentation as per your liking.

Clustered Column Line Graph Ppt PowerPoint Presentation Ideas Demonstration
This is a clustered column line graph ppt powerpoint presentation ideas demonstration. This is a three stage process. The stages in this process are financial, minimum, maximum, marketing, strategy.

Clustered Column Line Graph Ppt PowerPoint Presentation File Clipart
This is a clustered column line graph ppt powerpoint presentation file clipart. This is a three stage process. The stages in this process are finance, marketing, management, investment, analysis.

Clustered Column Line Graph Ppt PowerPoint Presentation Inspiration Deck
This is a clustered column line graph ppt powerpoint presentation inspiration deck. This is a three stage process. The stages in this process are finance, marketing, analysis, investment, million.

Graph Important Concept Diagram Business Plan Template PowerPoint Templates
We present our graph important concept diagram business plan template PowerPoint templates.Use our Arrows PowerPoint Templates because Watching this your Audience will Grab their eyeballs, they wont even blink. Present our Finance PowerPoint Templates because Our PowerPoint Templates and Slides will Activate the energies of your audience. Get their creative juices flowing with your words. Download our Marketing PowerPoint Templates because Our PowerPoint Templates and Slides are topically designed to provide an attractive backdrop to any subject. Use our Signs PowerPoint Templates because Our PowerPoint Templates and Slides are specially created by a professional team with vast experience. They diligently strive to come up with the right vehicle for your brilliant Ideas. Use our Business PowerPoint Templates because It will get your audience in sync.Use these PowerPoint slides for presentations relating to chart, bar, data, pie, percent, forecasting, economy, white, achievement, future, business, arrow, sign, line, symbol, diagram, styles, finance, stock, report, marketing, gray, analyzing, shape, abstract, graph, modern, economic, up, money, solution, design, making, growth, moving, grid, progress, artistic, profit, inspiration, background, investment, successful, financial, concepts, structure, ideas. The prominent colors used in the PowerPoint template are Blue, Green, Black.
Line Graph Icon Representing Growth In Internet Trend Rules PDF
Persuade your audience using this Line Graph Icon Representing Growth In Internet Trend Rules PDF This PPT design covers Four stages, thus making it a great tool to use. It also caters to a variety of topics including Line Graph, Icon Representing, Growth Internet Trend Download this PPT design now to present a convincing pitch that not only emphasizes the topic but also showcases your presentation skills.
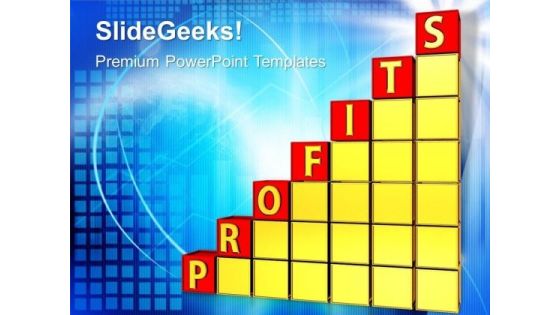
Business Profit Graph PowerPoint Templates And PowerPoint Themes 1012
Business Profit Graph PowerPoint Templates And PowerPoint Themes 1012-Create stunning Microsoft office PPT Presentations with our professional templates containing a graphic of success chart. This PowerPoint template shows the increasing graph with each letter of Success on each step. This template portrays the concepts of winning, leadership, finance, success, competition, sports, business, shapes, people and abstract. Present your views using our innovative slides and be assured of leaving a lasting impression.-Business Profit Graph PowerPoint Templates And PowerPoint Themes 1012-This PowerPoint template can be used for presentations relating to-Success profit chart graphic, business, finance, success, money, marketing

Money Graph Business PowerPoint Templates And PowerPoint Themes 1012
Money Graph Business PowerPoint Templates And PowerPoint Themes 1012-Visually support your Microsoft office PPT Presentation with our above template illustrating rising money chart. This image has been professionally designed to emphasize the business success concept. Our unique image makes your presentations professional showing that you care about even the smallest details. The structure of our templates allows you to effectively highlight the key issues concerning the growth of your business.-Money Graph Business PowerPoint Templates And PowerPoint Themes 1012-This PowerPoint template can be used for presentations relating to-Money graph, business, success, finance, money, marketing
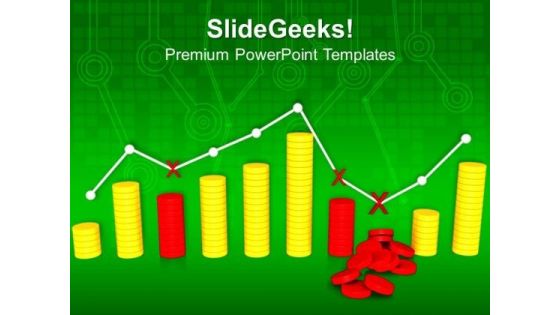
Graph With Business Fluctuations PowerPoint Templates And PowerPoint Themes 1012
Graph With Business Fluctuations PowerPoint Templates And PowerPoint Themes 1012-Emphatically define your message with our above template which contains a graphic of stack of coins with business graph showing fluctuations. This image represents the concept of business failure and success. Use this template for Business and Marketing purposes. The structure of our templates allows you to effectively highlight the key issues concerning the growth of your business.-Graph With Business Fluctuations PowerPoint Templates And PowerPoint Themes 1012-This PowerPoint template can be used for presentations relating to-Graph with fluctuations, business, finance, success, marketing, leadership

Percentage Graph Progress Business PowerPoint Templates And PowerPoint Themes 1012
Percentage Graph Progress Business PowerPoint Templates And PowerPoint Themes 1012-Using This Beautiful PowerPoint Template you will be able to illustrate the Growth, Progress, development, advancement, improvement, evolution, headway, steps forward, movement, evolvement etc. Our template will help pinpoint their viability. Refine them all as you take them through the numerous filtering stages of the funnel of your quality control process.-Percentage Graph Progress Business PowerPoint Templates And PowerPoint Themes 1012-This PowerPoint template can be used for presentations relating to-Graph Percent Going Up, Success, Business, Finance, Marketing, Money
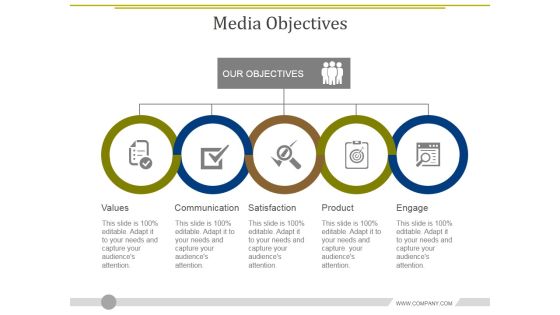
Media Objectives Template 2 Ppt PowerPoint Presentation Diagram Graph Charts
This is a media objectives template 2 ppt powerpoint presentation diagram graph charts. This is a five stage process. The stages in this process are values, communication, satisfaction, product, engage.
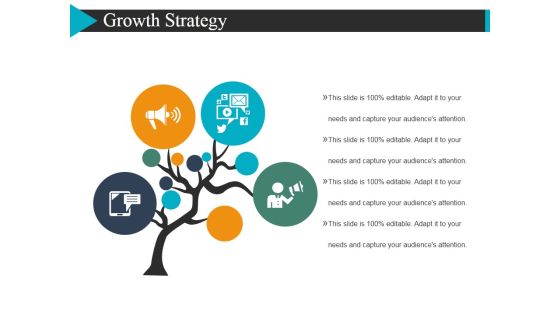
Growth Strategy Template 2 Ppt Powerpoint Presentation Diagram Graph Charts
This is a growth strategy template 2 ppt powerpoint presentation diagram graph charts. This is a four stage process. The stages in this process are tree, marketing, business, icons.
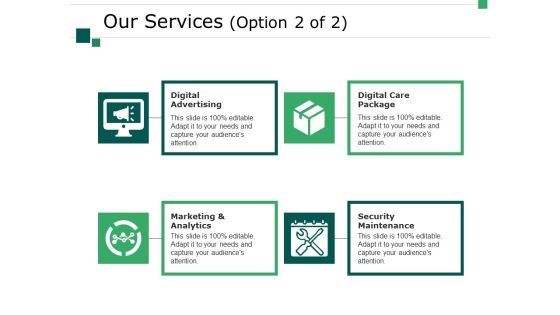
Our Services Template 2 Ppt PowerPoint Presentation Diagram Graph Charts
This is a our services template 2 ppt powerpoint presentation diagram graph charts. This is a four stage process. The stages in this process are business, digital advertising, digital care package, security maintenance, marketing and analytics, marketing, icons.

Scatter Bubble Chart Graph Ppt PowerPoint Presentation Infographic Template Maker
This is a scatter bubble chart graph ppt powerpoint presentation infographic template maker. This is a two stage process. The stages in this process are finance, marketing, management, investment, analysis.

Combo Chart Graph Ppt PowerPoint Presentation Infographic Template Layout Ideas
This is a combo chart graph ppt powerpoint presentation infographic template layout ideas. This is a three stage process. The stages in this process are finance, marketing, analysis, investment, million.
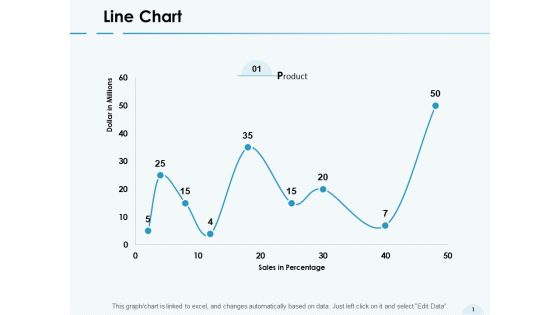
Line Chart Graph Ppt PowerPoint Presentation Gallery Structure
Presenting this set of slides with name line chart graph ppt powerpoint presentation gallery structure. The topics discussed in these slides are marketing, business, management, planning, strategy. This is a completely editable PowerPoint presentation and is available for immediate download. Download now and impress your audience.
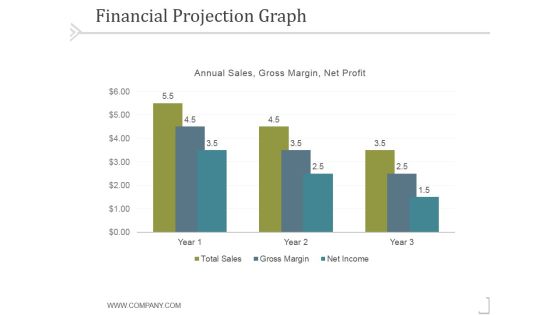
Financial Projection Graph Template 2 Ppt PowerPoint Presentation Template
This is a financial projection graph template 2 ppt powerpoint presentation template. This is a three stage process. The stages in this process are business, strategy, marketing, success, analysis.

Graph Demand Supply Ppt PowerPoint Presentation Layouts Design Templates Cpb
Presenting this set of slides with name graph demand supply ppt powerpoint presentation layouts design templates cpb. This is an editable Powerpoint six stages graphic that deals with topics like graph demand supply to help convey your message better graphically. This product is a premium product available for immediate download and is 100 percent editable in Powerpoint. Download this now and use it in your presentations to impress your audience.

Percentage Graph Finance PowerPoint Templates And PowerPoint Themes 0512
Microsoft Powerpoint Templates and Background with growing percents-These templates can be used for presentations relating to-Growing percent sales, business, finance, marketing, money, success-Percentage Graph Finance PowerPoint Templates And PowerPoint Themes 0512
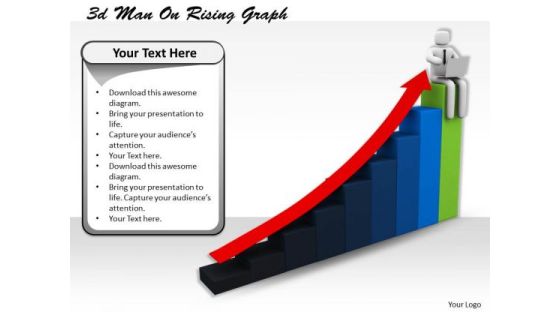
Business Development Strategy Template 3d Man On Rising Graph Characters
Establish The Dominance Of Your Ideas. Our Business Development Strategy Template 3d Man On Rising Graph Characters Powerpoint Templates Will Put Them On Top. Put Yourself In A Dominant Position. Our Arrows Powerpoint Templates Will Confirm Your Superiority.
Global Graph Success PowerPoint Templates And PowerPoint Themes 0512
Microsoft Powerpoint Templates and Background with success-Global Graph Success PowerPoint Templates And PowerPoint Themes 0512-These PowerPoint designs and slide layouts can be used for themes relating to -Success, business, shapes, marketing, sales, finance, shapes

Success Graph Business PowerPoint Templates And PowerPoint Themes 0512
Microsoft Powerpoint Templates and Background with success-Success Graph Business PowerPoint Templates And PowerPoint Themes 0512-These PowerPoint designs and slide layouts can be used for themes relating to -Success, business, shapes, marketing, handshake, finance
Profit Graph Business PowerPoint Templates And PowerPoint Themes 0912
Profit Graph Business PowerPoint Templates And PowerPoint Themes 0912-Microsoft Powerpoint Templates and Background with arrows pointing up business and financial growth concept-Arrows pointing up business and financial growth concept, business, arrows, success, finance, targets

Business Diagram Creative Graph For Business Reports Presentation Template
Download this diagram to display planning and analysis concepts. This business diagram contains the graphic of creative graph for business reports. Use this template to highlight the key issues of your presentation.
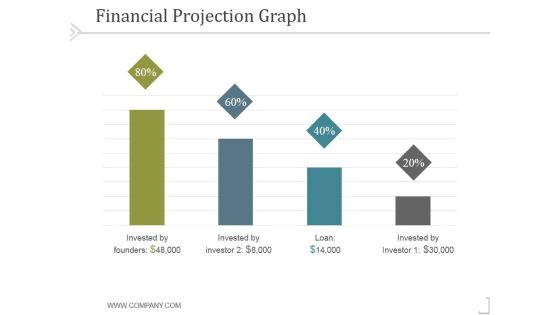
Financial Projection Graph Template 1 Ppt PowerPoint Presentation Model
This is a financial projection graph template 1 ppt powerpoint presentation model. This is a four stage process. The stages in this process are business, strategy, marketing, success, analysis.

Financial Projection Graph Template 1 Ppt PowerPoint Presentation Graphics
This is a financial projection graph template 1 ppt powerpoint presentation graphics. This is a three stage process. The stages in this process are annual sales, business, management, marketing, strategy.

Financial Projection Graph Template 2 Ppt PowerPoint Presentation Ideas
This is a financial projection graph template 2 ppt powerpoint presentation ideas. This is a nine stage process. The stages in this process are annual sales, business, management, marketing, strategy.

Financial Projection Graph Template 1 Ppt PowerPoint Presentation Clipart
This is a financial projection graph template 1 ppt powerpoint presentation clipart. This is a three stage process. The stages in this process are annual, sales, forecast, finance, marketing.
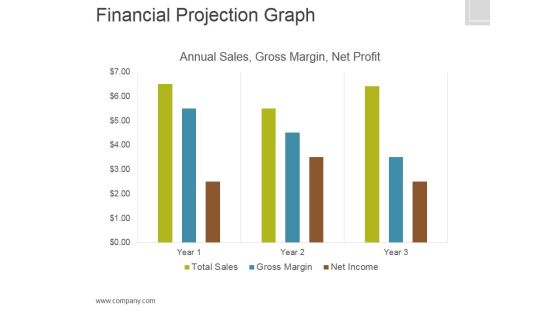
Financial Projection Graph Template 2 Ppt PowerPoint Presentation Graphics
This is a financial projection graph template 2 ppt powerpoint presentation graphics. This is a three stage process. The stages in this process are annual sales, gross margin, net profit, finance.

Price Quality Relationship Graph Ppt PowerPoint Presentation Show Design Templates
This is a price quality relationship graph ppt powerpoint presentation show design templates. This is a two stage process. The stages in this process are cost benefit analysis, cost benefit investigation, cost benefit examination.

Marketing Management Dashboard Graph Ppt PowerPoint Presentation Infographic Template Portfolio
This is a marketing management dashboard graph ppt powerpoint presentation infographic template portfolio. The topics discussed in this diagram are marketing, business, management, planning, strategy This is a completely editable PowerPoint presentation, and is available for immediate download.

Graph Clustering 2d PowerPoint Slides And Ppt Diagram Templates
Graph Clustering 2D PowerPoint Slides And PPT Diagram Templates-These high quality, editable pre-designed powerpoint slides have been carefully created by our professional team to help you impress your audience. Each graphic in every slide is vector based and is 100% editable in powerpoint. Each and every property of any slide - color, size, shading etc can be modified to build an effective powerpoint presentation. Use these slides to convey complex business concepts in a simplified manner. Any text can be entered at any point in the powerpoint slide. Simply DOWNLOAD, TYPE and PRESENT!

Business Strategy Concepts 3d Man Sitting Graph Statement
Touch Base With Our business strategy concepts 3d man sitting graph statement Powerpoint Templates. Review Your Growth With Your Audience. Take A Deep Dive With Our Finance Powerpoint Templates. Get Into The Nitti Gritty Of It All.
Company Business Strategy 3d Man With Graph Characters
Ace A Drive Into Unknown Territory. Our company business strategy 3d man with graph characters Powerpoint Templates Will Provide The Co Ordinates. Drive Out Of Difficulty With Our Finance Powerpoint Templates. They Will Steer You To Safety.

Business And Strategy 3d Man On Growth Graph Character
Analyze Ailments On Our Business And Strategy 3d Man On Growth Graph Character Powerpoint Templates. Bring Out The Thinking Doctor In You. Dock Your Thoughts With Our People Powerpoint Templates. They Will Launch Them Into Orbit.
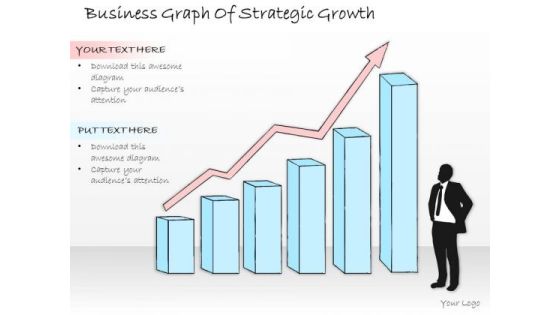
Ppt Slide Business Graph Of Strategic Growth Diagrams
Our PPT Slide Business Graph Of Strategic Growth Diagrams Powerpoint Templates Abhor Doodling. They Never Let The Interest Flag. Our Business Diagrams Powerpoint Templates Make Good Beasts Of Burden. Place All Your Demands On Them.

Ppt Slide Graph Of Product Lifecycle Marketing Plan
Delight Them With Our PPT Slide Graph Of Product Lifecycle Marketing Plan Powerpoint Templates. Your Audience Will Be Ecstatic. Our Sales Plan Powerpoint Templates Are Created Cost Effective. They Understand The Need For Economy.
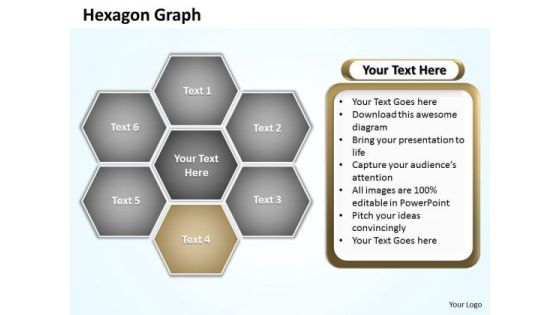
Ppt Hexagon Shapes Graph Editable PowerPoint Templates 2010
PPT hexagon shapes graph editable powerpoint templates 2010-Use this diagram to show the relationship to a central idea. Emphasizes both information in the center hexagon and how information in the outer hexagons contributes to the central idea. Transmit your thoughts via this slide and prod your team to action-PPT hexagon shapes graph editable powerpoint templates 2010-Abstract, Background, Design, Digital, Elements, Graphic, Grey, Hexagon, Illustration, Light, Modern, Perspective, Triangles, Shapes, Shiny, Style, Technology, Template, Vector, Vertical, Virtual, Wallpaper, Web

Growth Graph With Arrow On Target Board Powerpoint Slides
This PowerPoint template is useful for making presentations on business goals and strategy formation. This PPT background has a design of growth graph with arrow on target. This PPT slide is suitable for topics like corporate strategic planning.
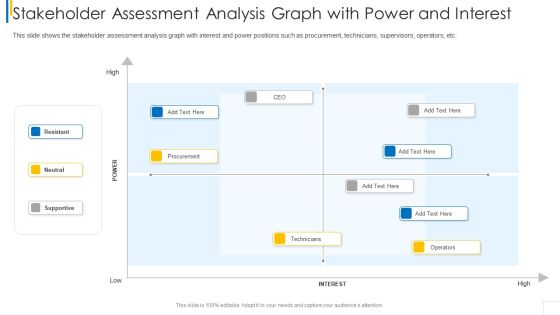
Stakeholder Assessment Analysis Graph With Power And Interest Ideas PDF
This slide shows the stakeholder assessment analysis graph with interest and power positions such as procurement, technicians, supervisors, operators, etc.Deliver an awe inspiring pitch with this creative stakeholder assessment analysis graph with power and interest ideas pdf bundle. Topics like resistant, neutral, supportive, procurement, technicians can be discussed with this completely editable template. It is available for immediate download depending on the needs and requirements of the user.
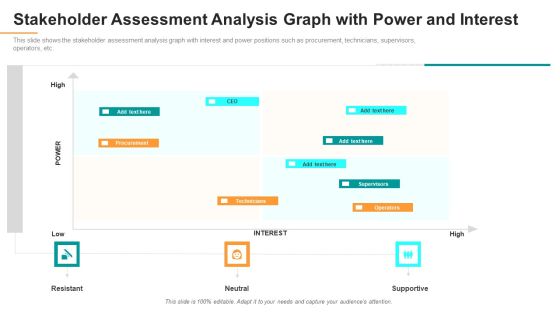
Stakeholder Assessment Analysis Graph With Power And Interest Introduction PDF
This slide shows the stakeholder assessment analysis graph with interest and power positions such as procurement, technicians, supervisors, operators, etc. Deliver and pitch your topic in the best possible manner with this stakeholder assessment analysis graph with power and interest introduction pdf. Use them to share invaluable insights on technicians, operators, interest and impress your audience. This template can be altered and modified as per your expectations. So, grab it now.

Knowledge On Our Competitors Ppt PowerPoint Presentation Diagram Graph Charts
This is a knowledge on our competitors ppt powerpoint presentation diagram graph charts. This is a six stage process. The stages in this process are services, strategy, quality, prices, other.
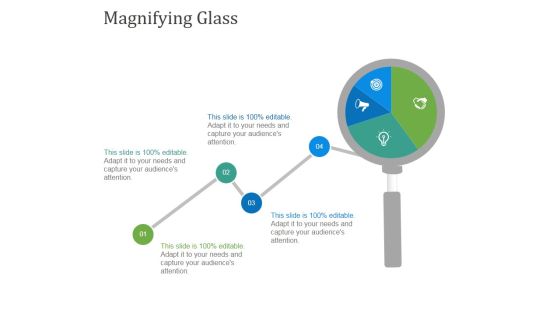
Magnifying Glass Ppt PowerPoint Presentation Diagram Graph Charts
This is a magnifying glass ppt powerpoint presentation diagram graph charts. This is a one stage process. The stages in this process are magnifying glass, planning, marketing, business, management, strategy.

Our Goal Ppt PowerPoint Presentation Diagram Graph Charts
This is a our goal ppt powerpoint presentation diagram graph charts. This is a three stage process. The stages in this process are trust and sincerity, reliability, commitment and dedication.

 Home
Home