Bar Graph
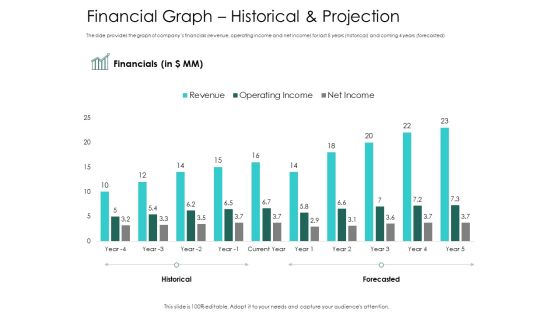
Hybrid Investment Pitch Deck Financial Graph Historical And Projection Ppt Portfolio Design Inspiration PDF
The slide provides the graph of companys financials revenue, operating income and net income for last 5 years historical and coming 4 years forecasted. Deliver an awe inspiring pitch with this creative hybrid investment pitch deck financial graph historical and projection ppt portfolio design inspiration pdf bundle. Topics like financial, revenue, operating income, net income can be discussed with this completely editable template. It is available for immediate download depending on the needs and requirements of the user.

Convertible Debenture Funding Financial Graph Historical And Projection Ppt Professional Themes PDF
The slide provides the graph of companys financials revenue, operating income and net income for the current year and the coming 4 years forecasted. Deliver an awe-inspiring pitch with this creative convertible debenture funding financial graph historical and projection ppt professional themes pdf bundle. Topics like revenue, operating income, net income, forecasted, financials, current year can be discussed with this completely editable template. It is available for immediate download depending on the needs and requirements of the user.
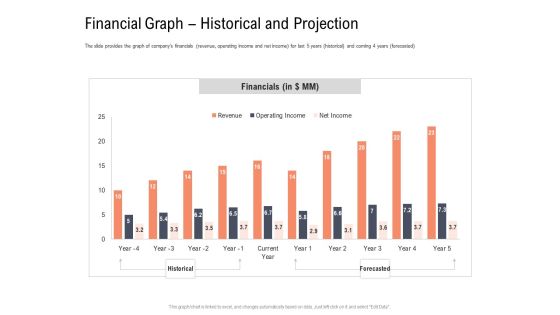
Investor Pitch Deck To Collect Capital From Subordinated Loan Financial Graph Historical And Projection Introduction PDF
The slide provides the graph of companys financials revenue, operating income and net income for last 5 years historical and coming 4 years forecasted. Deliver an awe-inspiring pitch with this creative investor pitch deck to collect capital from subordinated loan financial graph historical and projection introduction pdf bundle. Topics like financials, net income, operating income, revenue, historical, forecasted can be discussed with this completely editable template. It is available for immediate download depending on the needs and requirements of the user.

Convertible Bonds Pitch Deck For Increasing Capitals Financial Graph Historical And Projection Elements PDF
The slide provides the graph of companys financials revenue, operating income and net income for the current year and the coming 4 years forecasted. Deliver an awe-inspiring pitch with this creative convertible bonds pitch deck for increasing capitals financial graph historical and projection elements pdf bundle. Topics like revenue, operating income, net income, forecasted, financials, current year can be discussed with this completely editable template. It is available for immediate download depending on the needs and requirements of the user.
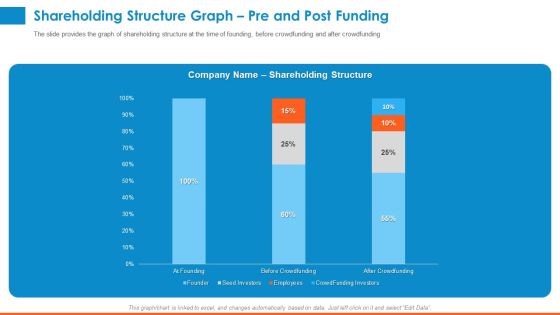
Raising Company Capital From Public Funding Sources Shareholding Structure Graph Pre And Post Funding Diagrams PDF
The slide provides the graph of shareholding structure at the time of founding, before crowdfunding and after crowdfunding. Deliver an awe-inspiring pitch with this creative raising company capital from public funding sources shareholding structure graph pre and post funding diagrams pdf bundle. Topics like founder, seed investors, employees, crowdfunding investors, before crowdfunding, after crowdfunding can be discussed with this completely editable template. It is available for immediate download depending on the needs and requirements of the user.

Convertible Bond Financing Pitch Deck Financial Graph Historical And Projection Slides PDF
The slide provides the graph of companys financials revenue, operating income and net income for the current year and the coming 4 years forecasted. Deliver an awe-inspiring pitch with this creative convertible bond financing pitch deck financial graph historical and projection slides pdf bundle. Topics like revenue, operating income, net income, financial can be discussed with this completely editable template. It is available for immediate download depending on the needs and requirements of the user.
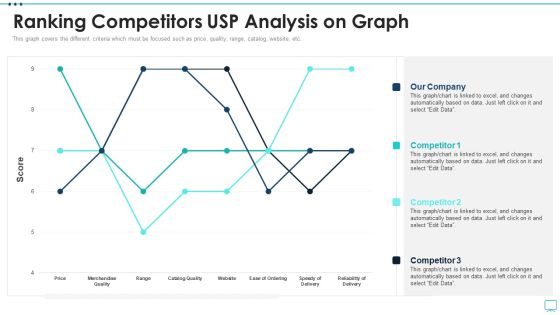
Strategic Business Plan Effective Tools Ranking Competitors USP Analysis On Graph Designs PDF
This graph covers the different criteria which must be focused such as price, quality, range, catalog, website, etc. Deliver and pitch your topic in the best possible manner with this strategic business plan effective tools ranking competitors usp analysis on graph designs pdf. Use them to share invaluable insights on price, merchandise quality, catalog quality, speedy delivery and impress your audience. This template can be altered and modified as per your expectations. So, grab it now.
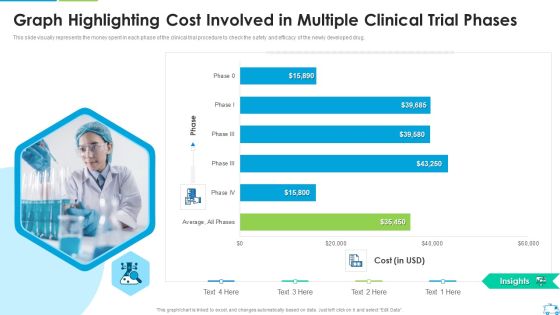
Graph Highlighting Cost Involved In Multiple Clinical Trial Phases Microsoft PDF
This slide visually represents the money spent in each phase of the clinical trial procedure to check the safety and efficacy of the newly developed drug.Deliver an awe inspiring pitch with this creative Graph Highlighting Cost Involved In Multiple Clinical Trial Phases Microsoft PDF bundle. Topics like Graph Highlighting Cost Involved In Multiple Clinical Trial Phases can be discussed with this completely editable template. It is available for immediate download depending on the needs and requirements of the user.
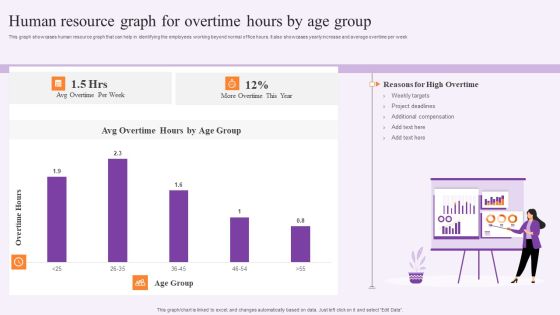
Human Resource Graph For Overtime Hours By Age Group Rules PDF
This graph showcases human resource graph that can help in identifying the employees working beyond normal office hours. It also showcases yearly increase and average overtime per week. Pitch your topic with ease and precision using this Human Resource Graph For Overtime Hours By Age Group Rules PDF. This layout presents information on Weekly Targets, Project Deadlines. It is also available for immediate download and adjustment. So, changes can be made in the color, design, graphics or any other component to create a unique layout.
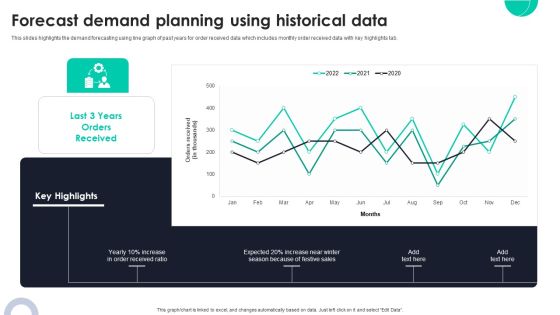
Forecast Demand Planning Using Historical Data Ppt PowerPoint Presentation Diagram Graph Charts PDF
This slides highlights the demand forecasting using line graph of past years for order received data which includes monthly order received data with key highlights tab. Crafting an eye catching presentation has never been more straightforward. Let your presentation shine with this tasteful yet straightforward Forecast Demand Planning Using Historical Data Ppt PowerPoint Presentation Diagram Graph Charts PDF template. It offers a minimalistic and classy look that is great for making a statement. The colors have been employed intelligently to add a bit of playfulness while still remaining professional. Construct the ideal Forecast Demand Planning Using Historical Data Ppt PowerPoint Presentation Diagram Graph Charts PDF that effortlessly grabs the attention of your audience. Begin now and be certain to wow your customers.
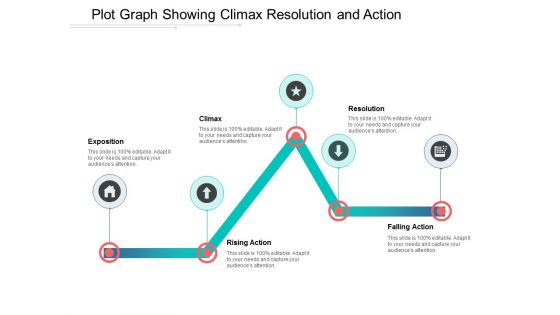
Plot Graph Showing Climax Resolution And Action Ppt Powerpoint Presentation Outline Themes
This is a plot graph showing climax resolution and action ppt powerpoint presentation outline themes. This is a five stage process. The stages in this process are scatter plot, probability plots, plot diagram.
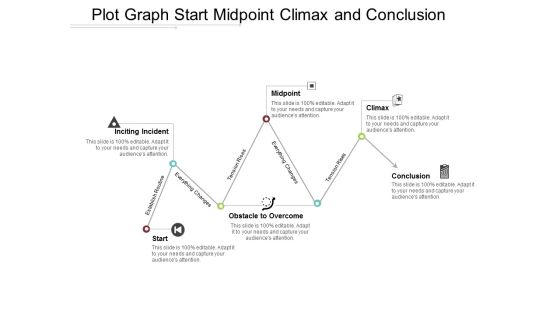
Plot Graph Start Midpoint Climax And Conclusion Ppt Powerpoint Presentation Portfolio Microsoft
This is a plot graph start midpoint climax and conclusion ppt powerpoint presentation portfolio microsoft. This is a six stage process. The stages in this process are scatter plot, probability plots, plot diagram.
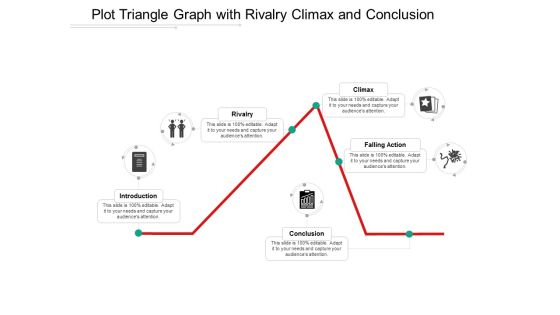
Plot Triangle Graph With Rivalry Climax And Conclusion Ppt Powerpoint Presentation Ideas Design Inspiration
This is a plot triangle graph with rivalry climax and conclusion ppt powerpoint presentation ideas design inspiration. This is a five stage process. The stages in this process are scatter plot, probability plots, plot diagram.

Graph Showing Technical Analysis Of Stock Trading Ppt PowerPoint Presentation Infographic Template Portrait PDF
Presenting this set of slides with name graph showing technical analysis of stock trading ppt powerpoint presentation infographic template portrait pdf. This is a three stage process. The stages in this process are graph showing technical analysis of stock trading. This is a completely editable PowerPoint presentation and is available for immediate download. Download now and impress your audience.

Competition Market Share Analysis Line Graph Ppt PowerPoint Presentation Portfolio Layouts
Presenting this set of slides with name competition market share analysis line graph ppt powerpoint presentation portfolio layouts. The topics discussed in these slides are marketing, business, management, planning, strategy. This is a completely editable PowerPoint presentation and is available for immediate download. Download now and impress your audience.
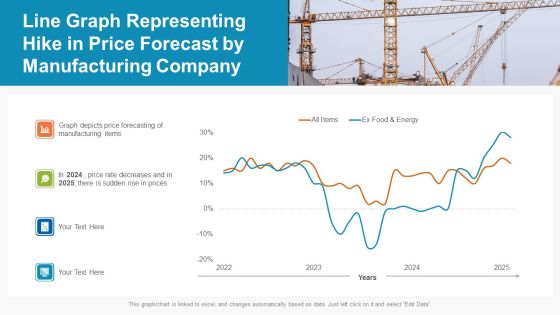
Line Graph Representing Hike In Price Forecast By Manufacturing Company Ppt PowerPoint Presentation File Skills PDF
Pitch your topic with ease and precision using this line graph representing hike in price forecast by manufacturing company ppt powerpoint presentation file skills pdf. This layout presents information on manufacturing, price, price rate decreases. It is also available for immediate download and adjustment. So, changes can be made in the color, design, graphics or any other component to create a unique layout.

Doughnut Graph With Online Employee Recruitment Via Multiple Portals Mockup PDF
This graph or chart is linked to excel, and changes automatically based on data. Just left click on it and select Edit Data. Pitch your topic with ease and precision using this Doughnut Graph With Online Employee Recruitment Via Multiple Portals Mockup PDF. This layout presents information on ABC Employment, Multiple Portals, 2020 To 2022. It is also available for immediate download and adjustment. So, changes can be made in the color, design, graphics or any other component to create a unique layout.
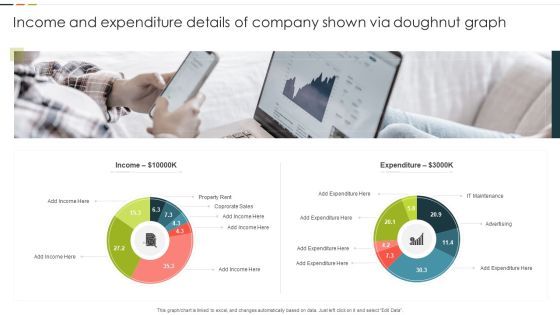
Income And Expenditure Details Of Company Shown Via Doughnut Graph Graphics PDF
This graph or chart is linked to excel, and changes automatically based on data. Just left click on it and select Edit Data. Pitch your topic with ease and precision using this Income And Expenditure Details Of Company Shown Via Doughnut Graph Graphics PDF. This layout presents information on Property Rent, Corporate Sales, Expenditure. It is also available for immediate download and adjustment. So, changes can be made in the color, design, graphics or any other component to create a unique layout.

3d Building Blocks Growing Graph 2 Stages Business Plan PowerPoint Slides
We present our 3d building blocks growing graph 2 stages business plan PowerPoint Slides.Download and present our Flow Charts PowerPoint Templates because Our PowerPoint Templates and Slides will weave a web of your great ideas. They are gauranteed to attract even the most critical of your colleagues. Present our Business PowerPoint Templates because You can Bait your audience with our PowerPoint Templates and Slides. They will bite the hook of your ideas in large numbers. Use our Marketing PowerPoint Templates because You can Be the puppeteer with our PowerPoint Templates and Slides as your strings. Lead your team through the steps of your script. Use our Process and Flows PowerPoint Templates because Our PowerPoint Templates and Slides offer you the needful to organise your thoughts. Use them to list out your views in a logical sequence. Present our Success PowerPoint Templates because Our PowerPoint Templates and Slides are created by a hardworking bunch of busybees. Always flitting around with solutions gauranteed to please.Use these PowerPoint slides for presentations relating to Lego, building, concept, standard, electric, brick, economy, conservation, bar, eco, power, pollution, consumption, render, diagram, electricity, ecology, level, effectiveness, scale, idea, graph, protection, energy, comparison, object, efficiency, chart, protect, efficient, rating, norm, color, toy, friendly, saving, background, environment, ecological, construction, game, block, effective. The prominent colors used in the PowerPoint template are Blue, Red, Gray.
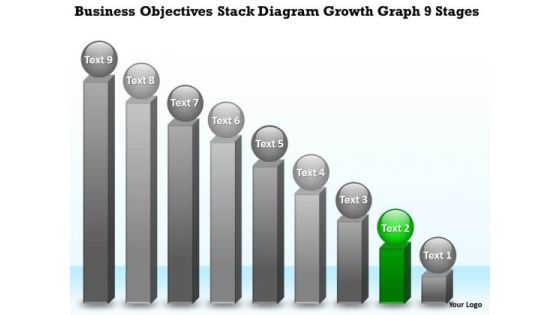
Stack Diagram Growth Graph 9 Stages Small Business Plan PowerPoint Templates
We present our stack diagram growth graph 9 stages small business plan PowerPoint templates.Download our Circle Charts PowerPoint Templates because Our PowerPoint Templates and Slides provide you with a vast range of viable options. Select the appropriate ones and just fill in your text. Download our Process and Flows PowerPoint Templates because It will Give impetus to the hopes of your colleagues. Our PowerPoint Templates and Slides will aid you in winning their trust. Present our Business PowerPoint Templates because Our PowerPoint Templates and Slides will let you Clearly mark the path for others to follow. Present our Success PowerPoint Templates because You can Be the star of the show with our PowerPoint Templates and Slides. Rock the stage with your ideas. Use our Marketing PowerPoint Templates because These PowerPoint Templates and Slides will give the updraft to your ideas. See them soar to great heights with ease.Use these PowerPoint slides for presentations relating to achievement, analyst, analyzing, arrow, aspirations, bar, bull, business, calculating, concepts, currency, development, diagram, dollar, factor, finance, financial, future, graph, graphic, growth, height, horizontal, illustration, improvement, investment, making, marketing, measuring, money, number, positivity, price, progress, savings, sign. The prominent colors used in the PowerPoint template are Green, Gray, Black.

Business Development Program Employee Productivity And Efficiency Graph For Last 5 Years Ideas PDF
The following slide showcases he employees productivity and efficiency graph for last years which shows that employees productivity has declined during this time period because of lack of training programs and high attrition rate. Whether you have daily or monthly meetings, a brilliant presentation is necessary. Business Development Program Employee Productivity And Efficiency Graph For Last 5 Years Ideas PDF can be your best option for delivering a presentation. Represent everything in detail using Business Development Program Employee Productivity And Efficiency Graph For Last 5 Years Ideas PDF and make yourself stand out in meetings. The template is versatile and follows a structure that will cater to your requirements. All the templates prepared by Slidegeeks are easy to download and edit. Our research experts have taken care of the corporate themes as well. So, give it a try and see the results.
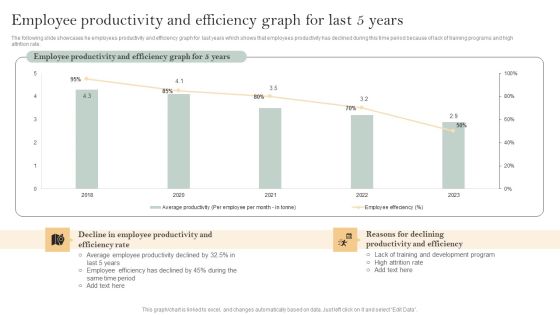
Skill Enhancement Plan Employee Productivity And Efficiency Graph For Last 5 Years Microsoft PDF
The following slide showcases he employees productivity and efficiency graph for last years which shows that employees productivity has declined during this time period because of lack of training programs and high attrition rate. Find highly impressive Skill Enhancement Plan Employee Productivity And Efficiency Graph For Last 5 Years Microsoft PDF on Slidegeeks to deliver a meaningful presentation. You can save an ample amount of time using these presentation templates. No need to worry to prepare everything from scratch because Slidegeeks experts have already done a huge research and work for you. You need to download Skill Enhancement Plan Employee Productivity And Efficiency Graph For Last 5 Years Microsoft PDF for your upcoming presentation. All the presentation templates are 100 percent editable and you can change the color and personalize the content accordingly. Download now
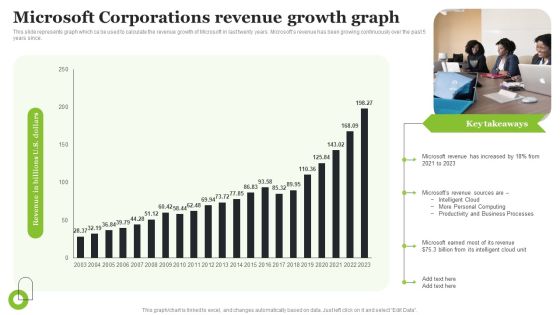
Microsoft Strategic Plan To Become Market Leader Microsoft Corporations Revenue Growth Graph Portrait PDF
This slide represents graph which ca be used to calculate the revenue growth of Microsoft in last twenty years. Microsofts revenue has been growing continuously over the past 5 years since. Whether you have daily or monthly meetings, a brilliant presentation is necessary. Microsoft Strategic Plan To Become Market Leader Microsoft Corporations Revenue Growth Graph Portrait PDF can be your best option for delivering a presentation. Represent everything in detail using Microsoft Strategic Plan To Become Market Leader Microsoft Corporations Revenue Growth Graph Portrait PDF and make yourself stand out in meetings. The template is versatile and follows a structure that will cater to your requirements. All the templates prepared by Slidegeeks are easy to download and edit. Our research experts have taken care of the corporate themes as well. So, give it a try and see the results.

Theme Objectives Stack Diagram Growth Graph 9 Stages Business Plan PowerPoint Slides
We present our theme objectives stack diagram growth graph 9 stages business plan PowerPoint Slides.Download and present our Business PowerPoint Templates because Our PowerPoint Templates and Slides has conjured up a web of all you need with the help of our great team. Use them to string together your glistening ideas. Download and present our Marketing PowerPoint Templates because Our PowerPoint Templates and Slides are effectively colour coded to prioritise your plans They automatically highlight the sequence of events you desire. Present our Process and Flows PowerPoint Templates because Our PowerPoint Templates and Slides will let your ideas bloom. Create a bed of roses for your audience. Download and present our Shapes PowerPoint Templates because Our PowerPoint Templates and Slides are designed to help you succeed. They have all the ingredients you need. Present our Flow Charts PowerPoint Templates because Our PowerPoint Templates and Slides will provide you a launch platform. Give a lift off to your ideas and send them into orbit.Use these PowerPoint slides for presentations relating to Abstract, account, advertise, analyze, bar, business, catalog, chart, circle, circular, concept, data,design,diagram, finance, financial, four, goals, graph, growth, icon, illustration, info-graphic, information, marketing, pie, presentation, professional, profit, sign, success, symbol, vector, web. The prominent colors used in the PowerPoint template are Green, Gray, White.

cost volume profit analysis break even point graph ppt powerpoint presentation professional shapes
This is a cost volume profit analysis break even point graph ppt powerpoint presentation professional shapes. This is a four stage process. The stages in this process are break even point,break even analysis,break even level.

Business Diagram 3d Colorful Pie Graph With Magnifier Data Search PowerPoint Slide
This business slide displays 3d colorful pie graph with magnifier. This diagram is a data visualization tool that gives you a simple way to present statistical information. This slide helps your audience examine and interpret the data you present.

Man Run Up On Graph Business PowerPoint Templates And PowerPoint Backgrounds 0511
Microsoft PowerPoint Template and Background with man moving up on graph chart business growth success finances diagram improvement

Investor Funding Deck For Hybrid Financing Financial Graph Historical And Projection Ppt Layouts Slides PDF
The slide provides the graph of companys financials revenue, operating income and net income for last 5 years historical and coming 4 years forecasted. Deliver and pitch your topic in the best possible manner with this investor funding deck for hybrid financing financial graph historical and projection ppt layouts slides pdf. Use them to share invaluable insights on historical, forecasted, net income, operating income, financial and impress your audience. This template can be altered and modified as per your expectations. So, grab it now.

Investment Pitch To Generating Capital From Mezzanine Credit Financial Graph Historical And Projection Microsoft PDF
The slide provides the graph of companys financials revenue, operating income and net income for last 5 years historical and coming 4 years forecasted. Deliver and pitch your topic in the best possible manner with this investment pitch to generating capital from mezzanine credit financial graph historical and projection microsoft pdf. Use them to share invaluable insights on revenue, operating income, net income, current year, historical, forecasted and impress your audience. This template can be altered and modified as per your expectations. So, grab it now.
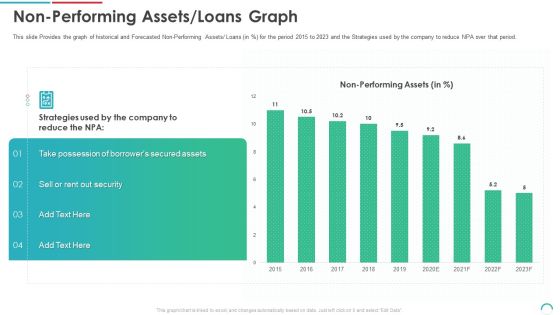
Post Initial Public Offering Equity Financing Pitch Non Performing Assets Loans Graph Infographics PDF
This slide Provides the graph of historical and Forecasted Non-Performing Assets Loans in percent for the period 2015 to 2023 and the Strategies used by the company to reduce NPA over that period. Deliver an awe inspiring pitch with this creative post initial public offering equity financing pitch non performing assets loans graph infographics pdf bundle. Topics like secured assets, performing assets, 2015 to 2023 can be discussed with this completely editable template. It is available for immediate download depending on the needs and requirements of the user.
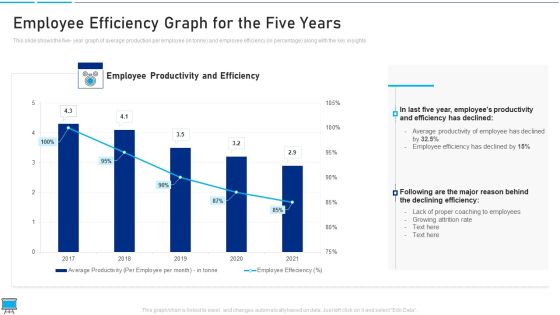
Performance Training Action Plan And Extensive Strategies Employee Efficiency Graph For The Five Years Guidelines PDF
This slide shows the five year graph of average production per employee in tonne and employee efficiency in percentage along with the key insights Deliver and pitch your topic in the best possible manner with this performance training action plan and extensive strategies employee efficiency graph for the five years guidelines pdf Use them to share invaluable insights on declining efficiency, proper coaching to employees, employee efficiency and impress your audience. This template can be altered and modified as per your expectations. So, grab it now.
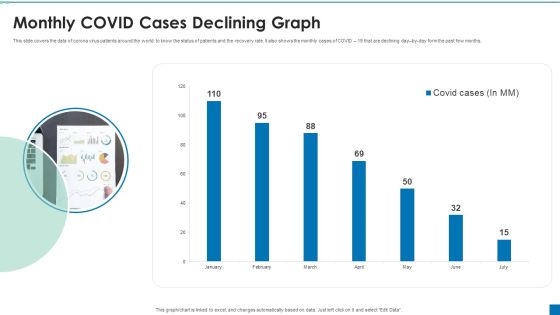
Monthly COVID Cases Declining Graph Ppt PowerPoint Presentation Ideas Slide Portrait PDF
This slide covers the data of corona virus patients around the world to know the status of patients and the recovery rate. It also shows the monthly cases of COVID 19 that are declining day by day form the past few months.Showcasing this set of slides titled Monthly COVID Cases Declining Graph Ppt PowerPoint Presentation Ideas Slide Portrait PDF. The topics addressed in these templates are Monthly Covid Cases, Declining Graph. All the content presented in this PPT design is completely editable. Download it and make adjustments in color, background, font etc. as per your unique business setting.

Monthly Comparison Graph For Operating And Gross Profit Margin Pictures PDF
This slide showcases monthly comparison graph that can help organization to compare the profits margin generated in different months. Its key components are gross, operating and net profit margin. Showcasing this set of slides titled Monthly Comparison Graph For Operating And Gross Profit Margin Pictures PDF. The topics addressed in these templates are Gross Profit Margin, Operating Profit Margin, Net Profit Margin. All the content presented in this PPT design is completely editable. Download it and make adjustments in color, background, font etc. as per your unique business setting.

Actual Vs Budgeted Expenses Graph For Human Resource Activities Guidelines PDF
This slide showcases graph that can help organization to compare the actual and budgeted expenses incurred in conducting human resource activities. Its key components are workplace safety, labour relations, recruitment and employee health. Showcasing this set of slides titled Actual Vs Budgeted Expenses Graph For Human Resource Activities Guidelines PDF. The topics addressed in these templates are Safety Equipment Webinars, Employee, Expenses. All the content presented in this PPT design is completely editable. Download it and make adjustments in color, background, font etc. as per your unique business setting.

Human Resource Graph To Compare Yearly Employee Count By Department Professional PDF
This slide showcases graph that can help organization to compare the yearly change in employees numbers of different departments. It showcases comparison for a period of two years. Showcasing this set of slides titled Human Resource Graph To Compare Yearly Employee Count By Department Professional PDF. The topics addressed in these templates are Marketing Department, Sales Department, Research Department. All the content presented in this PPT design is completely editable. Download it and make adjustments in color, background, font etc. as per your unique business setting.

Graph Highlighting Labor Relation Disputes For Different Years Ppt PowerPoint Presentation Gallery Sample PDF
This slide covers graph which shows strikes and Lockouts from the period of 2017 to 2021. This slide highlights strikes and Lockouts are the top main reasons for poor industrial relations. Showcasing this set of slides titled Graph Highlighting Labor Relation Disputes For Different Years Ppt PowerPoint Presentation Gallery Sample PDF. The topics addressed in these templates are Legends, Strikes, Lockouts. All the content presented in this PPT design is completely editable. Download it and make adjustments in color, background, font etc. as per your unique business setting.

Current And Quick Ratio Comparison Graph For Liquidity Assessment Structure PDF
This slide showcases current and quick ratio graph that can help to evaluate companys liquidity and and assess the company abilities to pay off debt. It also showcases comparison of ratio with previous financial year. Showcasing this set of slides titled Current And Quick Ratio Comparison Graph For Liquidity Assessment Structure PDF. The topics addressed in these templates are Short Term Debt, Delayed Payments, Cash Shortage. All the content presented in this PPT design is completely editable. Download it and make adjustments in color, background, font etc. as per your unique business setting.

Data Driven Economic Facts And Insights Graph For Product Ppt PowerPoint Presentation Pictures Slide Download PDF
Pitch your topic with ease and precision using this data driven economic facts and insights graph for product ppt powerpoint presentation pictures slide download pdf. This layout presents information on year 2021, product, data driven economic. It is also available for immediate download and adjustment. So, changes can be made in the color, design, graphics or any other component to create a unique layout.
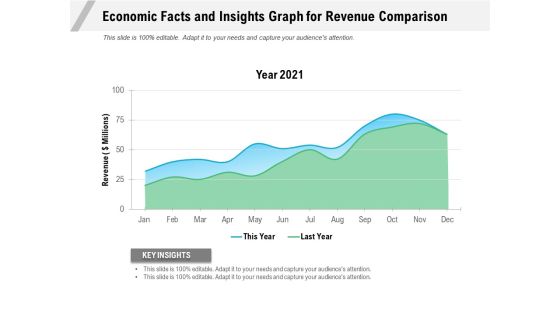
Economic Facts And Insights Graph For Revenue Comparison Ppt PowerPoint Presentation Gallery Portfolio PDF
Pitch your topic with ease and precision using this economic facts and insights graph for revenue comparison ppt powerpoint presentation gallery portfolio pdf. This layout presents information on year 2021, revenue, key insights. It is also available for immediate download and adjustment. So, changes can be made in the color, design, graphics or any other component to create a unique layout.

Stock Photo 3d Ecg Graph And Red Heart For Heart Health Image Graphics For PowerPoint Slide
This exclusive power point image has been designed with graphic of heart in the centre of graph. This graph is can be used as ECG for heart beat. This template is suitable for medical and heart issues related presentations.

Stock Photo 3d Heart Beat Graph For Heart Health Image Graphics For PowerPoint Slide
This exclusive power point image has been designed with graphic of heart in the centre of graph. This graph may be used as ECG for heart beat. This template is suitable for medical and heart issues related presentations.

Oil Barrel With Finance Graph Business PowerPoint Templates And PowerPoint Themes 0812
Oil Barrel With Finance Graph Business PowerPoint Templates And PowerPoint Themes 0812-Microsoft Powerpoint Templates and Background with oil barrels
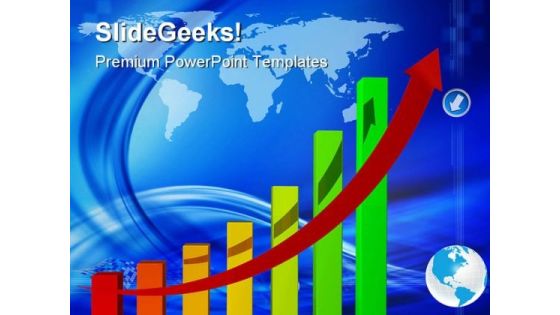
Statistique Of Business Graph Success PowerPoint Templates And PowerPoint Backgrounds 0411
Microsoft PowerPoint Template and Background with rainbow colored financial graph showing strong growth all the way up

Businessman Standing On Graph Success PowerPoint Templates And PowerPoint Backgrounds 0511
Microsoft PowerPoint Template and Background with a 3d image of happy businessman which stands on the top of higher graph
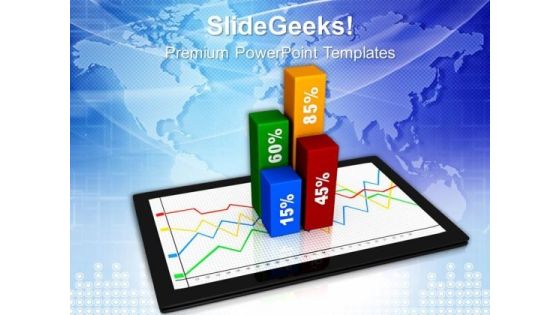
Graph On Ipad Business Growth PowerPoint Templates And PowerPoint Themes 1012
Graph On Ipad Business Growth PowerPoint Templates And PowerPoint Themes 1012-Microsoft Powerpoint Templates and Background with ipad showing success graph-Graph On Ipad Business Growth PowerPoint Templates And PowerPoint Themes 1012-This PowerPoint template can be used for presentations relating to-Ipad showing success graph, business, success, technology, finance, marketing

Graph Of Products Sale Business PowerPoint Templates And PowerPoint Themes 0912
Graph Of Products Sale Business PowerPoint Templates And PowerPoint Themes Presentations-Microsoft Powerpoint Templates and Background with graph of products sale-Graph Of Products Sale Business PowerPoint Templates And PowerPoint Themes PresentationsThis PPT can be used for presentations relating to-Graph of products sale, business, cylinders, success, finance, shapes

Waterfall Graph Showing Births Deaths And Population Change Ppt PowerPoint Presentation Infographic Template Visual Aids
This is a waterfall graph showing births deaths and population change ppt powerpoint presentation infographic template visual aids. This is a three stage process. The stages in this process are profit and loss, balance sheet, income statement, benefit and loss.
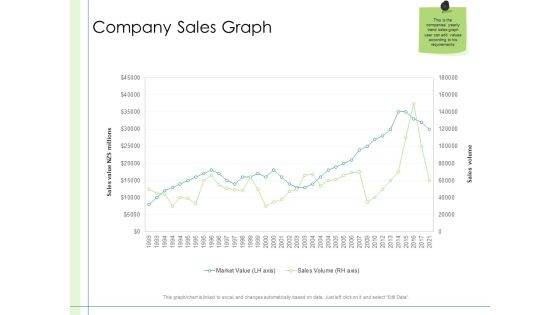
In Depth Business Assessment Company Sales Graph Ppt PowerPoint Presentation Layouts Design Templates PDF
Deliver an awe-inspiring pitch with this creative in depth business assessment company sales graph ppt powerpoint presentation layouts design templates pdf bundle. Topics like market value, sales volume can be discussed with this completely editable template. It is available for immediate download depending on the needs and requirements of the user.

Asset Turnover Ratio Graph Ppt PowerPoint Presentation Outline Graphics Template PDF
Presenting this set of slides with name asset turnover ratio graph ppt powerpoint presentation outline graphics template pdf. The topics discussed in these slides are brand a equity to asset ratio, brand b equity to asset ratio, brand c equity to asset ratio. This is a completely editable PowerPoint presentation and is available for immediate download. Download now and impress your audience.

Business Sales Graph With Target Per Sales Representation Ppt PowerPoint Presentation Gallery Templates PDF
Presenting this set of slides with name business sales graph with target per sales representation ppt powerpoint presentation gallery templates pdf. The topics discussed in these slides are revenue, sales, target. This is a completely editable PowerPoint presentation and is available for immediate download. Download now and impress your audience.
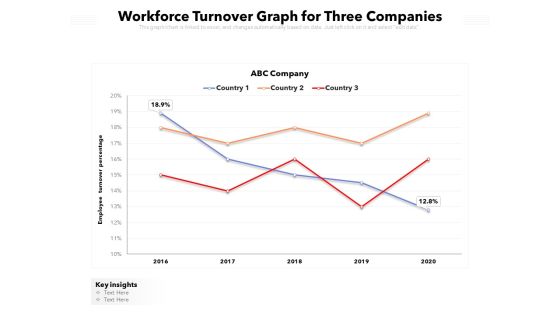
Workforce Turnover Graph For Three Companies Ppt PowerPoint Presentation Infographic Template Visuals PDF
Presenting this set of slides with name workforce turnover graph for three companies ppt powerpoint presentation infographic template visuals pdf. The topics discussed in these slides are key insights, 2016 to 2020, employee turnover percentage. This is a completely editable PowerPoint presentation and is available for immediate download. Download now and impress your audience.

High And Low Levels Adoption Graph Ppt PowerPoint Presentation Gallery Inspiration PDF
Showcasing this set of slides titled high and low levels adoption graph ppt powerpoint presentation gallery inspiration pdf. The topics addressed in these templates are high, mean, low. All the content presented in this PPT design is completely editable. Download it and make ajustments in color, background, font etc. as per your unique business setting.

Sprint Burndown Complexity Graph With Effort Time And Tasks Ppt PowerPoint Presentation File Visuals PDF
Showcasing this set of slides titled sprint burndown complexity graph with effort time and tasks ppt powerpoint presentation file visuals pdf. The topics addressed in these templates are effort, tasks, time. All the content presented in this PPT design is completely editable. Download it and make ajustments in color, background, font etc. as per your unique business setting.

Downturn Graph Indicating Business Share Value Decline Ppt PowerPoint Presentation Professional Elements PDF
Showcasing this set of slides titled downturn graph indicating business share value decline ppt powerpoint presentation professional elements pdf. The topics addressed in these templates are per share value, 2016 to 2020. All the content presented in this PPT design is completely editable. Download it and make adjustments in color, background, font etc. as per your unique business setting.

Downturn Graph Indicating Reduction In Carbon Omission Ppt PowerPoint Presentation Outline Inspiration PDF
Showcasing this set of slides titled downturn graph indicating reduction in carbon omission ppt powerpoint presentation outline inspiration pdf. The topics addressed in these templates are carbon omission, year, 2015 to 2020. All the content presented in this PPT design is completely editable. Download it and make adjustments in color, background, font etc. as per your unique business setting.
Startup Pitch To Raise Capital From Crowdfunding Shareholding Structure Graph Pre And Post Funding Icons PDF
Deliver an awe-inspiring pitch with this creative startup pitch to raise capital from crowdfunding shareholding structure graph pre and post funding icons pdf bundle. Topics like founder, employee, seed investors, crowdfunding investors can be discussed with this completely editable template. It is available for immediate download depending on the needs and requirements of the user.
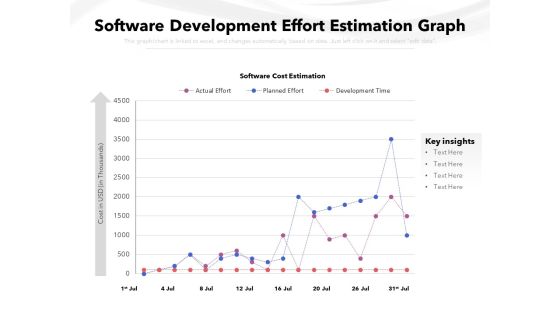
Software Development Effort Estimation Graph Ppt PowerPoint Presentation Styles Show PDF
Showcasing this set of slides titled software development effort estimation graph ppt powerpoint presentation styles show pdf. The topics addressed in these templates are key insights, cost, software cost estimation, actual effort, planned effort, development time. All the content presented in this PPT design is completely editable. Download it and make adjustments in color, background, font etc. as per your unique business setting.

Convertible Market Notes Financial Graph Historical And Projection Ppt Summary Show PDF
Deliver an awe inspiring pitch with this creative convertible market notes financial graph historical and projection ppt summary show pdf bundle. Topics like revenue, operating income, net income, financial can be discussed with this completely editable template. It is available for immediate download depending on the needs and requirements of the user.
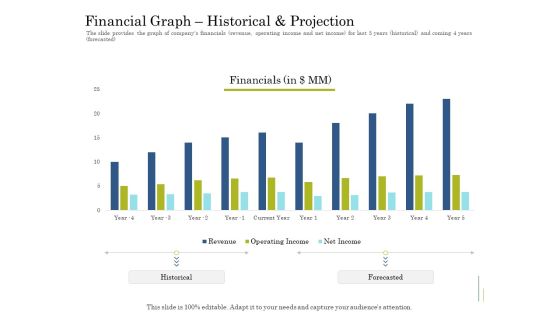
Supplementary Debt Financing Pitch Deck Financial Graph Historical And Projection Brochure PDF
Deliver an awe inspiring pitch with this creative supplementary debt financing pitch deck financial graph historical and projection brochure pdf bundle. Topics like financial, revenue, operating income, net income can be discussed with this completely editable template. It is available for immediate download depending on the needs and requirements of the user.

Business Assessment Outline Company Sales Graph Ppt Inspiration Graphics Example PDF
Deliver an awe-inspiring pitch with this creative business assessment outline company sales graph ppt inspiration graphics example pdf bundle. Topics like market value, sales volume can be discussed with this completely editable template. It is available for immediate download depending on the needs and requirements of the user.
Profit Margin Growth Graph With Percentage Ratio Ppt PowerPoint Presentation Professional Icon PDF
Showcasing this set of slides titled profit margin growth graph with percentage ratio ppt powerpoint presentation professional icon pdf. The topics addressed in these templates are profit margin per sale, target per sales rep, 2017 to 2027. All the content presented in this PPT design is completely editable. Download it and make adjustments in color, background, font etc. as per your unique business setting.

Convertible Debt Financing Pitch Deck Financial Graph Historical And Projection Clipart PDF
Deliver an awe-inspiring pitch with this creative convertible debt financing pitch deck financial graph historical and projection clipart pdf bundle. Topics like revenue, operating income, net income can be discussed with this completely editable template. It is available for immediate download depending on the needs and requirements of the user.
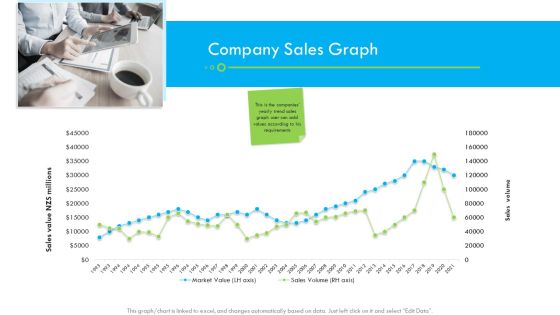
Enterprise Tactical Planning Company Sales Graph Ppt Portfolio Design Inspiration PDF
Deliver an awe-inspiring pitch with this creative enterprise tactical planning company sales graph ppt portfolio design inspiration pdf bundle. Topics like market volume, sales volume can be discussed with this completely editable template. It is available for immediate download depending on the needs and requirements of the user.
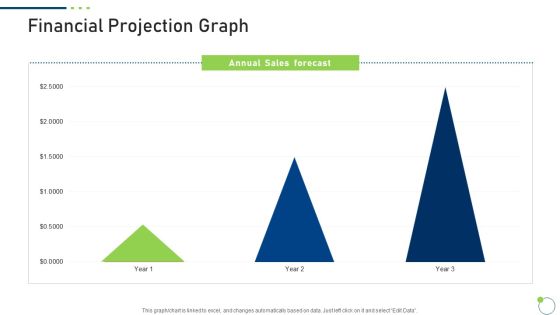
Investor Pitch Deck New Venture Capital Raising Financial Projection Graph Slide2 Portrait PDF
Deliver and pitch your topic in the best possible manner with this investor pitch deck new venture capital raising financial projection graph slide2 portrait pdf. Use them to share invaluable insights on annual sales, gross margin, net profit and impress your audience. This template can be altered and modified as per your expectations. So, grab it now.
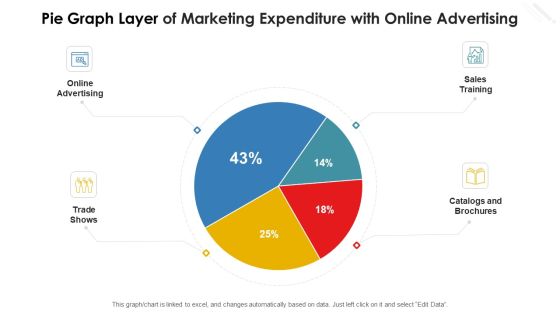
Pie Graph Layer Of Marketing Expenditure With Online Advertising Graphics PDF
Showcasing this set of slides titled pie graph layer of marketing expenditure with online advertising graphics pdf. The topics addressed in these templates are online advertising, trade shows, catalogs and brochures, sales training. All the content presented in this PPT design is completely editable. Download it and make adjustments in color, background, font etc. as per your unique business setting.

Annual Human Resource Report With Employee Hiring And Promotion Graph Mockup PDF
This slide showcases HR report and graph that can help organization to identify number of of employees demoted and promoted in the company. It showcases comparison for a period of last three years. Pitch your topic with ease and precision using this Annual Human Resource Report With Employee Hiring And Promotion Graph Mockup PDF. This layout presents information on Technology, Product, Employees. It is also available for immediate download and adjustment. So, changes can be made in the color, design, graphics or any other component to create a unique layout.

E Commerce Business Sales Monthly Forecast Graph Ppt Infographics Show PDF
This slide shows the table and graph representing monthly sales forecast of an e-commerce business. It shows details related to the expected growth rate, historical data, projected data and actual growth of sales. Pitch your topic with ease and precision using this E Commerce Business Sales Monthly Forecast Graph Ppt Infographics Show PDF. This layout presents information on Expected Growth Rate, Historical, Actual Growth Rate. It is also available for immediate download and adjustment. So, changes can be made in the color, design, graphics or any other component to create a unique layout.

Corporate Training Program Employee Productivity And Efficiency Graph For Last 5 Years Elements PDF
The following slide showcases he employees productivity and efficiency graph for last years which shows that employees productivity has declined during this time period because of lack of training programs and high attrition rate. Make sure to capture your audiences attention in your business displays with our gratis customizable Corporate Training Program Employee Productivity And Efficiency Graph For Last 5 Years Elements PDF. These are great for business strategies, office conferences, capital raising or task suggestions. If you desire to acquire more customers for your tech business and ensure they stay satisfied, create your own sales presentation with these plain slides.

Man Run Up On Graph Business PowerPoint Themes And PowerPoint Slides 0511
Microsoft PowerPoint Slide and Theme with man moving up on graph chart business growth success finances diagram improvement
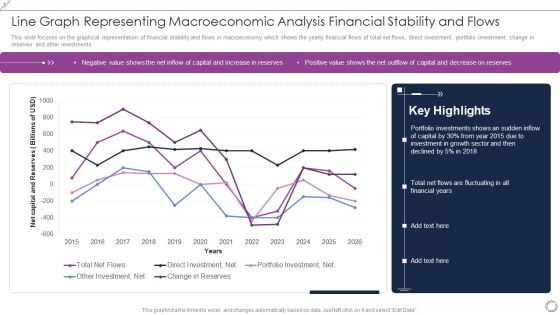
Line Graph Representing Macroeconomic Analysis Financial Stability And Flows Rules PDF
This slide focuses on the graphical representation of financial stability and flows in macroeconomy which shows the yearly financial flows of total net flows, direct investment, portfolio investment, change in reserves and other investments. Showcasing this set of slides titled Line Graph Representing Macroeconomic Analysis Financial Stability And Flows Rules PDF. The topics addressed in these templates are Total Net Flows, Direct Investment, Net, Portfolio Investment, Net. All the content presented in this PPT design is completely editable. Download it and make adjustments in color, background, font etc. as per your unique business setting.
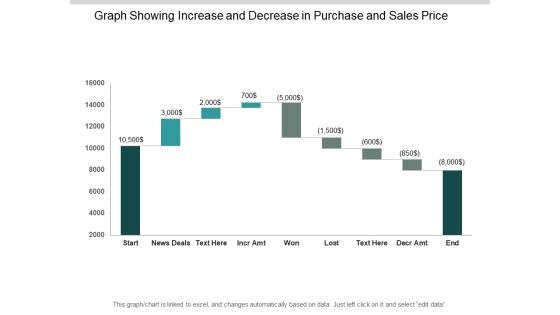
Graph Showing Increase And Decrease In Purchase And Sales Price Ppt PowerPoint Presentation Outline Gallery
This is a graph showing increase and decrease in purchase and sales price ppt powerpoint presentation outline gallery. This is a nine stage process. The stages in this process are sales waterfall, waterfall chart, business.

Sales Graph Showing Payouts Losses And Wins Ppt PowerPoint Presentation Pictures Designs Download
This is a sales graph showing payouts losses and wins ppt powerpoint presentation pictures designs download. This is a eight stage process. The stages in this process are sales waterfall, waterfall chart, business.

Waterfall Graph For Income And Expense Analysis Ppt PowerPoint Presentation File Deck
This is a waterfall graph for income and expense analysis ppt powerpoint presentation file deck. This is a eight stage process. The stages in this process are sales waterfall, waterfall chart, business.

Area Graph Showing Sales Trends Over Time Ppt PowerPoint Presentation Model Background Designs
This is a area graph showing sales trends over time ppt powerpoint presentation model background designs. This is a three stage process. The stages in this process are financial analysis, quantitative, statistical modelling.
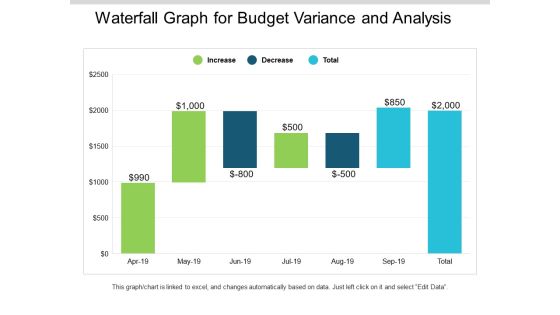
Waterfall Graph For Budget Variance And Analysis Ppt PowerPoint Presentation Slides Mockup
This is a waterfall graph for budget variance and analysis ppt powerpoint presentation slides mockup. This is a three stage process. The stages in this process are profit and loss, balance sheet, income statement, benefit and loss.

Waterfall Graph Showing Net Sales And Gross Profit Ppt PowerPoint Presentation Infographics Format
This is a waterfall graph showing net sales and gross profit ppt powerpoint presentation infographics format. This is a three stage process. The stages in this process are profit and loss, balance sheet, income statement, benefit and loss.
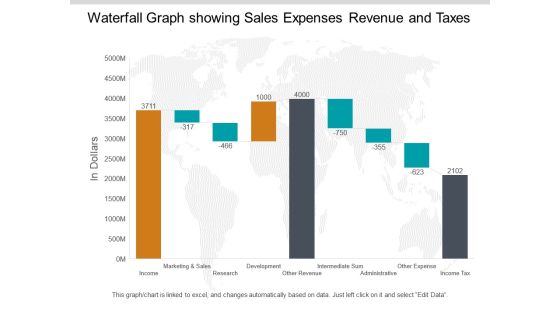
Waterfall Graph Showing Sales Expenses Revenue And Taxes Ppt PowerPoint Presentation Pictures Summary
This is a waterfall graph showing sales expenses revenue and taxes ppt powerpoint presentation pictures summary. This is a three stage process. The stages in this process are profit and loss, balance sheet, income statement, benefit and loss.

Waterfall Graph Summarize Budget 2018 To 2019 Ppt PowerPoint Presentation Summary Slides
This is a waterfall graph summarize budget 2018 to 2019 ppt powerpoint presentation summary slides. This is a three stage process. The stages in this process are profit and loss, balance sheet, income statement, benefit and loss.
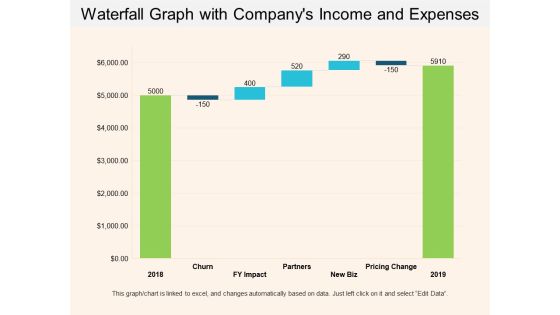
Waterfall Graph With Companys Income And Expenses Ppt PowerPoint Presentation Show Example Introduction
This is a waterfall graph with companys income and expenses ppt powerpoint presentation show example introduction. This is a three stage process. The stages in this process are profit and loss, balance sheet, income statement, benefit and loss.

Waterfall Graph With Monthly Expenses And Savings Ppt PowerPoint Presentation Layouts Clipart Images
This is a waterfall graph with monthly expenses and savings ppt powerpoint presentation layouts clipart images. This is a three stage process. The stages in this process are profit and loss, balance sheet, income statement, benefit and loss.
Pareto Graph Of Consumer Assessment For Business Performance Ppt PowerPoint Presentation Icon Inspiration PDF
Presenting this set of slides with name pareto graph of consumer assessment for business performance ppt powerpoint presentation icon inspiration pdf. The topics discussed in these slides are customer, product, market, pareto chart, sales, value. This is a completely editable PowerPoint presentation and is available for immediate download. Download now and impress your audience.
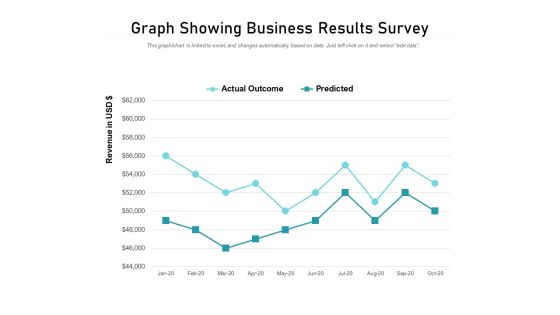
Graph Showing Business Results Survey Ppt PowerPoint Presentation Summary Slide Portrait
Presenting this set of slides with name graph showing business results survey ppt powerpoint presentation summary slide portrait. The topics discussed in these slides are actual outcomes, predicted. This is a completely editable PowerPoint presentation and is available for immediate download. Download now and impress your audience.
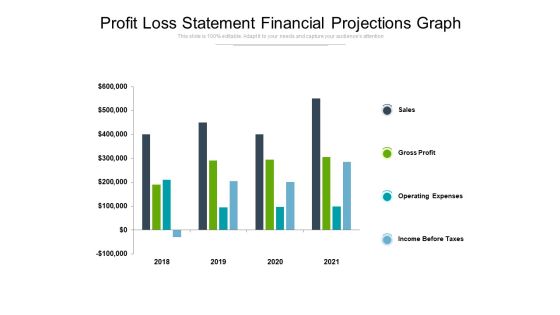
Profit Loss Statement Financial Projections Graph Ppt PowerPoint Presentation Summary Slides
Presenting this set of slides with name profit loss statement financial projections graph ppt powerpoint presentation summary slides. The topics discussed in these slides are sales, gross profit, operating expenses, income before taxes. This is a completely editable PowerPoint presentation and is available for immediate download. Download now and impress your audience.

Current Ratio Interpretation And Analysis Graph Ppt PowerPoint Presentation Outline Inspiration PDF
Presenting this set of slides with name current ratio interpretation and analysis graph ppt powerpoint presentation outline inspiration pdf. The topics discussed in these slides are current ration, quick ration. This is a completely editable PowerPoint presentation and is available for immediate download. Download now and impress your audience.
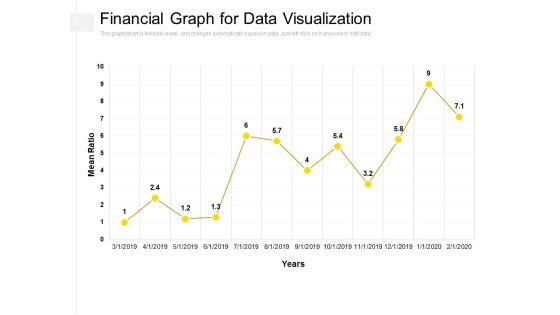
Financial Graph For Data Visualization Ppt PowerPoint Presentation Slides Picture PDF
Presenting this set of slides with name financial graph for data visualization ppt powerpoint presentation slides picture pdf. The topics discussed in these slides are mean ration, year. This is a completely editable PowerPoint presentation and is available for immediate download. Download now and impress your audience.
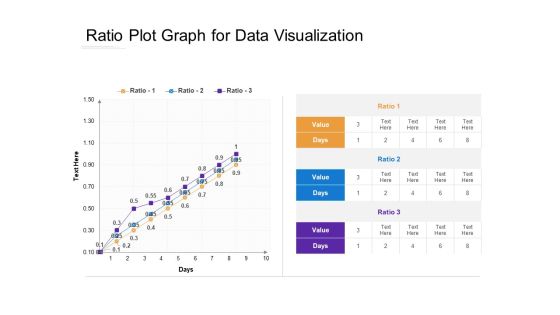
Ratio Plot Graph For Data Visualization Ppt PowerPoint Presentation Ideas Outfit PDF
Presenting this set of slides with name ratio plot graph for data visualization ppt powerpoint presentation ideas outfit pdf. The topics discussed in these slides are ratio, value, days. This is a completely editable PowerPoint presentation and is available for immediate download. Download now and impress your audience.
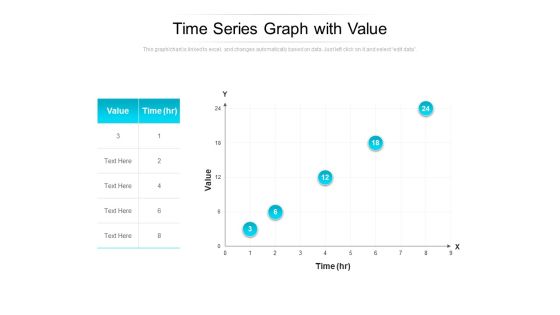
Time Series Graph With Value Ppt PowerPoint Presentation Pictures Graphics Example PDF
Presenting this set of slides with name time series graph with value ppt powerpoint presentation pictures graphics example pdf. The topics discussed in these slides are value, time. This is a completely editable PowerPoint presentation and is available for immediate download. Download now and impress your audience.
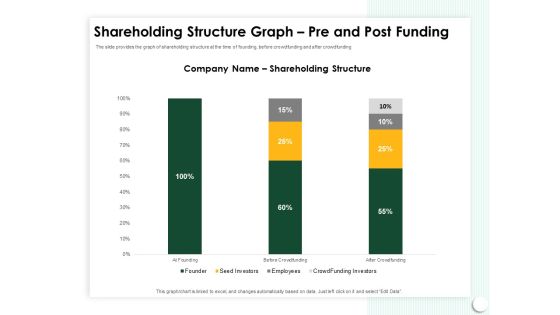
Startup Presentation For Collaborative Capital Funding Shareholding Structure Graph Pre And Post Funding Background PDF
Presenting this set of slides with name startup presentation for collaborative capital funding shareholding structure graph pre and post funding background pdf. The topics discussed in these slides are employee, shareholding structure, seed investors, crowd funding investors. This is a completely editable PowerPoint presentation and is available for immediate download. Download now and impress your audience.
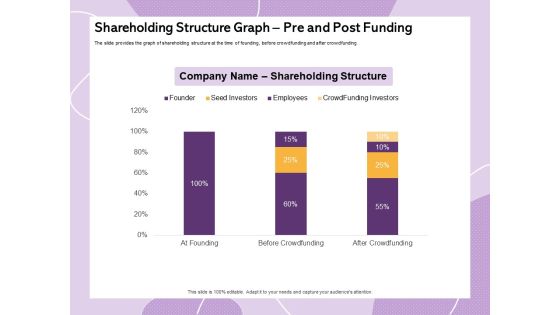
Investor Presentation For Society Funding Shareholding Structure Graph Pre And Post Funding Elements PDF
Presenting this set of slides with name investor presentation for society funding shareholding structure graph pre and post funding elements pdf. The topics discussed in these slides are before funding, after funding, value shares, investor. This is a completely editable PowerPoint presentation and is available for immediate download. Download now and impress your audience.
Gross And Net Revenue Comparison Shown By Graph Ppt PowerPoint Presentation File Icons PDF
Presenting this set of slides with name gross and net revenue comparison shown by graph ppt powerpoint presentation file icons pdf. The topics discussed in these slides are gross profit, net profit. This is a completely editable PowerPoint presentation and is available for immediate download. Download now and impress your audience.

Customer Relationship Management In Freehold Property Shareholding Structure Graph Pre And Post Funding Elements PDF
Presenting this set of slides with name customer relationship management in freehold property shareholding structure graph pre and post funding elements pdf. The topics discussed in these slides are employee, shareholding structure, seed investors, crowd funding investors. This is a completely editable PowerPoint presentation and is available for immediate download. Download now and impress your audience.

Annual Construction Expenses Graph Ppt PowerPoint Presentation Portfolio Slide Download PDF
Presenting this set of slides with name annual construction expenses graph ppt powerpoint presentation portfolio slide download pdf. The topics discussed in these slides are cost, actual, forecost, 2020. This is a completely editable PowerPoint presentation and is available for immediate download. Download now and impress your audience.

Fill Backorder Hours Analysis Graph Ppt PowerPoint Presentation Summary Example File PDF
Presenting this set of slides with name fill backorder hours analysis graph ppt powerpoint presentation summary example file pdf. The topics discussed in these slides are initial fill rates, hour to fill an order, analysis. This is a completely editable PowerPoint presentation and is available for immediate download. Download now and impress your audience.
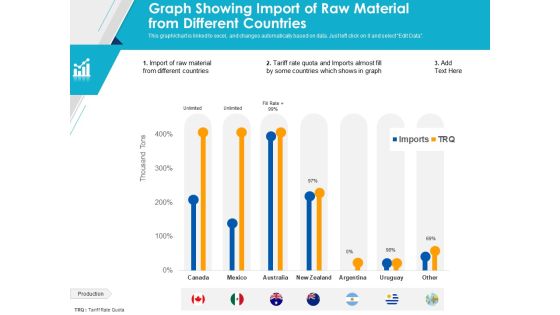
Graph Showing Import Of Raw Material From Different Countries Ppt PowerPoint Presentation Styles Slides PDF
Presenting this set of slides with name graph showing import of raw material from different countries ppt powerpoint presentation styles slides pdf. The topics discussed in these slides are raw material, production, tqr. This is a completely editable PowerPoint presentation and is available for immediate download. Download now and impress your audience.

Graph Showing Claims By Months And Quarters Ppt PowerPoint Presentation Ideas Outline PDF
Presenting this set of slides with name graph showing claims by months and quarters ppt powerpoint presentation ideas outline pdf. The topics discussed in these slides are total claims in quarter, total claims per month, business, life insurance, property, auto. This is a completely editable PowerPoint presentation and is available for immediate download. Download now and impress your audience.

Quarterly Product Sales Analysis Graph Ppt PowerPoint Presentation Portfolio Slide Download PDF
Presenting this set of slides with name quarterly product sales analysis graph ppt powerpoint presentation portfolio slide download pdf. The topics discussed in these slides are product sales, market segment, total sales, number of products sold, year 2020. This is a completely editable PowerPoint presentation and is available for immediate download. Download now and impress your audience.
Online Business Website Competitive Assessment Graph Ppt PowerPoint Presentation Icon Topics PDF
Presenting this set of slides with name online business website competitive assessment graph ppt powerpoint presentation icon topics pdf. The topics discussed in these slides are visitors, purchase, user visiting again, competitor. This is a completely editable PowerPoint presentation and is available for immediate download. Download now and impress your audience.
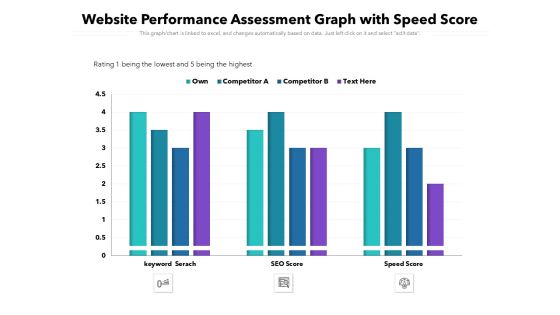
Website Performance Assessment Graph With Speed Score Ppt PowerPoint Presentation Layouts Display
Presenting this set of slides with name website performance assessment graph with speed score ppt powerpoint presentation layouts display. The topics discussed in these slides are keyword search, seo score, speed score, own, competitor. This is a completely editable PowerPoint presentation and is available for immediate download. Download now and impress your audience.

Region Wise Product Sales Graph Ppt PowerPoint Presentation Styles Layout Ideas PDF
Presenting this set of slides with name region wise product sales graph ppt powerpoint presentation styles layout ideas pdf. The topics discussed in these slides are country name ghi country, product name mno product, product sales, 2019, 2020. This is a completely editable PowerPoint presentation and is available for immediate download. Download now and impress your audience.

Business Employee Turnover Graph With New Joiners And Resigned Employees Ppt PowerPoint Presentation Summary Backgrounds PDF
Presenting this set of slides with name business employee turnover graph with new joiners and resigned employees ppt powerpoint presentation summary backgrounds pdf. The topics discussed in these slides are human resource, client servicing, it, marketing, sales, purchase. This is a completely editable PowerPoint presentation and is available for immediate download. Download now and impress your audience.
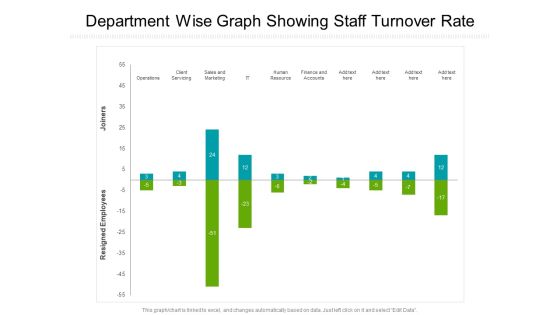
Department Wise Graph Showing Staff Turnover Rate Ppt PowerPoint Presentation Gallery Outfit PDF
Presenting this set of slides with name department wise graph showing staff turnover rate ppt powerpoint presentation gallery outfit pdf. The topics discussed in these slides are operations, client servicing, sales and marketing, it, human resource, finance and accounts. This is a completely editable PowerPoint presentation and is available for immediate download. Download now and impress your audience.
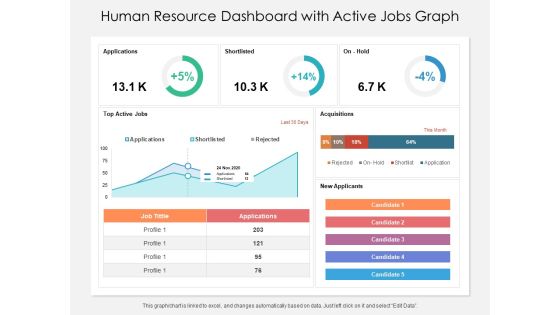
Human Resource Dashboard With Active Jobs Graph Ppt PowerPoint Presentation File Influencers PDF
Presenting this set of slides with name human resource dashboard with active jobs graph ppt powerpoint presentation file influencers pdf. The topics discussed in these slides are acquisitions, applications, shortlisted. This is a completely editable PowerPoint presentation and is available for immediate download. Download now and impress your audience.
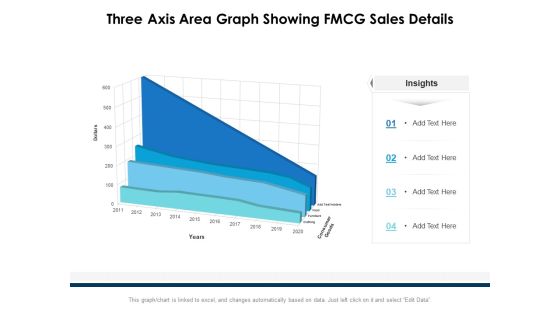
Three Axis Area Graph Showing FMCG Sales Details Ppt PowerPoint Presentation Ideas Layouts PDF
Presenting this set of slides with name three axis area graph showing fmcg sales details ppt powerpoint presentation ideas layouts pdf. The topics discussed in these slides are consumer goods, dollars, 2011 to 2020. This is a completely editable PowerPoint presentation and is available for immediate download. Download now and impress your audience.
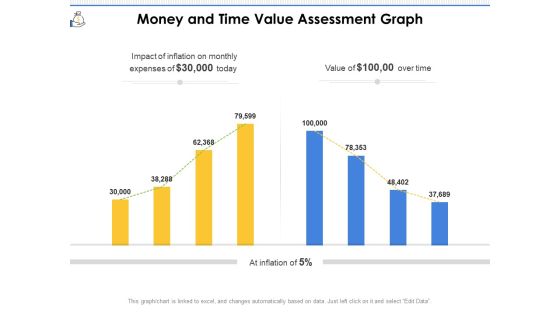
Money And Time Value Assessment Graph Ppt PowerPoint Presentation File Outline PDF
Presenting this set of slides with name money and time value assessment graph ppt powerpoint presentation file outline pdf. The topics discussed in these slides are inflation, expenses, value. This is a completely editable PowerPoint presentation and is available for immediate download. Download now and impress your audience.
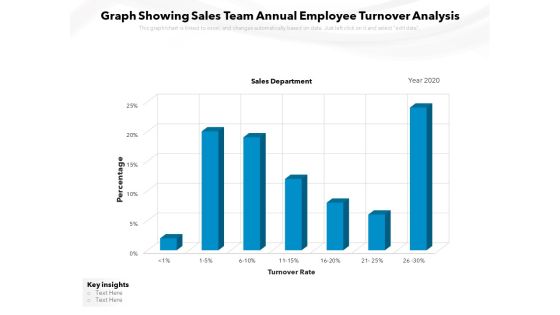
Graph Showing Sales Team Annual Employee Turnover Analysis Ppt PowerPoint Presentation Ideas PDF
Presenting this set of slides with name graph showing sales team annual employee turnover analysis ppt powerpoint presentation ideas pdf. The topics discussed in these slides are sales department, turnover rate, percentage, key insights, 2020. This is a completely editable PowerPoint presentation and is available for immediate download. Download now and impress your audience.

Burndown Graph With Actual And Ideal Hours Ppt PowerPoint Presentation Ideas Example Topics PDF
Presenting this set of slides with name burndown graph with actual and ideal hours ppt powerpoint presentation ideas example topics pdf. The topics discussed in these slides are efforts remaining, reduced work efforts till the day, team. This is a completely editable PowerPoint presentation and is available for immediate download. Download now and impress your audience.

Burndown Graph With Actual Time Remaining Ppt PowerPoint Presentation Styles Professional PDF
Presenting this set of slides with name burndown graph with actual time remaining ppt powerpoint presentation styles professional pdf. The topics discussed in these slides are estimated time remaining, actual time remaining, series. This is a completely editable PowerPoint presentation and is available for immediate download. Download now and impress your audience.

Burndown Graph With Remaining And Completed Tasks Ppt PowerPoint Presentation Icon Show PDF
Presenting this set of slides with name burndown graph with remaining and completed tasks ppt powerpoint presentation icon show pdf. The topics discussed in these slides are task completed, efforts remained, ideal burndown, task remained. This is a completely editable PowerPoint presentation and is available for immediate download. Download now and impress your audience.

Burndown Graph With Sprints And Story Points Ppt PowerPoint Presentation Layouts Professional PDF
Presenting this set of slides with name burndown graph with sprints and story points ppt powerpoint presentation layouts professional pdf. The topics discussed in these slides are actual, average, high, low. This is a completely editable PowerPoint presentation and is available for immediate download. Download now and impress your audience.

Iteration Burndown Graph With Story Points Ppt PowerPoint Presentation Model Background Images PDF
Presenting this set of slides with name iteration burndown graph with story points ppt powerpoint presentation model background images pdf. The topics discussed in these slides are team velocity, story points, series, work remaining. This is a completely editable PowerPoint presentation and is available for immediate download. Download now and impress your audience.
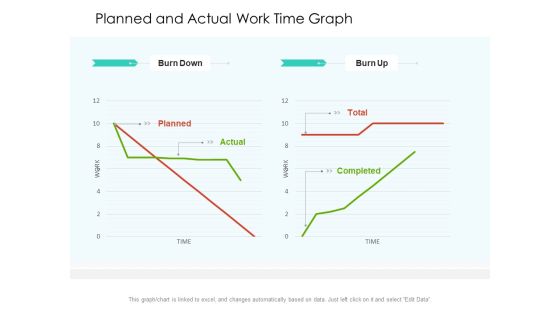
Planned And Actual Work Time Graph Ppt PowerPoint Presentation Layouts Master Slide PDF
Presenting this set of slides with name planned and actual work time graph ppt powerpoint presentation layouts master slide pdf. The topics discussed in these slides are burn down, burn up, planned, actual, completed, time, work. This is a completely editable PowerPoint presentation and is available for immediate download. Download now and impress your audience.
Release Burndown Graph With Target Work To Be Done Ppt PowerPoint Presentation Icon Slideshow PDF
Presenting this set of slides with name release burndown graph with target work to be done ppt powerpoint presentation icon slideshow pdf. The topics discussed in these slides are behind schedule, ahead of schedule, target work, completed work. This is a completely editable PowerPoint presentation and is available for immediate download. Download now and impress your audience.

Business Growth S Curve Graph Ppt PowerPoint Presentation Portfolio Images PDF
Presenting this set of slides with name business growth s curve graph ppt powerpoint presentation portfolio images pdf. The topics discussed in these slides are progress plan, progress actual, eac equivalent annual budget. This is a completely editable PowerPoint presentation and is available for immediate download. Download now and impress your audience.
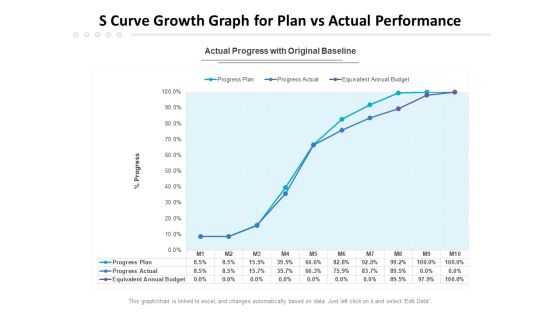
S Curve Growth Graph For Plan Vs Actual Performance Ppt PowerPoint Presentation Show Layouts PDF
Presenting this set of slides with name s curve growth graph for plan vs actual performance ppt powerpoint presentation show layouts pdf. The topics discussed in these slides are progress plan, progress actual, equivalent annual budget. This is a completely editable PowerPoint presentation and is available for immediate download. Download now and impress your audience.

Monthly Sales Growth Graph Of A Business Ppt PowerPoint Presentation Ideas File Formats PDF
Presenting this set of slides with name monthly sales growth graph of a business ppt powerpoint presentation ideas file formats pdf. The topics discussed in these slides are sales growth, cumulative sales year. This is a completely editable PowerPoint presentation and is available for immediate download. Download now and impress your audience.

Downturn Graph Showing Company Comparison Ppt PowerPoint Presentation Professional Graphics Design PDF
Pitch your topic with ease and precision using this downturn graph showing company comparison ppt powerpoint presentation professional graphics design pdf. This layout presents information on company growth rate, red bull, pepsi. It is also available for immediate download and adjustment. So, changes can be made in the color, design, graphics or any other component to create a unique layout.

Activity Based Costing Bag Graph With Vendor Fees Ppt PowerPoint Presentation Portfolio Inspiration PDF
Pitch your topic with ease and precision using this activity based costing bag graph with vendor fees ppt powerpoint presentation portfolio inspiration pdf. This layout presents information on vendor fees, patient recruitment. It is also available for immediate download and adjustment. So, changes can be made in the color, design, graphics or any other component to create a unique layout.

Sprint Burndown Graph With Completed Tasks Ppt PowerPoint Presentation Show Styles PDF
Pitch your topic with ease and precision using this sprint burndown graph with completed tasks ppt powerpoint presentation show styles pdf. This layout presents information on completed tasks, ideal burndown, remaining effort2, remaining task. It is also available for immediate download and adjustment. So, changes can be made in the color, design, graphics or any other component to create a unique layout.

Pie Graph Layer Showing Sector Wise Sales In 2022 Microsoft PDF
Pitch your topic with ease and precision using this pie graph layer showing sector wise sales in 2022 microsoft pdf. This layout presents information on consumer goods, information technology, automobile, financial services, engineering. It is also available for immediate download and adjustment. So, changes can be made in the color, design, graphics or any other component to create a unique layout.

Accounting Ratio Assessment Graph With Cash Flow Ppt PowerPoint Presentation Model Samples PDF
Pitch your topic with ease and precision using this Accounting Ratio Assessment Graph With Cash Flow Ppt PowerPoint Presentation Model Samples PDF. This layout presents information on Cash Flow, Improvement, Total. It is also available for immediate download and adjustment. So, changes can be made in the color, design, graphics or any other component to create a unique layout.
 Home
Home