Bar Graph

Upward Line Graph For Investors Growth Ppt PowerPoint Presentation Gallery Topics PDF
Presenting this set of slides with name upward line graph for investors growth ppt powerpoint presentation gallery topics pdf. The topics discussed in these slide is upward line graph for investors growth. This is a completely editable PowerPoint presentation and is available for immediate download. Download now and impress your audience.

Data Analysis Template Driven Line Chart Business Graph PowerPoint Slides Templates
Bottle Your Thoughts In Our data analysis template driven line chart business graph powerpoint slides Templates . Pass It Around For Your Audience To Sip.
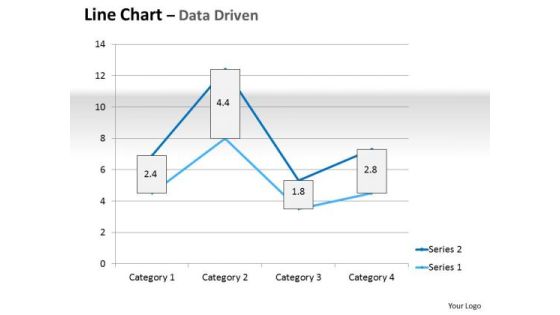
Multivariate Data Analysis Driven Line Chart Market Graph PowerPoint Slides Templates
Plan For All Contingencies With Our multivariate data analysis driven line chart market graph powerpoint slides Templates . Douse The Fire Before It Catches.

Gold Investment And Financial Growth Graph Ppt PowerPoint Presentation Pictures Background
Presenting this set of slides with name gold investment and financial growth graph ppt powerpoint presentation pictures background. This is a one stage process. The stages in this process are gold bar, gold investment, financial growth. This is a completely editable PowerPoint presentation and is available for immediate download. Download now and impress your audience.
Pie Graph Icon Circle Charts PowerPoint Templates And PowerPoint Themes 0612
Pie Graph Icon Circle Charts PowerPoint Templates And PowerPoint Themes Business-Microsoft Powerpoint Templates and Background with pie chart icon

Graph Pattern For Network Analysis Ppt PowerPoint Presentation Infographics Graphics Template
This is a graph pattern for network analysis ppt powerpoint presentation infographics graphics template. This is a two stage process. The stages in this process are graph theory, chart theory, business.

Community Capitalization Pitch Deck Shareholding Structure Graph Pre And Post Funding Template Pdf
The Slide Provides the Graph of Shareholding Structure at the Time Of Founding, Before Crowdfunding and After Crowdfunding. Deliver an awe inspiring pitch with this creative community capitalization pitch deck shareholding structure graph pre and post funding template pdf bundle. Topics like shareholding structure graph pre and post funding can be discussed with this completely editable template. It is available for immediate download depending on the needs and requirements of the user.
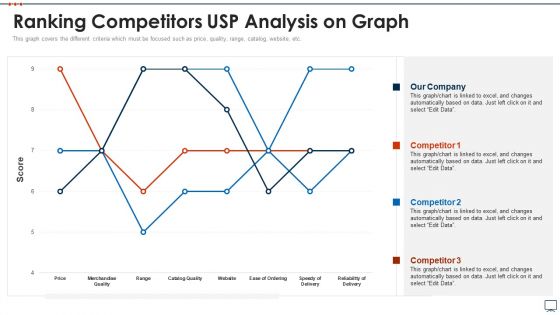
Business Plan Methods Tools And Templates Set 2 Ranking Competitors USP Analysis On Graph Elements PDF
This graph covers the different criteria which must be focused such as price, quality, range, catalog, website, etc. Deliver and pitch your topic in the best possible manner with this business plan methods tools and templates set 2 ranking competitors usp analysis on graph elements pdf. Use them to share invaluable insights on ranking competitors usp analysis on graph and impress your audience. This template can be altered and modified as per your expectations. So, grab it now.

Investor Pitch Deck Fundraising Via Mezzanine Equity Instrument Financial Graph Historical And Projection Formats PDF
The slide provides the graph of companys financials revenue, operating income and net income for last 5 years historical and coming 4 years forecasted. Deliver and pitch your topic in the best possible manner with this investor pitch deck fundraising via mezzanine equity instrument financial graph historical and projection formats pdf. Use them to share invaluable insights on financial graph historical and projection and impress your audience. This template can be altered and modified as per your expectations. So, grab it now.

Customer Relationship Management Marketing Dashboard With Revenue Graph And Deals Funnel Ideas PDF
The following slides highlights the CRM marketing dashboard with provides key details about new contacts, campaign email sent, revenue graph and worth of new deals. Showcasing this set of slides titled customer relationship management marketing dashboard with revenue graph and deals funnel ideas pdf. The topics addressed in these templates are funnel, revenue graph, campaign. All the content presented in this PPT design is completely editable. Download it and make adjustments in color, background, font etc. as per your unique business setting.

3d Pie Chart Graph And Dollar PowerPoint Templates And PowerPoint Themes 0912
3d Pie Chart Graph And Dollar PowerPoint Templates And PowerPoint Themes 0912-Microsoft Powerpoint Templates and Background with pie chart graph and dollar-Pie chart graph and dollar, business, signs, marketing, money, finance
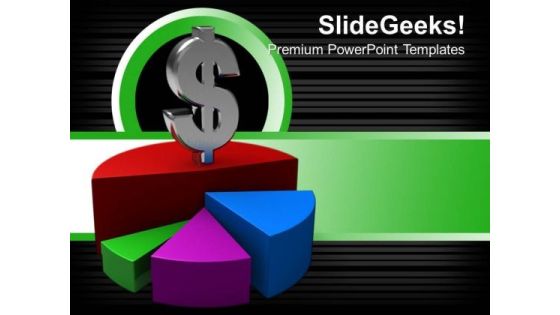
Pie Chart Graph Dollar Business PowerPoint Templates And PowerPoint Themes 0912
Pie Chart Graph Dollar Business PowerPoint Templates And PowerPoint Themes 0912-Microsoft Powerpoint Templates and Background with pie chart graph and dollar-Pie chart graph and dollar, business, signs, marketing, money, finance
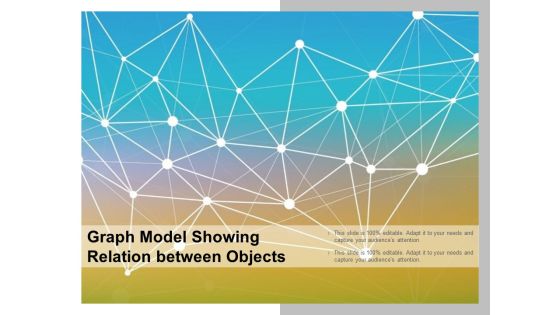
Graph Model Showing Relation Between Objects Ppt PowerPoint Presentation Summary Graphics Tutorials
This is a graph model showing relation between objects ppt powerpoint presentation summary graphics tutorials. This is a two stage process. The stages in this process are graph theory, chart theory, business.
Interconnect Graph Layout With Icons And Text Holders Ppt PowerPoint Presentation Inspiration Example Introduction
This is a interconnect graph layout with icons and text holders ppt powerpoint presentation inspiration example introduction. This is a three stage process. The stages in this process are graph theory, chart theory, business.

Interconnected Graph With World Map In Background Ppt PowerPoint Presentation Infographics Slide
This is a interconnected graph with world map in background ppt powerpoint presentation infographics slide. This is a three stage process. The stages in this process are graph theory, chart theory, business.
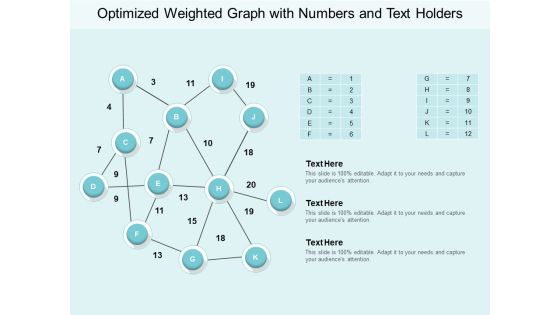
Optimized Weighted Graph With Numbers And Text Holders Ppt PowerPoint Presentation Outline Picture
This is a optimized weighted graph with numbers and text holders ppt powerpoint presentation outline picture. This is a three stage process. The stages in this process are graph theory, chart theory, business.

Computer Tablet With Success Growth Graph PowerPoint Templates And PowerPoint Themes 0912
Computer Tablet With Success Growth Graph PowerPoint Templates And PowerPoint Themes 0912-Microsoft Powerpoint Templates and Background with tablet with business growth graph-Tablet with business growth graph, technology, finance, success, business, computer
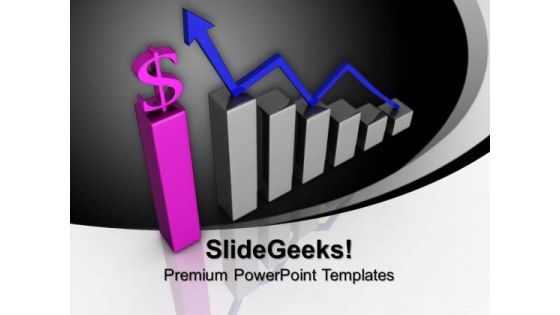
Increase In Dollar Graph Finance PowerPoint Templates And PowerPoint Themes 0912
Increase In Dollar Graph Finance PowerPoint Templates And PowerPoint Themes 0912-Microsoft Powerpoint Templates and Background with business graph with arrow showing profits-Business graph with arrow showing profits, signs, success, finance, business, arrows

Profit And Loss Graph Concept Finance PowerPoint Templates And PowerPoint Themes 0912
Profit And Loss Graph Concept Finance PowerPoint Templates And PowerPoint Themes 0912-Microsoft Powerpoint Templates and Background with profit and loss graph-Profit and loss graph, business, finance, money, sales, marketing

Pie Chart Graph Dollar Finance PowerPoint Templates And PowerPoint Themes 0812
Pie Chart Graph Dollar Finance PowerPoint Templates And PowerPoint Themes 0812-Microsoft Powerpoint Templates and Background with pie chart graph and dollar

Pie Chart Graph Dollar Marketing PowerPoint Templates And PowerPoint Themes 0812
Pie Chart Graph Dollar Marketing PowerPoint Templates And PowerPoint Themes 0812-Microsoft Powerpoint Templates and Background with pie chart graph and dollar

Chart Illustrates Diminishing Graph And Chart Child Labour And Hazardous Work Inspiration PDF
Showcasing this set of slides titled Chart Illustrates Diminishing Graph And Chart Child Labour And Hazardous Work Inspiration PDF. The topics addressed in these templates are Chart Illustrates Diminishing Graph, Hazardous Work, Chart Child Labour. All the content presented in this PPT design is completely editable. Download it and make adjustments in color, background, font etc. as per your unique business setting.

Chart Indicates Diminishing Graph And Chart Cash Payment Mode Inspiration PDF
Showcasing this set of slides titled Chart Indicates Diminishing Graph And Chart Cash Payment Mode Inspiration PDF. The topics addressed in these templates are Chart Indicates Diminishing Graph, Chart Cash Payment Mode. All the content presented in this PPT design is completely editable. Download it and make adjustments in color, background, font etc. as per your unique business setting.

Chart Indicates Diminishing Graph And Chart Stock Market Indexes Themes PDF
Showcasing this set of slides titled Chart Indicates Diminishing Graph And Chart Stock Market Indexes Themes PDF. The topics addressed in these templates are Chart Indicates Diminishing Graph, Chart Stock Market Indexes. All the content presented in this PPT design is completely editable. Download it and make adjustments in color, background, font etc. as per your unique business setting.
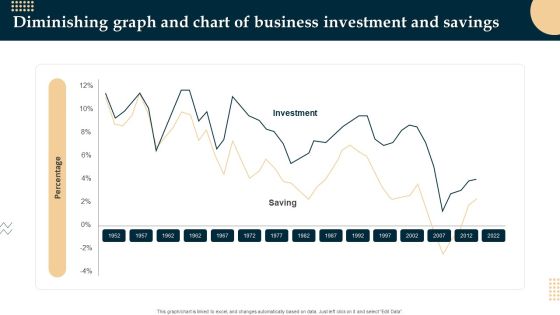
Diminishing Graph And Chart Of Business Investment And Savings Demonstration PDF
Showcasing this set of slides titled Diminishing Graph And Chart Of Business Investment And Savings Demonstration PDF. The topics addressed in these templates are Diminishing Graph, Chart Of Business Investment. All the content presented in this PPT design is completely editable. Download it and make adjustments in color, background, font etc. as per your unique business setting.
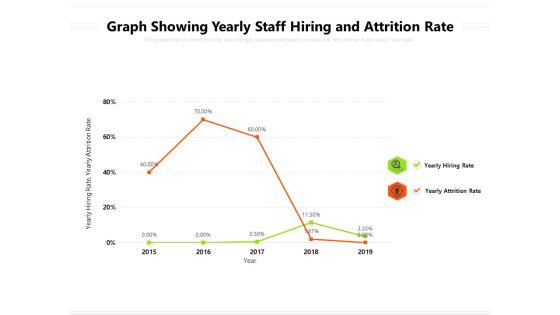
Graph Showing Yearly Staff Hiring And Attrition Rate Ppt PowerPoint Presentation Infographic Template Format Ideas PDF
Presenting this set of slides with name graph showing yearly staff hiring and attrition rate ppt powerpoint presentation infographic template format ideas pdf. The topics discussed in these slide is graph showing yearly staff hiring and attrition rate. This is a completely editable PowerPoint presentation and is available for immediate download. Download now and impress your audience.
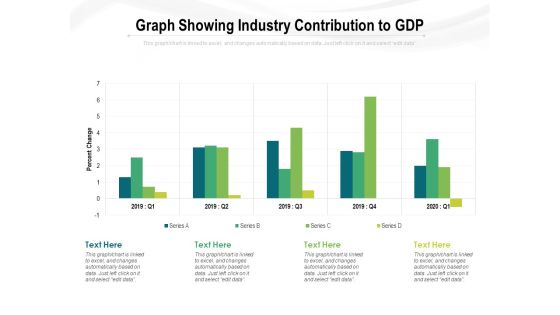
Graph Showing Industry Contribution To GDP Ppt PowerPoint Presentation Show Design Templates PDF
Presenting this set of slides with name graph showing industry contribution to gdp ppt powerpoint presentation show design templates pdf. The topics discussed in these slide is graph showing industry contribution to gdp. This is a completely editable PowerPoint presentation and is available for immediate download. Download now and impress your audience.

Graph Showing Product Sales By Quarter Ppt PowerPoint Presentation Ideas Templates PDF
Presenting this set of slides with name graph showing product sales by quarter ppt powerpoint presentation ideas templates pdf. The topics discussed in these slide is graph showing product sales by quarter. This is a completely editable PowerPoint presentation and is available for immediate download. Download now and impress your audience.
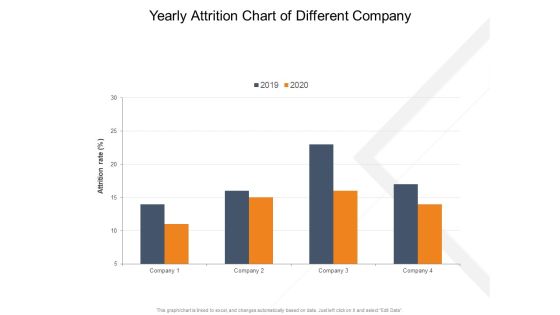
Employee Turnover Graph Of Various Companies Ppt PowerPoint Presentation Styles Template PDF
Presenting this set of slides with name employee turnover graph of various companies ppt powerpoint presentation styles template pdf. The topics discussed in these slide is employee turnover graph of various companies. This is a completely editable PowerPoint presentation and is available for immediate download. Download now and impress your audience.
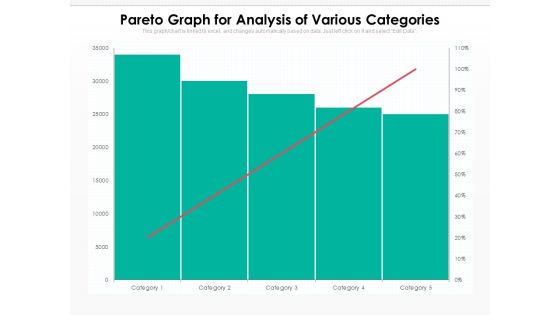
Pareto Graph For Analysis Of Various Categories Ppt PowerPoint Presentation Gallery Template PDF
Presenting this set of slides with name pareto graph for analysis of various categories ppt powerpoint presentation gallery template pdf. The topics discussed in these slide is pareto graph for analysis of various categories. This is a completely editable PowerPoint presentation and is available for immediate download. Download now and impress your audience.
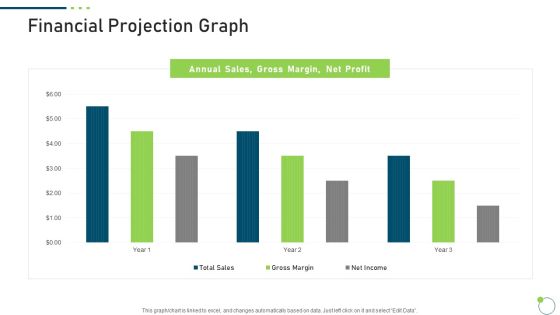
Investor Pitch Deck New Venture Capital Raising Financial Projection Graph Demonstration PDF
Deliver an awe inspiring pitch with this creative investor pitch deck new venture capital raising financial projection graph demonstration pdf bundle. Topics like financial projection graph can be discussed with this completely editable template. It is available for immediate download depending on the needs and requirements of the user.

Pie Graph Representing Consumer Review For Various Products Ppt Summary Professional PDF
Showcasing this set of slides titled pie graph representing consumer review for various products ppt summary professional pdf. The topics addressed in these templates are pie graph representing consumer review for various products. All the content presented in this PPT design is completely editable. Download it and make adjustments in color, background, font etc. as per your unique business setting.

3 Months Timeline Graph For Gross Lease Ppt PowerPoint Presentation Icon Model PDF
Showcasing this set of slides titled 3 months timeline graph for gross lease ppt powerpoint presentation icon model pdf. The topics addressed in these templates are 3 months timeline graph for gross lease. All the content presented in this PPT design is completely editable. Download it and make adjustments in color, background, font etc. as per your unique business setting.
Financial Graph For Urban Population Growth With Prediction Figures Icons PDF
Showcasing this set of slides titled financial graph for urban population growth with prediction figures icons pdf. The topics addressed in these templates are financial graph for urban population growth with prediction figures. All the content presented in this PPT design is completely editable. Download it and make adjustments in color, background, font etc. as per your unique business setting.

Community Marketing Manager Graph Scorecard With Open And Delivery Rate Designs PDF
Deliver and pitch your topic in the best possible manner with this Community Marketing Manager Graph Scorecard With Open And Delivery Rate Designs PDF Use them to share invaluable insights on Community Marketing, Manager Graph, Scorecard Delivery and impress your audience. This template can be altered and modified as per your expectations. So, grab it now.

Graph Depicting Electronic Items Consumption Based On Consumer Age Categories Structure PDF
Showcasing this set of slides titled Graph Depicting Electronic Items Consumption Based On Consumer Age Categories Structure PDF. The topics addressed in these templates are Graph Depicting Electronic Items, Consumption Based On Consumer, Age Categories. All the content presented in this PPT design is completely editable. Download it and make adjustments in color, background, font etc. as per your unique business setting.

Sales By Area Graph Showing Revenue From Top Countries Inspiration PDF
Showcasing this set of slides titled Sales By Area Graph Showing Revenue From Top Countries Inspiration PDF. The topics addressed in these templates are Sales Area, Graph Showing, Revenue Countries. All the content presented in this PPT design is completely editable. Download it and make adjustments in color, background, font etc. as per your unique business setting.

Increase Graph And Red Dollar Success PowerPoint Templates And PowerPoint Themes 0612
Increase Graph And Red Dollar Success PowerPoint Templates And PowerPoint Themes Business PPT Templates-Graph with arrow, finance, sales, arrows, success, business

Computer Tablet With Graph Business PowerPoint Templates And PowerPoint Themes 0712
Computer Tablet With Graph Business PowerPoint Templates And PowerPoint Themes 0712-Microsoft Powerpoint Templates and Background with tablets with a business graph

Computer Tablet With Graph Arrow Business PowerPoint Templates And PowerPoint Themes 0712
Computer Tablet With Graph Arrow Business PowerPoint Templates And PowerPoint Themes Business Power Points-Microsoft Powerpoint Templates and Background with tablets with a business graph
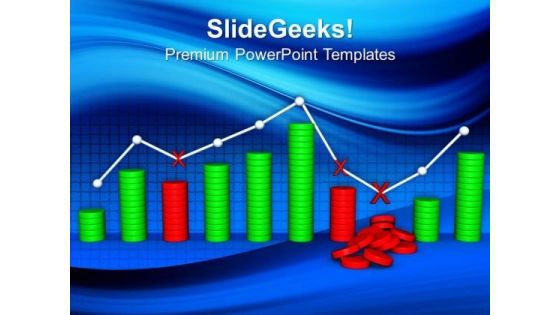
Business Graph With Fall Finance PowerPoint Templates And PowerPoint Themes 0812
Business Graph With Fall Finance PowerPoint Templates And PowerPoint Themes 0812-Microsoft Powerpoint Templates and Background with business graph with fall finance

Loss In Money Graph Finance PowerPoint Templates And PowerPoint Themes 0812
Loss In Money Graph Finance PowerPoint Templates And PowerPoint Themes 0812-Microsoft Powerpoint Templates and Background with graph moving down and showing money loss

Computer Tablet With Business Growth Graph Success PowerPoint Templates And PowerPoint Themes 0812
Computer Tablet With Business Growth Graph Success PowerPoint Templates And PowerPoint Themes 0812-Microsoft Powerpoint Templates and Background with computer tablet with graph

Computer Tablet With Business Graph PowerPoint Templates And PowerPoint Themes 0912
Computer Tablet With Business Graph PowerPoint Templates And PowerPoint Themes 0912-Microsoft Powerpoint Templates and Background with computer tablet with business growth graph

Computer Tablet With Business Growth Graph Marketing PowerPoint Templates And PowerPoint Themes 0912
Computer Tablet With Business Growth Graph Marketing PowerPoint Templates And PowerPoint Themes 0912-Microsoft Powerpoint Templates and Background with computer tablet with business growth graph

Chart Illustrates Diminishing Graph And Chart Employment Share In Manufacturing Diagrams PDF
Pitch your topic with ease and precision using this Chart Illustrates Diminishing Graph And Chart Employment Share In Manufacturing Diagrams PDF. This layout presents information on Chart Employment, Share In Manufacturing, Chart Illustrates Diminishing Graph. It is also available for immediate download and adjustment. So, changes can be made in the color, design, graphics or any other component to create a unique layout.

Trend Chart Depicting Diminishing Graph And Chart Sales And Production Structure PDF
Pitch your topic with ease and precision using this Trend Chart Depicting Diminishing Graph And Chart Sales And Production Structure PDF. This layout presents information on Trend Chart Depicting, Diminishing Graph, Chart Sales And Production. It is also available for immediate download and adjustment. So, changes can be made in the color, design, graphics or any other component to create a unique layout.

Chart Indicates Diminishing Graph And Chart Retail Value And Volume Download PDF
Pitch your topic with ease and precision using this Chart Indicates Diminishing Graph And Chart Retail Value And Volume Download PDF. This layout presents information on Chart Indicates Diminishing Graph, Chart Retail Value And Volume. It is also available for immediate download and adjustment. So, changes can be made in the color, design, graphics or any other component to create a unique layout.
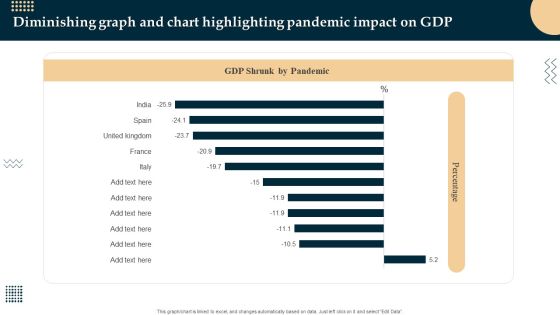
Diminishing Graph And Chart Highlighting Pandemic Impact On GDP Sample PDF
Pitch your topic with ease and precision using this Diminishing Graph And Chart Highlighting Pandemic Impact On GDP Sample PDF. This layout presents information on Diminishing Graph, Chart Highlighting Pandemic. It is also available for immediate download and adjustment. So, changes can be made in the color, design, graphics or any other component to create a unique layout.

Area Graph Displaying Yearly Performance Analysis Ppt PowerPoint Presentation Slides Diagrams
Presenting this set of slides with name area graph displaying yearly performance analysis ppt powerpoint presentation slides diagrams. The topics discussed in these slide is area graph displaying yearly performance analysis. This is a completely editable PowerPoint presentation and is available for immediate download. Download now and impress your audience.

Graph Showing Investment In Public Private Sector Ppt PowerPoint Presentation Slides Structure
Presenting this set of slides with name graph showing investment in public private sector ppt powerpoint presentation slides structure. The topics discussed in these slide is graph showing investment in public private sector. This is a completely editable PowerPoint presentation and is available for immediate download. Download now and impress your audience.

Graph Showing Sales Analysis By Region Ppt PowerPoint Presentation Inspiration Images
Presenting this set of slides with name graph showing sales analysis by region ppt powerpoint presentation inspiration images. The topics discussed in these slide is graph showing sales analysis by region. This is a completely editable PowerPoint presentation and is available for immediate download. Download now and impress your audience.

Business Graph Showing Factor Income Trend Ppt PowerPoint Presentation Slides Mockup
Presenting this set of slides with name business graph showing factor income trend ppt powerpoint presentation slides mockup. The topics discussed in these slide is business graph showing factor income trend. This is a completely editable PowerPoint presentation and is available for immediate download. Download now and impress your audience.
Investing In Start Ups Column Graph Ppt Icon Design Inspiration PDF
Presenting this set of slides with name investing in start ups column graph ppt icon design inspiration pdf. The topics discussed in these slides are column graph. This is a completely editable PowerPoint presentation and is available for immediate download. Download now and impress your audience.

COVID 19 Pandemic Disease Graph Showing Coronavirus Impact On Stock Market Icons PDF
Presenting this set of slides with name covid 19 pandemic disease graph showing coronavirus impact on stock market icons pdf. The topics discussed in these slides are graph showing coronavirus impact on stock market. This is a completely editable PowerPoint presentation and is available for immediate download. Download now and impress your audience.

Graph Showing Employee Churn Rate Ppt PowerPoint Presentation Inspiration Portfolio PDF
Presenting this set of slides with name graph showing employee churn rate ppt powerpoint presentation inspiration portfolio pdf. The topics discussed in these slide is graph showing employee churn rate. This is a completely editable PowerPoint presentation and is available for immediate download. Download now and impress your audience.

Economic Outlook Graph With Percentage Analysis Ppt PowerPoint Presentation Show Demonstration PDF
Presenting this set of slides with name economic outlook graph with percentage analysis ppt powerpoint presentation show demonstration pdf. The topics discussed in these slide is economic outlook graph with percentage analysis. This is a completely editable PowerPoint presentation and is available for immediate download. Download now and impress your audience.

Graph Showing Quarterly GDP Growth Ppt PowerPoint Presentation File Mockup PDF
Presenting this set of slides with name graph showing quarterly gdp growth ppt powerpoint presentation file mockup pdf. The topics discussed in these slides are graph showing quarterly gdp growth, 2015 to 2020. This is a completely editable PowerPoint presentation and is available for immediate download. Download now and impress your audience.
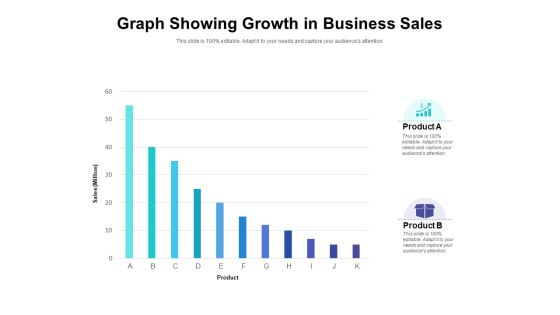
Graph Showing Growth In Business Sales Ppt PowerPoint Presentation Portfolio Designs PDF
Presenting this set of slides with name graph showing growth in business sales ppt powerpoint presentation portfolio designs pdf. The topics discussed in these slide is graph showing growth in business sales. This is a completely editable PowerPoint presentation and is available for immediate download. Download now and impress your audience.

Graph Showing Income Comparison Of Different Companies In Years Ppt PowerPoint Presentation Gallery Clipart PDF
Presenting this set of slides with name graph showing income comparison of different companies in years ppt powerpoint presentation gallery clipart pdf. The topics discussed in these slide is graph showing income comparison of different companies in years. This is a completely editable PowerPoint presentation and is available for immediate download. Download now and impress your audience.
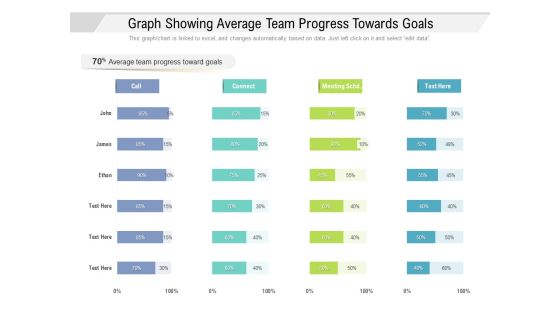
Graph Showing Average Team Progress Towards Goals Ppt PowerPoint Presentation Slides Picture PDF
Presenting this set of slides with name graph showing average team progress towards goals ppt powerpoint presentation slides picture pdf. The topics discussed in these slide is graph showing average team progress towards goals. This is a completely editable PowerPoint presentation and is available for immediate download. Download now and impress your audience.

Dashboard With Client Satisfaction Score Graph Ppt PowerPoint Presentation Summary Design Inspiration PDF
Presenting this set of slides with name dashboard with client satisfaction score graph ppt powerpoint presentation summary design inspiration pdf. The topics discussed in these slide is dashboard with client satisfaction score graph. This is a completely editable PowerPoint presentation and is available for immediate download. Download now and impress your audience.
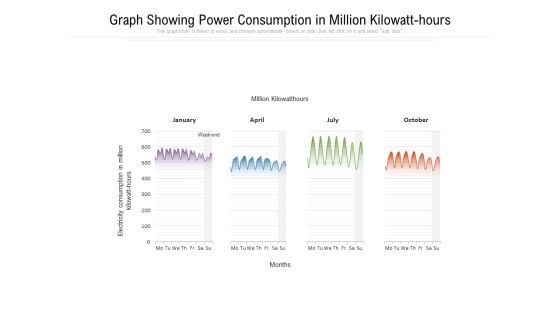
Graph Showing Power Consumption In Million Kilowatt Hours Ppt PowerPoint Presentation Gallery Example File PDF
Presenting this set of slides with name graph showing power consumption in million kilowatt hours ppt powerpoint presentation gallery example file pdf. The topics discussed in these slide is graph showing power consumption in million kilowatt hours. This is a completely editable PowerPoint presentation and is available for immediate download. Download now and impress your audience.
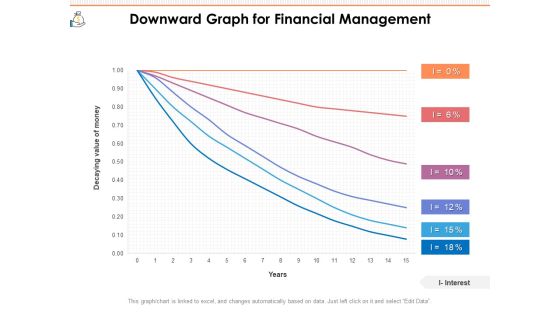
Downward Graph For Financial Management Ppt PowerPoint Presentation File Picture PDF
Presenting this set of slides with name downward graph for financial management ppt powerpoint presentation file picture pdf. The topics discussed in these slide is downward graph for financial management. This is a completely editable PowerPoint presentation and is available for immediate download. Download now and impress your audience.
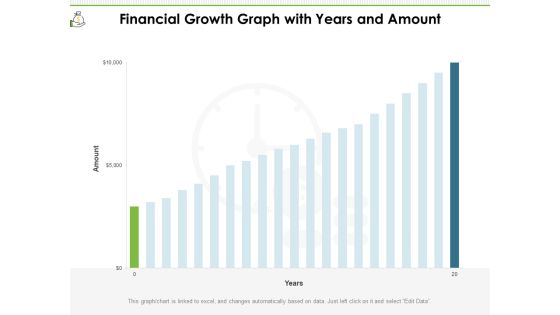
Financial Growth Graph With Years And Amount Ppt PowerPoint Presentation File Microsoft PDF
Presenting this set of slides with name financial growth graph with years and amount ppt powerpoint presentation file microsoft pdf. The topics discussed in these slide is financial growth graph with years and amount. This is a completely editable PowerPoint presentation and is available for immediate download. Download now and impress your audience.

Graph Showing Financial Impact Of Inflation Ppt PowerPoint Presentation File Graphics Tutorials PDF
Presenting this set of slides with name graph showing financial impact of inflation ppt powerpoint presentation file graphics tutorials pdf. The topics discussed in these slide is graph showing financial impact of inflation. This is a completely editable PowerPoint presentation and is available for immediate download. Download now and impress your audience.
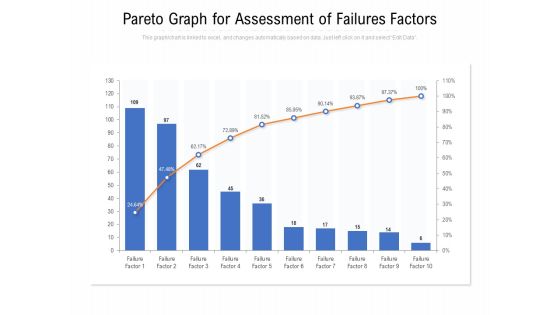
Pareto Graph For Assessment Of Failures Factors Ppt PowerPoint Presentation File Sample PDF
Presenting this set of slides with name pareto graph for assessment of failures factors ppt powerpoint presentation file sample pdf. The topics discussed in these slide is pareto graph for assessment of failures factors. This is a completely editable PowerPoint presentation and is available for immediate download. Download now and impress your audience.

Pareto Graph For Call Center Problems Ppt PowerPoint Presentation File Graphics Download PDF
Presenting this set of slides with name pareto graph for call center problems ppt powerpoint presentation file graphics download pdf. The topics discussed in these slide is pareto graph for call center problems. This is a completely editable PowerPoint presentation and is available for immediate download. Download now and impress your audience.

Pareto Graph For Category Wise Data Analysis Ppt PowerPoint Presentation File Example File PDF
Presenting this set of slides with name pareto graph for category wise data analysis ppt powerpoint presentation file example file pdf. The topics discussed in these slide is pareto graph for category wise data analysis. This is a completely editable PowerPoint presentation and is available for immediate download. Download now and impress your audience.

Pareto Graph For Logistics Issues Analysis Ppt PowerPoint Presentation File Example Topics PDF
Presenting this set of slides with name pareto graph for logistics issues analysis ppt powerpoint presentation file example topics pdf. The topics discussed in these slide is pareto graph for logistics issues analysis. This is a completely editable PowerPoint presentation and is available for immediate download. Download now and impress your audience.

Pareto Graph For Manufacturing Plant Problems Ppt PowerPoint Presentation File Visuals PDF
Presenting this set of slides with name pareto graph for manufacturing plant problems ppt powerpoint presentation file visuals pdf. The topics discussed in these slide is pareto graph for manufacturing plant problems. This is a completely editable PowerPoint presentation and is available for immediate download. Download now and impress your audience.
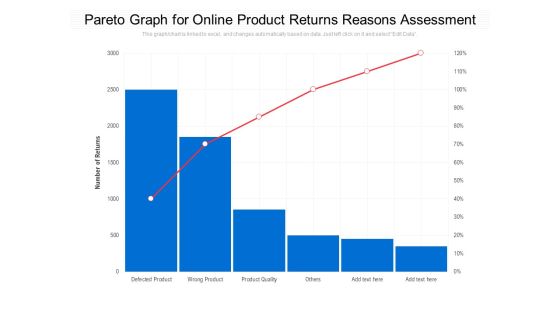
Pareto Graph For Online Product Returns Reasons Assessment Ppt PowerPoint Presentation File Graphics Tutorials PDF
Presenting this set of slides with name pareto graph for online product returns reasons assessment ppt powerpoint presentation file graphics tutorials pdf. The topics discussed in these slide is pareto graph for online product returns reasons assessment. This is a completely editable PowerPoint presentation and is available for immediate download. Download now and impress your audience.

Pareto Graph For Product Sales Analysis Ppt PowerPoint Presentation File Clipart PDF
Presenting this set of slides with name pareto graph for product sales analysis ppt powerpoint presentation file clipart pdf. The topics discussed in these slide is pareto graph for product sales analysis. This is a completely editable PowerPoint presentation and is available for immediate download. Download now and impress your audience.
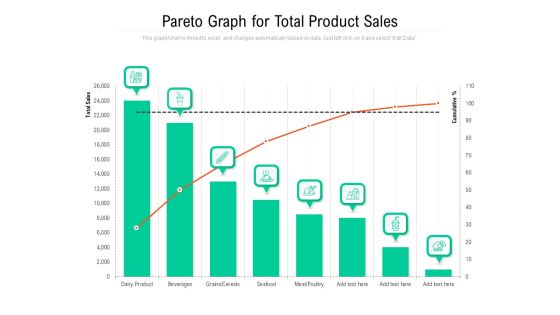
Pareto Graph For Total Product Sales Ppt PowerPoint Presentation Gallery Guidelines PDF
Presenting this set of slides with name pareto graph for total product sales ppt powerpoint presentation gallery guidelines pdf. The topics discussed in these slide is pareto graph for total product sales. This is a completely editable PowerPoint presentation and is available for immediate download. Download now and impress your audience.

Burndown Graph With Hours For Work Completion Ppt PowerPoint Presentation Professional Pictures PDF
Presenting this set of slides with name burndown graph with hours for work completion ppt powerpoint presentation professional pictures pdf. The topics discussed in these slide is burndown graph with hours for work completion. This is a completely editable PowerPoint presentation and is available for immediate download. Download now and impress your audience.

Burndown Graph With Time For Task Completion Ppt PowerPoint Presentation Gallery Topics PDF
Presenting this set of slides with name burndown graph with time for task completion ppt powerpoint presentation gallery topics pdf. The topics discussed in these slide is burndown graph with time for task completion. This is a completely editable PowerPoint presentation and is available for immediate download. Download now and impress your audience.
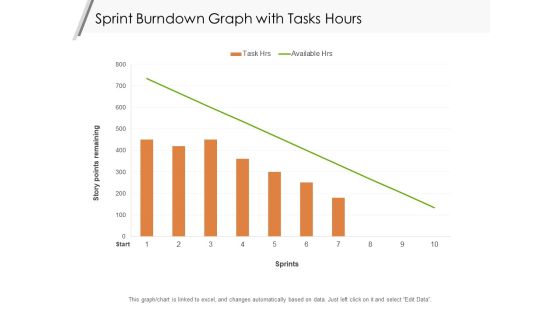
Sprint Burndown Graph With Tasks Hours Ppt PowerPoint Presentation Layouts Example Introduction PDF
Presenting this set of slides with name sprint burndown graph with tasks hours ppt powerpoint presentation layouts example introduction pdf. The topics discussed in these slide is sprint burndown graph with tasks hours. This is a completely editable PowerPoint presentation and is available for immediate download. Download now and impress your audience.

Graph Showing Revenue Through Social Media Marketing Ppt PowerPoint Presentation Gallery Professional PDF
Presenting this set of slides with name graph showing revenue through social media marketing ppt powerpoint presentation gallery professional pdf. The topics discussed in these slide is graph showing revenue through social media marketing. This is a completely editable PowerPoint presentation and is available for immediate download. Download now and impress your audience.
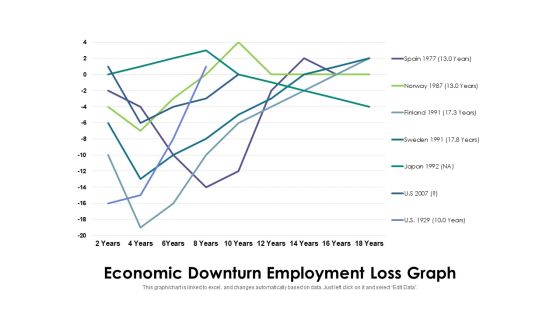
Economic Downturn Employment Loss Graph Ppt PowerPoint Presentation Outline Example File PDF
Pitch your topic with ease and precision using this economic downturn employment loss graph ppt powerpoint presentation outline example file pdf. This layout presents information on economic downturn employment loss graph. It is also available for immediate download and adjustment. So, changes can be made in the color, design, graphics or any other component to create a unique layout.

Business Targets Achievement Shown Through Sales Growth Graph Ppt PowerPoint Presentation Gallery Elements PDF
Pitch your topic with ease and precision using this business targets achievement shown through sales growth graph ppt powerpoint presentation gallery elements pdf. This layout presents information on business targets achievement shown through sales growth graph. It is also available for immediate download and adjustment. So, changes can be made in the color, design, graphics or any other component to create a unique layout.

Business Services Icon With Pie Graph And Dollar Sign Ppt Styles Good PDF
Pitch your topic with ease and precision using this business services icon with pie graph and dollar sign ppt styles good pdf. This layout presents information on business services icon with pie graph and dollar sign. It is also available for immediate download and adjustment. So, changes can be made in the color, design, graphics or any other component to create a unique layout.

Graph Showing The Statistics Of Employee Engagement Count By Region Formats PDF
Pitch your topic with ease and precision using this graph showing the statistics of employee engagement count by region formats pdf. This layout presents information on graph showing the statistics of employee engagement count by region. It is also available for immediate download and adjustment. So, changes can be made in the color, design, graphics or any other component to create a unique layout.
Business Graph On Pie Chart Finance PowerPoint Templates And PowerPoint Backgrounds 0411
Microsoft PowerPoint Template and Background with business graph on pie chart

After IPO Equity Non Performing Assets Loans Graph Ppt Infographic Template Example Introduction PDF
This slide Provides the graph of historical and Forecasted Non-Performing Assets or Loans in percent for the period 2015 to 2023 and the Strategies used by the company to reduce NPA over that period. Deliver an awe-inspiring pitch with this creative after ipo equity non performing assets loans graph ppt infographic template example introduction pdf bundle. Topics like non performing assets or loans graph can be discussed with this completely editable template. It is available for immediate download depending on the needs and requirements of the user.

Oil Barrel With Up Arrow Graph Marketing PowerPoint Templates And PowerPoint Themes 0912
Oil Barrel With Up Arrow Graph Marketing PowerPoint Templates And PowerPoint Themes Presentations-Microsoft Powerpoint Templates and Background with oil barrels and chart graph with arrow-Oil Barrel With Up Arrow Graph Marketing PowerPoint Templates And PowerPoint Themes PresentationsThis PPT can be used for presentations relating to-Oil barrels and chart graph with arrow, business, marketing, finance, success, arrows
Skill Development Training To Strengthen Employee Performance Employee Efficiency Graph For The Five Years Icons PDF
This slide shows the five- year graph of average production per employee in tonne and employee efficiency in percentage along with the key insights. Deliver and pitch your topic in the best possible manner with this skill development training to strengthen employee performance employee efficiency graph for the five years icons pdf. Use them to share invaluable insights on employee efficiency graph for the five years and impress your audience. This template can be altered and modified as per your expectations. So, grab it now.

Upskill Training For Employee Performance Improvement Employee Efficiency Graph For The Five Years Summary PDF
This slide shows the five- year graph of average production per employee in tonne and employee efficiency in percentage along with the key insights. Deliver and pitch your topic in the best possible manner with this upskill training for employee performance improvement employee efficiency graph for the five years summary pdf. Use them to share invaluable insights on employee efficiency graph for the five years and impress your audience. This template can be altered and modified as per your expectations. So, grab it now.

Line Comparison Graph For Yearly Liquidity Ratio Analysis Comparison Topics PDF
This slide showcases liquidity ratios graph that can help in identifying cash richness and financial position of organization. It showcases comparison for last 6 years and it key components are current ratio, quick ratio and cash ratio. Showcasing this set of slides titled Line Comparison Graph For Yearly Liquidity Ratio Analysis Comparison Topics PDF. The topics addressed in these templates are Term Financing, Cash Shortage, Cash Ratio. All the content presented in this PPT design is completely editable. Download it and make adjustments in color, background, font etc. as per your unique business setting.

Graph With Up Arrow Globe Business PowerPoint Templates And PowerPoint Backgrounds 0411
Microsoft PowerPoint Template and Background with business graph with arrow and globe
Person Installing The Graph Business PowerPoint Templates And PowerPoint Backgrounds 0411
Microsoft PowerPoint Template and Background with 3D puppet installing the business graph

Arrow Graph Going Up Success PowerPoint Templates And PowerPoint Backgrounds 0511
Microsoft PowerPoint Template and Background with arrow graph going up on a blue background

Businessman Holding Up Graph Marketing PowerPoint Templates And PowerPoint Backgrounds 0511
Microsoft PowerPoint Template and Background with young modern businessman holding up graph
Business Graph With Check Metaphor PowerPoint Templates And PowerPoint Backgrounds 0511
Microsoft PowerPoint Template and Background with a combination of a check mark and financial graph

Man Drawing A Graph Marketing PowerPoint Templates And PowerPoint Backgrounds 0511
Microsoft PowerPoint Template and Background with business man drawing a growth graph

Success Graph With Dollar Business PowerPoint Templates And PowerPoint Backgrounds 0511
Microsoft PowerPoint Template and Background with business graph from dollar coins with arrow showing profits
Growth Graph With Arrow Business PowerPoint Templates And PowerPoint Backgrounds 0611
Microsoft PowerPoint Template and Background with growth graph with red arrow pointing upwards

Man With A Graph Business PowerPoint Templates And PowerPoint Backgrounds 0611
Microsoft PowerPoint Template and Background with successful business man with a graph
Graph With World Map Business PowerPoint Templates And PowerPoint Backgrounds 0611
Microsoft PowerPoint Template and Background with graph with world map and grid in background

Growth Graph With Arrow01 Business PowerPoint Templates And PowerPoint Backgrounds 0611
Microsoft PowerPoint Template and Background with growth graph with red arrow pointing upwards
Graph Growth Of Dollars Finance PowerPoint Templates And PowerPoint Backgrounds 0711
Microsoft PowerPoint Template and Background with graph representing growth sign of money
Profit Graph With Green Arrow Business PowerPoint Templates And PowerPoint Backgrounds 0811
Microsoft PowerPoint Template and Background with profit graph with green arrows
Dollar Graph With Target Finance PowerPoint Templates And PowerPoint Backgrounds 1211
Microsoft PowerPoint Template and Background with dollar graph and target represents success

Business Graph With Dollar Sign Marketing PowerPoint Templates And PowerPoint Themes 1012
Business Graph With Dollar Sign Marketing PowerPoint Templates And PowerPoint Themes 1012-Microsoft Powerpoint Templates and Background with bussiness graph with dollar sign-Business Graph With Dollar Sign Marketing PowerPoint Templates And PowerPoint Themes 1012-This PowerPoint template can be used for presentations relating to-Business graph with dollar sign, finance, business, success, signs, money

E Business Graph Presentation Success Growth PowerPoint Templates And PowerPoint Themes 1012
E Business Graph Presentation Success Growth PowerPoint Templates And PowerPoint Themes 1012-Microsoft Powerpoint Templates and Background with business graph with arrow-E Business Graph Presentation Success Growth PowerPoint Templates And PowerPoint Themes 1012-This PowerPoint template can be used for presentations relating to-Business graph with arrow, technology, computer, business, success, arrows
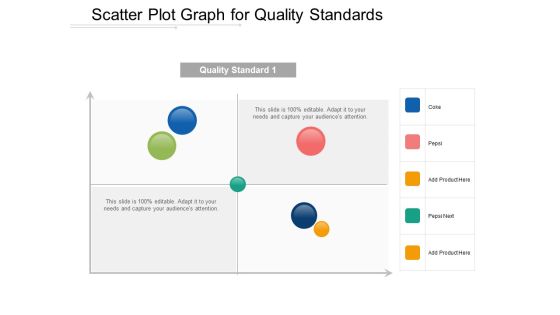
Scatter Plot Graph For Quality Standards Ppt Powerpoint Presentation Show Infographics
This is a scatter plot graph for quality standards ppt powerpoint presentation show infographics. This is a four stage process. The stages in this process are scatter plot, probability plots, plot diagram.
Business Graph On Pie Chart Finance PowerPoint Themes And PowerPoint Slides 0411
Microsoft PowerPoint Theme and Slide with business graph on pie chart

Downturn Graph Indicating Growth Rate In Various Countries Ppt PowerPoint Presentation Layouts Design Templates PDF
Pitch your topic with ease and precision using this downturn graph indicating growth rate in various countries ppt powerpoint presentation layouts design templates pdf. This layout presents information on downturn graph indicating growth rate in various countries. It is also available for immediate download and adjustment. So, changes can be made in the color, design, graphics or any other component to create a unique layout.

Graph Showing Reduction In Product Sales Ppt PowerPoint Presentation Infographic Template Graphics Design PDF
Pitch your topic with ease and precision using this graph showing reduction in product sales ppt powerpoint presentation infographic template graphics design pdf. This layout presents information on graph showing reduction in product sales, 2015 to 2020. It is also available for immediate download and adjustment. So, changes can be made in the color, design, graphics or any other component to create a unique layout.

Shipping Vendor Spend Scorecard Summary In Graph Ppt Pictures Introduction PDF
This graph or chart is linked to excel, and changes automatically based on data. Just left click on it and select Edit Data. Deliver and pitch your topic in the best possible manner with this Shipping Vendor Spend Scorecard Summary In Graph Ppt Pictures Introduction PDF. Use them to share invaluable insights on Vendor Scorecard Summary, Vendor Spend Shipping, Actual Spend Vs and impress your audience. This template can be altered and modified as per your expectations. So, grab it now.

Doughnut Graph Depicting Time Spent On Multiple Project Activities Microsoft PDF
This graph or chart is linked to excel, and changes automatically based on data. Just left click on it and select Edit Data. Showcasing this set of slides titled Doughnut Graph Depicting Time Spent On Multiple Project Activities Microsoft PDF. The topics addressed in these templates are Website Development, IT Incident Management, Portfolio Management. All the content presented in this PPT design is completely editable. Download it and make adjustments in color, background, font etc. as per your unique business setting.
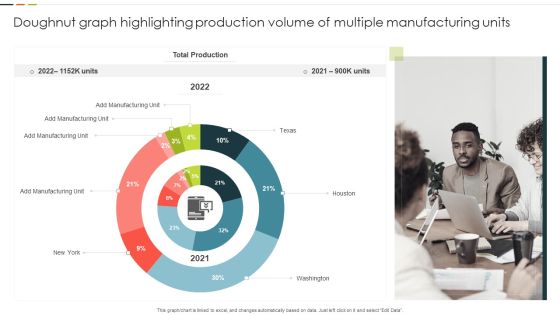
Doughnut Graph Highlighting Production Volume Of Multiple Manufacturing Units Guidelines PDF
This graph or chart is linked to excel, and changes automatically based on data. Just left click on it and select Edit Data. Showcasing this set of slides titled Doughnut Graph Highlighting Production Volume Of Multiple Manufacturing Units Guidelines PDF. The topics addressed in these templates are Total Production, Manufacturing Unit, Washington. All the content presented in this PPT design is completely editable. Download it and make adjustments in color, background, font etc. as per your unique business setting.
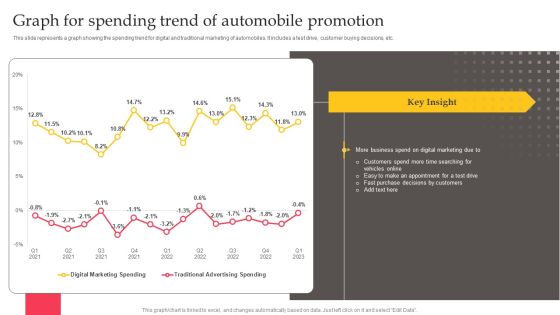
Executing Automotive Marketing Tactics For Sales Boost Graph For Spending Trend Information PDF
This slide represents a graph showing the spending trend for digital and traditional marketing of automobiles. It includes a test drive, customer buying decisions, etc. There are so many reasons you need a Executing Automotive Marketing Tactics For Sales Boost Graph For Spending Trend Information PDF. The first reason is you can not spend time making everything from scratch, Thus, Slidegeeks has made presentation templates for you too. You can easily download these templates from our website easily.

Collective Equity Funding Pitch Deck Shareholding Structure Graph Pre And Post Funding Graphics PDF
The slide provides the graph of shareholding structure at the time of founding, before crowdfunding and after crowdfunding. Deliver and pitch your topic in the best possible manner with this collective equity funding pitch deck shareholding structure graph pre and post funding graphics pdf. Use them to share invaluable insights on shareholding structure, investors, seed investors, employees and impress your audience. This template can be altered and modified as per your expectations. So, grab it now.

Subordinated Loan Funding Financial Graph Historical And Projection Ppt Model File Formats PDF
The slide provides the graph of companys financials revenue, operating income and net income for last 5 years historical and coming 4 years forecasted. Deliver and pitch your topic in the best possible manner with this subordinated loan funding financial graph historical and projection ppt model file formats pdf. Use them to share invaluable insights on revenue, operating income, net income, current year. and impress your audience. This template can be altered and modified as per your expectations. So, grab it now.

Mezzanine Venture Capital Funding Pitch Deck Financial Graph Historical And Projection Pictures PDF
The slide provides the graph of companys financials revenue operating income and net income for last five years historical and coming four years forecasted. Deliver and pitch your topic in the best possible manner with this mezzanine venture capital funding pitch deck financial graph historical and projection pictures pdf. Use them to share invaluable insights on financial, historical, projection, year, revenue and impress your audience. This template can be altered and modified as per your expectations. So, grab it now.
Mezzanine Debt Financing Pitch Deck Financial Graph Historical And Projection Demonstration PDF
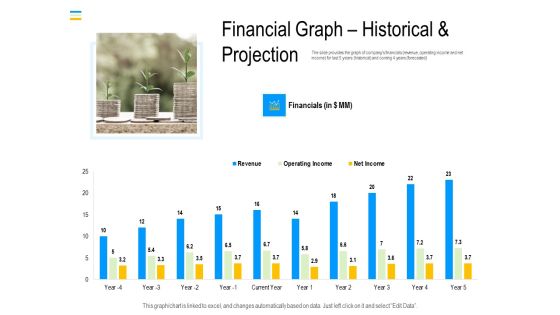
The slide provides the graph of companys financials revenue, operating income and net income for last five years historical and coming four years forecasted. Deliver and pitch your topic in the best possible manner with this mezzanine debt financing pitch deck financial graph historical and projection demonstration pdf. Use them to share invaluable insights on financials, revenue, operating income and impress your audience. This template can be altered and modified as per your expectations. So, grab it now.
Equity Crowd Investing Shareholding Structure Graph Pre And Post Funding Background PDF
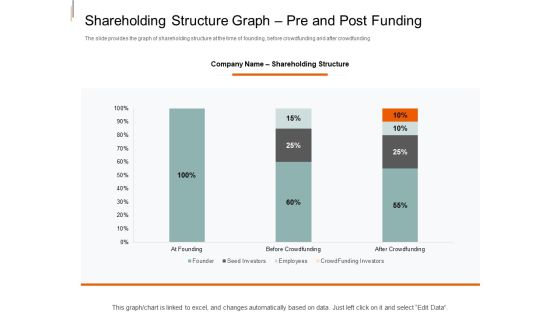
The slide provides the graph of shareholding structure at the time of founding, before crowdfunding and after crowdfunding. Deliver an awe inspiring pitch with this creative equity crowd investing shareholding structure graph pre and post funding background pdf bundle. Topics like founder, seed investors, employees, crowdfunding investors, before crowdfunding, after crowdfunding can be discussed with this completely editable template. It is available for immediate download depending on the needs and requirements of the user.

Convertible Preferred Stock Funding Pitch Deck Financial Graph Historical And Projection Themes PDF
The slide provides the graph of companys financials revenue, operating income and net income for the current year and the coming 4 years forecasted. Deliver an awe inspiring pitch with this creative convertible preferred stock funding pitch deck financial graph historical and projection themes pdf bundle. Topics like revenue, operating income, net income can be discussed with this completely editable template. It is available for immediate download depending on the needs and requirements of the user.
Option Pool Funding Pitch Deck Shareholding Structure Graph Pre And Post Funding Ppt Icon Rules PDF
The slide provides the graph of shareholding structure at the time of founding, before crowdfunding and after crowdfunding. Deliver an awe inspiring pitch with this creative option pool funding pitch deck shareholding structure graph pre and post funding ppt icon rules pdf bundle. Topics like founder, seed investors, employees, crowd funding investors can be discussed with this completely editable template. It is available for immediate download depending on the needs and requirements of the user.
Equity Crowdfunding Pitch Deck Shareholding Structure Graph Pre And Post Funding Ppt Summary Graphics Pictures PDF
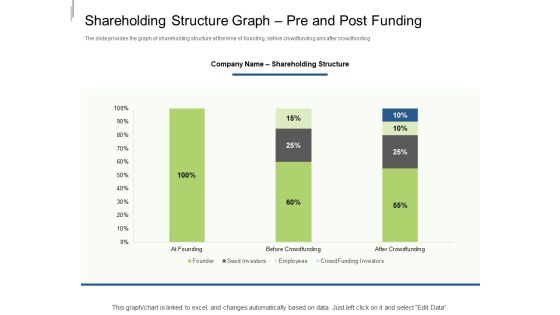
The slide provides the graph of shareholding structure at the time of founding, before crowdfunding and after crowdfunding. Deliver an awe inspiring pitch with this creative equity crowdfunding pitch deck shareholding structure graph pre and post funding ppt summary graphics pictures pdf bundle. Topics like founder, seed investors, employees, crowd funding investors can be discussed with this completely editable template. It is available for immediate download depending on the needs and requirements of the user.
 Home
Home