Bank Management
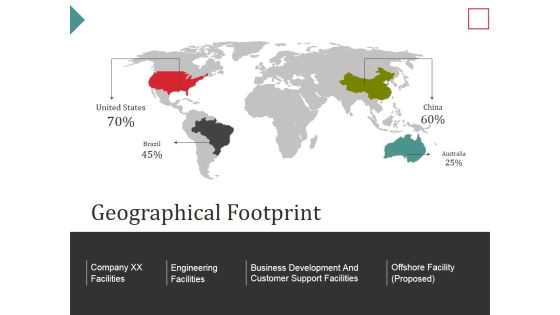
Geographical Footprint Ppt PowerPoint Presentation Pictures Visual Aids
This is a geographical footprint ppt powerpoint presentation pictures visual aids. This is a four stage process. The stages in this process are company xx facilities, engineering facilities, business development and customer support facilities, offshore facility proposed.
Revenue Split By Product And Segment Ppt PowerPoint Presentation Icon Design Inspiration
This is a revenue split by product and segment ppt powerpoint presentation icon design inspiration. This is a two stage process. The stages in this process are carbon steel, alloy steel, stainless steel, fitting.
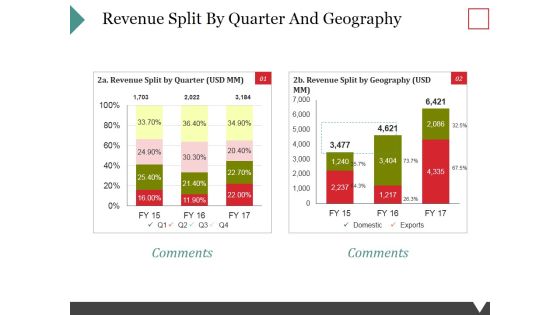
Revenue Split By Quarter And Geography Ppt PowerPoint Presentation Visual Aids Diagrams
This is a revenue split by quarter and geography ppt powerpoint presentation visual aids diagrams. This is a two stage process. The stages in this process are revenue split by quarter, revenue split by geography, domestic, exports.

Number Of Crowdfunding Platforms By Region Ppt PowerPoint Presentation Slides Graphics Example
This is a number of crowdfunding platforms by region ppt powerpoint presentation slides graphics example. This is a six stage process. The stages in this process are business, strategy, analysis, compare.

Measurement Of Portfolio Analysis Ppt Powerpoint Presentation Summary Outfit
This is a measurement of portfolio analysis ppt powerpoint presentation summary outfit. This is a three stage process. The stages in this process are holding, current weight, current value, your current portfolio.

Activity Ratios Template 1 Ppt PowerPoint Presentation File Layout Ideas
This is a activity ratios template 1 ppt powerpoint presentation file layout ideas. This is a two stage process. The stages in this process are business, comparison, strategy, analysis, success.

Activity Ratios Template 2 Ppt PowerPoint Presentation Infographic Template Slide Portrait
This is a activity ratios template 2 ppt powerpoint presentation infographic template slide portrait. This is a two stage process. The stages in this process are inventory turnover, receivable turnover.

Activity Ratios Template 3 Ppt PowerPoint Presentation Visual Aids Example 2015
This is a activity ratios template 3 ppt powerpoint presentation visual aids example 2015. This is a two stage process. The stages in this process are total asset turnover, fixed asset turnover.

Activity Ratios Template 4 Ppt PowerPoint Presentation Slides Example Introduction
This is a activity ratios template 4 ppt powerpoint presentation slides example introduction. This is a two stage process. The stages in this process are total asset turnover, fixed asset turnover.

Balance Sheet Kpis Template 1 Ppt PowerPoint Presentation Styles Layout Ideas
This is a balance sheet kpis template 1 ppt powerpoint presentation styles layout ideas. This is a four stage process. The stages in this process are current assets, current liabilities, total assets, total liabilities.

Column Chart Template 1 Ppt PowerPoint Presentation Professional Backgrounds
This is a column chart template 1 ppt powerpoint presentation professional backgrounds. This is a nine stage process. The stages in this process are column chart, product, growth, strategy, analysis, business.

Column Chart Template 2 Ppt PowerPoint Presentation Professional Slide
This is a column chart template 2 ppt powerpoint presentation professional slide. This is a nine stage process. The stages in this process are column chart, product, growth, strategy, analysis, business.

High Low Close Chart Ppt PowerPoint Presentation Professional Background Images
This is a high low close chart ppt powerpoint presentation professional background images. This is a five stage process. The stages in this process are close, high, volume, low, open.

Positioning Strategies Consumer Durable Sector Ppt PowerPoint Presentation Infographics Slide Portrait
This is a positioning strategies consumer durable sector ppt powerpoint presentation infographics slide portrait. This is a five stage process. The stages in this process are corporate identity, surrogate, benefit, competitive, lifestyle.
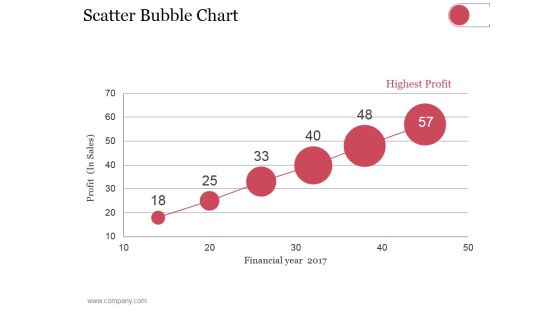
Scatter Bubble Chart Ppt PowerPoint Presentation Summary Pictures
This is a scatter bubble chart ppt powerpoint presentation summary pictures. This is a six stage process. The stages in this process are highest profit, financial year, profit in sales.

Competitor Positioning Ppt PowerPoint Presentation Pictures File Formats
This is a competitor positioning ppt powerpoint presentation pictures file formats. This is a two stage process. The stages in this process are business, strategy, analysis, planning, market growth, company growth.
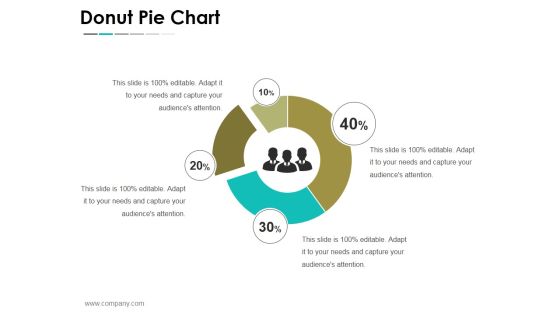
Donut Pie Chart Ppt PowerPoint Presentation File Slideshow
This is a donut pie chart ppt powerpoint presentation file slideshow. This is a four stage process. The stages in this process are business, strategy, analysis, planning, donut pie chart.
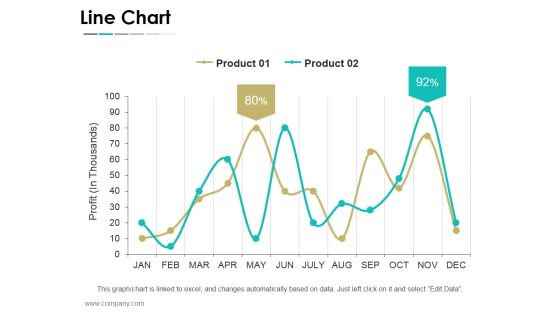
Line Chart Ppt PowerPoint Presentation File Graphics Template
This is a line chart ppt powerpoint presentation file graphics template. This is a twelve stage process. The stages in this process are business, strategy, marketing, success, line chart.
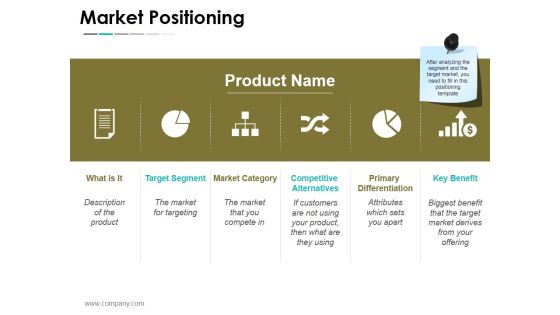
Market Positioning Ppt PowerPoint Presentation File Show
This is a market positioning ppt powerpoint presentation file show. This is a six stage process. The stages in this process are product name, market category, competitive, alternatives, primary, differentiation, key benefit, target segment.
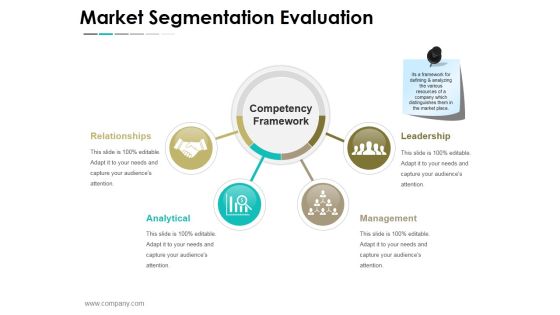
Market Segmentation Evaluation Ppt PowerPoint Presentation Layouts Images
This is a market segmentation evaluation ppt powerpoint presentation layouts images. This is a two stage process. The stages in this process are market sales, net profit, confectionary, milk products, beverages, nutrition and health care.
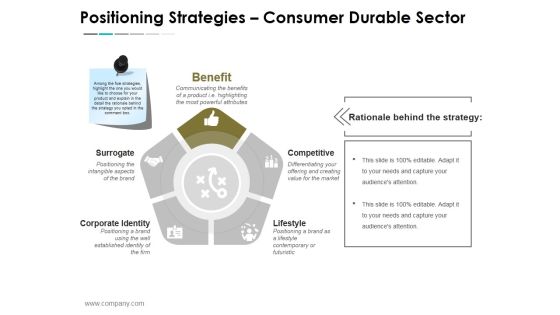
Positioning Strategies Consumer Durable Sector Ppt PowerPoint Presentation Ideas Designs
This is a positioning strategies consumer durable sector ppt powerpoint presentation ideas designs. This is a five stage process. The stages in this process are benefit, competitive, lifestyle, surrogate, corporate identity.

Scatter With Smooth Lines And Markers Ppt PowerPoint Presentation Show Template
This is a scatter with smooth lines and markers ppt powerpoint presentation show template. This is a nine stage process. The stages in this process are business, strategy, marketing, success, dollar in billions, profit in thousands.
Stacked Line With Marker Ppt PowerPoint Presentation Icon Format
This is a stacked line with marker ppt powerpoint presentation icon format. This is a twelve stage process. The stages in this process are business, strategy, marketing, success, profit million dollars, stacked column.
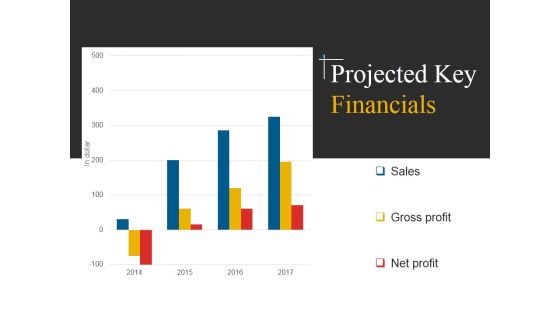
Projected Key Financials Template 2 Ppt PowerPoint Presentation Inspiration Example File
This is a projected key financials template 2 ppt powerpoint presentation inspiration example file. This is a four stage process. The stages in this process are sales, gross profit, net profit.
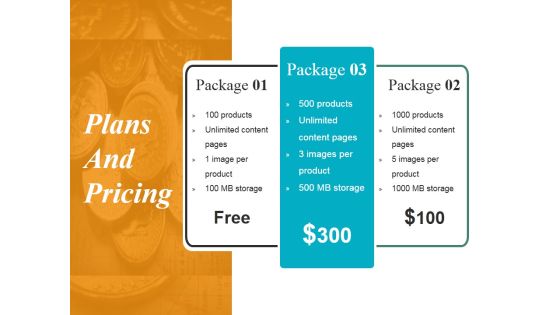
Plans And Pricing Ppt PowerPoint Presentation Infographics Portfolio
This is a plans and pricing ppt powerpoint presentation infographics portfolio. This is a three stage process. The stages in this process are package, free, images per product, unlimited content pages.
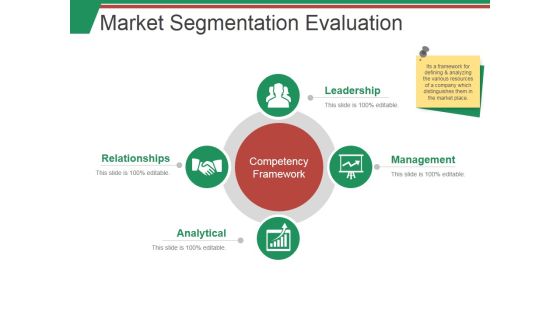
Market Segmentation Evaluation Template 1 Ppt PowerPoint Presentation Summary Smartart
This is a market segmentation evaluation template 1 ppt powerpoint presentation summary smartart. This is a two stage process. The stages in this process are market sales, net profit, beverages, milk product, nutrition.

Volume High Low Close Chart Ppt PowerPoint Presentation Outline Examples
This is a volume high low close chart ppt powerpoint presentation outline examples. This is a five stage process. The stages in this process are high, low, volume, graph, business.

Our Strategic Positioning Template 1 Ppt PowerPoint Presentation Summary Images
This is a our strategic positioning template 1 ppt powerpoint presentation summary images. This is a two stage process. The stages in this process are business, chess, game, strategy, marketing, analysis.
Our Strategic Positioning Template 2 Ppt PowerPoint Presentation Icon Deck
This is a our strategic positioning template 2 ppt powerpoint presentation icon deck. This is a two stage process. The stages in this process are business, chess, game, strategy, marketing, analysis.
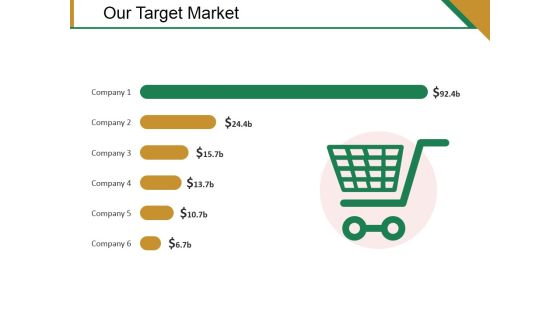
Our Target Market Template 1 Ppt PowerPoint Presentation Inspiration Slides
This is a our target market template 1 ppt powerpoint presentation inspiration slides. This is a six stage process. The stages in this process are business, marketing, strategy, target, success.

Projected Key Financials Template 1 Ppt PowerPoint Presentation File Portfolio
This is a projected key financials template 1 ppt powerpoint presentation file portfolio. This is a three stage process. The stages in this process are sales, gross profit, net profit.
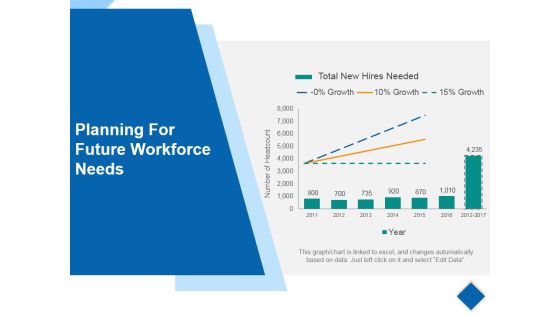
Planning For Future Workforce Needs Ppt PowerPoint Presentation Professional Slide
This is a planning for future workforce needs ppt powerpoint presentation professional slide. This is a seven stage process. The stages in this process are total new hires needed, business, graph, success, growth.

Current Staff Composition Ppt PowerPoint Presentation Outline Example File
This is a current staff composition ppt powerpoint presentation outline example file. This is a five stage process. The stages in this process are business, staff composition, category, percentage.

Current Staff Profile Years Of Experience Needs Ppt PowerPoint Presentation Portfolio Deck
This is a current staff profile years of experience needs ppt powerpoint presentation portfolio deck. This is a four stage process. The stages in this process are least experience, staff types, percentage of staff.
My Goal Ppt PowerPoint Presentation Slides Good
This is a my goal ppt powerpoint presentation slides good. This is a four stage process. The stages in this process are my goal, competition, strategy, marketing, analysis, business.

Strategic Plan Template 2 Ppt PowerPoint Presentation Summary Graphic Images
This is a strategic plan template 2 ppt powerpoint presentation summary graphic images. This is a ten stage process. The stages in this process are increase, decrease, stable, environment restrictions.

Activity Ratios Template 1 Ppt PowerPoint Presentation Outline Design Templates
This is a activity ratios template 1 ppt powerpoint presentation outline design templates. This is a two stage process. The stages in this process are inventory turnover, receivable turnover, graph, success, growth.

Activity Ratios Template 3 Ppt PowerPoint Presentation Professional Example
This is a activity ratios template 3 ppt powerpoint presentation professional example. This is a two stage process. The stages in this process are total asset turnover, net sales, fixed assets turnover, fixed assets.

Activity Ratios Template Ppt PowerPoint Presentation Summary Slides
This is a activity ratios template ppt powerpoint presentation summary slides. This is a two stage process. The stages in this process are total asset turnover, net sales, fixed assets turnover, fixed assets.

Activity Ratios Ppt PowerPoint Presentation Icon Themes
This is a activity ratios ppt powerpoint presentation icon themes. This is a two stage process. The stages in this process are inventory turnover, cogs, average inventory, receivable turnover, net credit sales, average accounts receivable .

Current Staff Profile Years Of Experience Ppt PowerPoint Presentation Infographics Example
This is a current staff profile years of experience ppt powerpoint presentation infographics example. This is a four stage process. The stages in this process are years of experience of hospital staff, least experience, staff types.
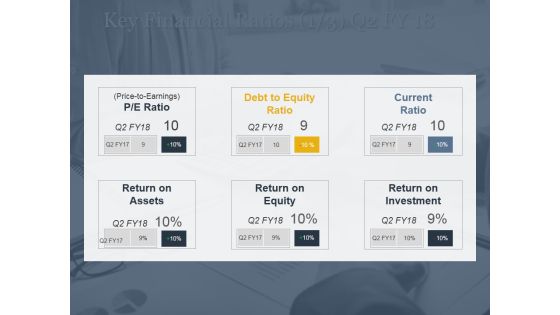
Key Financial Ratios Ppt PowerPoint Presentation Model Objects
This is a key financial ratios ppt powerpoint presentation model objects. This is a three stage process. The stages in this process are p e ratio, price to earnings, debt, equity ratio, current, ratio.
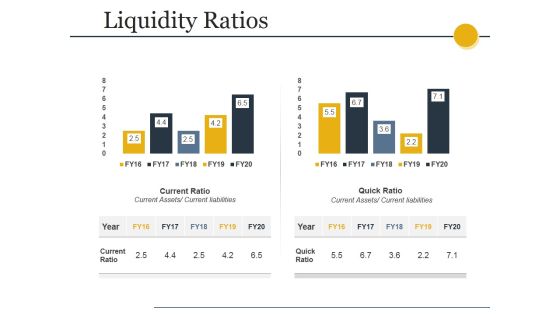
Liquidity Ratios Ppt PowerPoint Presentation Summary Gallery
This is a liquidity ratios ppt powerpoint presentation summary gallery. This is a two stage process. The stages in this process are current ratio, current assets current liabilities, quick ratio, current assets current liabilities.

Profitability Ratios Template Ppt PowerPoint Presentation Styles Slide
This is a profitability ratios template ppt powerpoint presentation styles slide. This is a two stage process. The stages in this process are net profit ratio, net profit after tax net sales, gross profit ratio, gross profit net sales.
Solvency Ratios Template Ppt PowerPoint Presentation Inspiration Icons
This is a solvency ratios template ppt powerpoint presentation inspiration icons. This is a two stage process. The stages in this process are debt equity ratio, total liabilities total equity, time interest earned ratio, ebit interest expense.

Solvency Ratios Ppt PowerPoint Presentation Inspiration Guidelines
This is a solvency ratios ppt powerpoint presentation inspiration guidelines. This is a two stage process. The stages in this process are debt equity ratio, total liabilities total equity, time interest earned ratio, ebit interest expense.

Combo Chart Ppt PowerPoint Presentation Infographic Template Brochure
This is a combo chart ppt powerpoint presentation infographic template brochure. This is a eight stage process. The stages in this process are product, market size, strategy, business, marketing.

Scatter Bubble Chart Ppt PowerPoint Presentation Diagram Ppt
This is a scatter bubble chart ppt powerpoint presentation diagram ppt. This is a two stage process. The stages in this process are product, in price, highest sale, percentage, business, marketing.

Addressable Market In Sector 1 Ppt PowerPoint Presentation Ideas Icons
This is a addressable market in sector 1 ppt powerpoint presentation ideas icons. This is a two stage process. The stages in this process are fossil fuels, nuclear, bioenergy, biofuels.
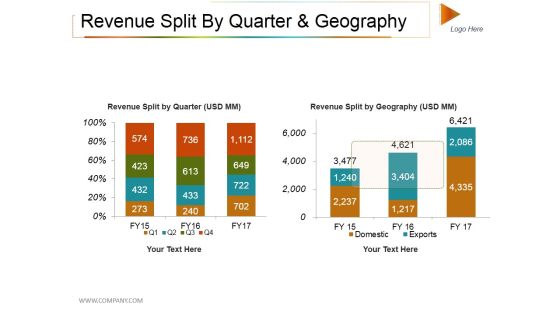
Revenue Split By Quarter And Geography Ppt PowerPoint Presentation Professional Slide Download
This is a revenue split by quarter and geography ppt powerpoint presentation professional slide download. This is a two stage process. The stages in this process are domestic, exports, revenue split by quarter, revenue split by geography.

Balance Sheet Kpis Tabular Form Ppt PowerPoint Presentation Show Example Introduction
This is a balance sheet kpis tabular form ppt powerpoint presentation show example introduction. This is a four stage process. The stages in this process are current assets, current liabilities, total assets, total liabilities.

Financial Summary Ppt PowerPoint Presentation Professional Template
This is a financial summary ppt powerpoint presentation professional template. This is a two stage process. The stages in this process are revenue growth, net, profit margin, ebitda, net revenue, net profit.
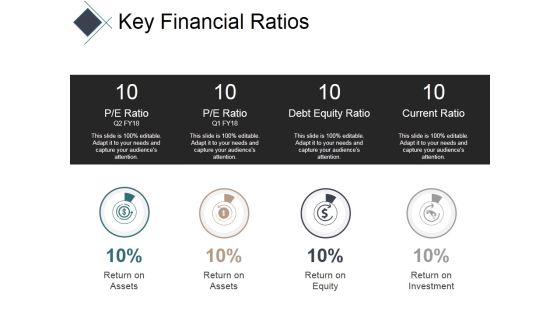
Key Financial Ratios Ppt PowerPoint Presentation Summary Inspiration
This is a key financial ratios ppt powerpoint presentation summary inspiration. This is a four stage process. The stages in this process are pe ratio, debt equity ratio, current ratio.

Competitive Analysis Template 6 Scatter Chart Ppt PowerPoint Presentation Icon Example Topics
This is a competitive analysis template 6 scatter chart ppt powerpoint presentation icon example topics. This is a eight stage process. The stages in this process are users interface, data import, example, pricing, support, update, tutorials, easy to use.
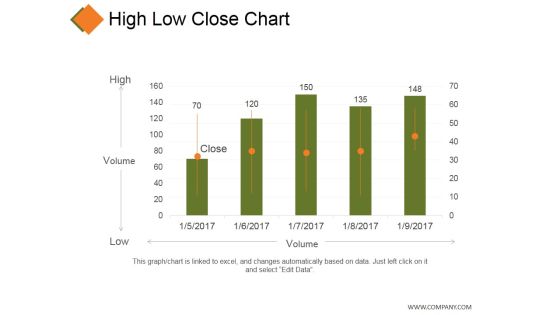
High Low Close Chart Ppt PowerPoint Presentation Model Grid
This is a high low close chart ppt powerpoint presentation model grid. This is a five stage process. The stages in this process are business, high, volume, low, marketing.

Business Operations Summary Ppt PowerPoint Presentation Model Graphics Template
This is a business operations summary ppt powerpoint presentation model graphics template. This is a eight stage process. The stages in this process are net operating margin, productivity customer, retention rate.

Types Of Channel Promotion Used Ppt PowerPoint Presentation Outline Display
This is a types of channel promotion used ppt powerpoint presentation outline display. This is a ten stage process. The stages in this process are bar graph, business, marketing, strategy, charts.
Pandl Kpis Tabular Form Ppt PowerPoint Presentation Gallery Icon
This is a pandl kpis tabular form ppt powerpoint presentation gallery icon. This is a four stage process. The stages in this process are revenue, cogs, operating profit, net profit.

Bases Of Segmenting The Market Ppt PowerPoint Presentation Inspiration Clipart
This is a bases of segmenting the market ppt powerpoint presentation inspiration clipart. This is a four stage process. The stages in this process are geographic, demographic, behavioral, psychographic, icons.

Sales Highlights Ppt PowerPoint Presentation Infographic Template Show
This is a sales highlights ppt powerpoint presentation infographic template show. This is a four stage process. The stages in this process are lead sources revenue share, total sales by month, opportunities total sales by probability, win loss ratio.
 Home
Home