Bank Management

Financial Liberalization Growth Diagram Powerpoint Presentation
This is a financial liberalization growth diagram powerpoint presentation. This is a five stage process. The stages in this process are liberalization, pop growth, enrollment, gov gdp, life experience.
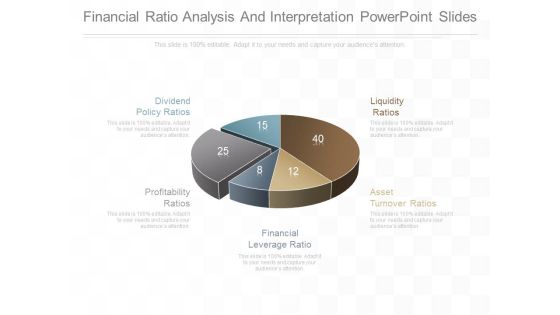
Financial Ratio Analysis And Interpretation Powerpoint Slides
This is a financial ratio analysis and interpretation powerpoint slides. This is a five stage process. The stages in this process are dividend policy ratios, profitability ratios, financial leverage ratio, asset turnover ratios, liquidity ratios.

Identify Insights Diagram Powerpoint Slides
This is a identify insights diagram powerpoint slides. This is a five stage process. The stages in this process are identify insights, establish design criteria, brainstorm ideas, develop concept, surface key assumption.
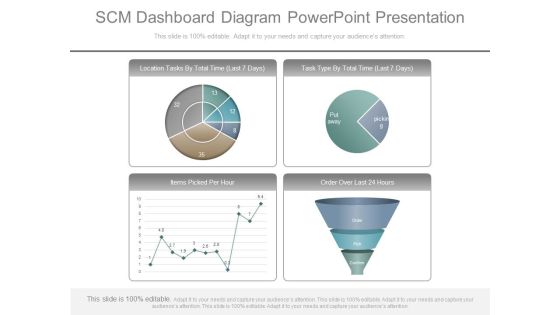
Scm Dashboard Diagram Powerpoint Presentation
This is a scm dashboard diagram powerpoint presentation. This is a four stage process. The stages in this process are location tasks by total time, task type by total time, items picked per hour, order over last.
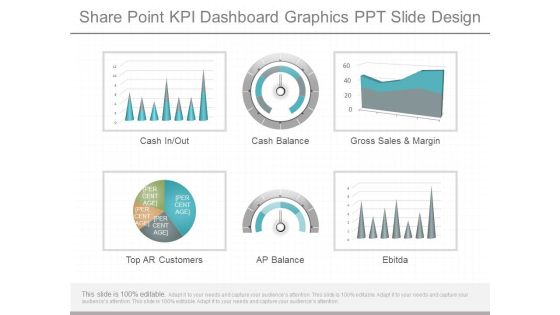
Share Point Kpi Dashboard Graphics Ppt Slide Design
This is a share point kpi dashboard graphics ppt slide design. This is a six stage process. The stages in this process are cash in out, cash balance, gross sales and margin, top ar customers, ap balance, ebitda.
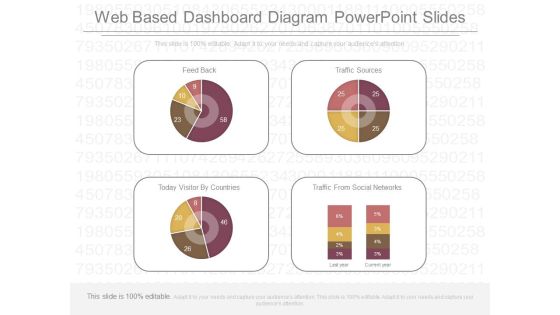
Web Based Dashboard Diagram Powerpoint Slides
This is a web based dashboard diagram powerpoint slides. This is a four stage process. The stages in this process are feed back, traffic sources, today visitor by countries, traffic from social networks.
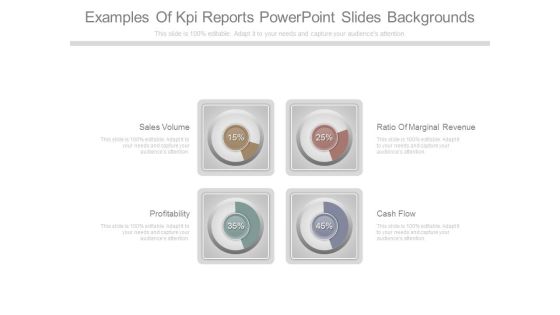
Examples Of Kpi Reports Powerpoint Slides Backgrounds
This is a examples of kpi reports powerpoint slides backgrounds. This is a four stage process. The stages in this process are sales volume, profitability, ratio of marginal revenue, cash flow.

Average Days Sales Outstanding Analysis Ppt Example
This is a average days sales outstanding analysis ppt example. This is a four stage process. The stages in this process are target for week, inventory, sales vs quotes, sales vs quotes.

Build Dashboard For Business Diagram Powerpoint Show
This is a build dashboard for business diagram powerpoint show. This is a four stage process. The stages in this process are average internal pv examination lead time, average entry variance, average internal audit lead time, amount contribution.

Business Intelligence Dashboard Design Ppt Powerpoint Topics
This is a business intelligence dashboard design ppt powerpoint topics. This is a four stage process. The stages in this process are sales analysis, sales forecasting, global distribution, sales by region, latin america, north america, eastern europe, western europe.

Capital Markets Dashboard Ppt Powerpoint Slide Background
This is a capital markets dashboard ppt powerpoint slide background. This is a three stage process. The stages in this process are weekly sales, product inventory, key performance indicators.

Competitive Intelligence Dashboard Diagram Ppt Slides
This is a competitive intelligence dashboard diagram ppt slides. This is a four stage process. The stages in this process are monthly sales, inventory turns, customer complaints, company, subject area.

Dashboard Design And Development For Travel Diagram Background
This is a dashboard design and development for travel diagram background. This is a five stage process. The stages in this process are number of trips, sales, delayed flights, regional load, flight expense.

Dashboard For Six Sigma Ppt Powerpoint Templates
This is a dashboard for six sigma ppt powerpoint templates. This is a four stage process. The stages in this process are program savings, project count, project cycle time, six sigma training.

Average Profit Margin Examples Presentation Slides
This is a average profit margin examples presentation slides. This is a five stage process. The stages in this process are sales growth, sales opportunities, product performance, average profit margin, sales target.
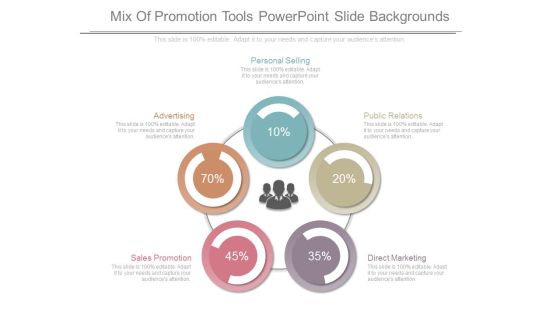
Mix Of Promotion Tools Powerpoint Slide Backgrounds
This is a mix of promotion tools powerpoint slide backgrounds. This is a five stage process. The stages in this process are personal selling, public relations, direct marketing, advertising, sales promotion.

Agile Lean Development Methodologies Diagram Sample Ppt Files
This is a agile lean development methodologies diagram sample ppt files. This is a four stage process. The stages in this process are create flow, brainstorm, design, establish pull.
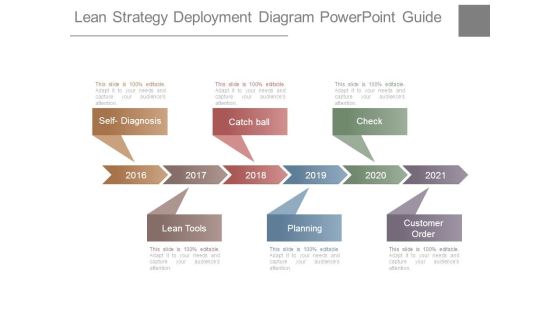
Lean Strategy Deployment Diagram Powerpoint Guide
This is a lean strategy deployment diagram powerpoint guide. This is a six stage process. The stages in this process are self diagnosis, catch ball, check, lean tools, planning, customer order.

Customer Satisfaction Diagram Ppt Slide Themes
This is a customer satisfaction diagram ppt slide themes. This is a four stage process. The stages in this process are customer grievances, customer property, timely supply, gain name in the market.
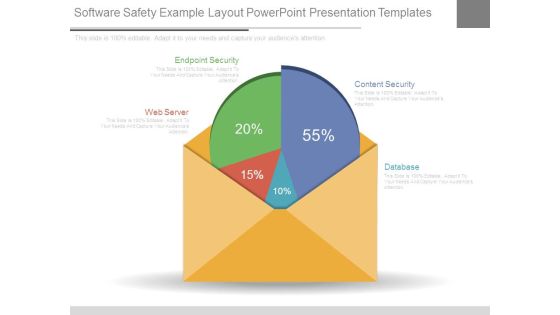
Software Safety Example Layout Powerpoint Presentation Templates
This is a software safety example layout powerpoint presentation templates. This is a four stage process. The stages in this process are web server, endpoint security, content security, database.

Kpi Dashboard Framework Ppt Powerpoint Slide Images
This is a kpi dashboard framework ppt powerpoint slide images. This is a five stage process. The stages in this process are business metrics, customer metrics, operational metrics, channel metrics, marketing metrics.

Kpis And Operations Metrics Presentation Powerpoint Example
This is a kpis and operations metrics presentation powerpoint example. This is a five stage process. The stages in this process are customer class, affiliate, sales by warehouse, warehouse, profit by affiliate.

Consumer Buying Behaviour Powerpoint Slide Presentation Sample
This is a consumer buying behaviour powerpoint slide presentation sample. This is a two stage process. The stages in this process are 7 out of 10 people bought online, now 8 out of 10 buy online.
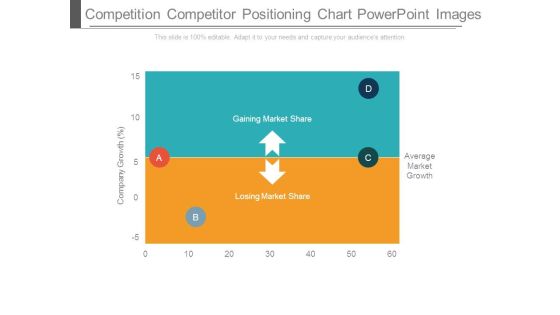
Competition Competitor Positioning Chart Powerpoint Images
This is a competition competitor positioning chart powerpoint images. This is a four stage process. The stages in this process are gaining market share, losing market share, average market growth, company growth.
Market Share And Competitor Positioning Graph Ppt Icon
This is a market share and competitor positioning graph ppt icon. This is a four stage process. The stages in this process are average market growth, company growth, gaining market share, losing market share.

Financial Analysis Ratios Ppt Slide Themes
This is a financial analysis ratios ppt slide themes. This is a five stage process. The stages in this process are liquidity ratio, asset turnover ratios, financial leverage ratios, profitability ratios, dividend policy ratios.

Strategy B2b Of Digital Marketing Template Good Ppt Example
This is a strategy b2b of digital marketing template good ppt example. This is a four stage process. The stages in this process are design, marketing, digital strategy, development.
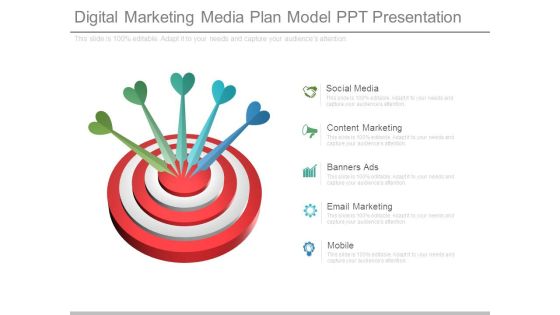
Digital Marketing Media Plan Model Ppt Presentation
This is a digital marketing media plan model ppt presentation. This is a five stage process. The stages in this process are social media, content marketing, banners ads, email marketing, mobile.

Sales And Marketing Plan Gantt Chart Ppt Examples Slides
This is a sales and marketing plan gantt chart ppt examples slides. This is a three stage process. The stages in this process are sales goal, sales actual, banner ads, newspaper, in store marketing.
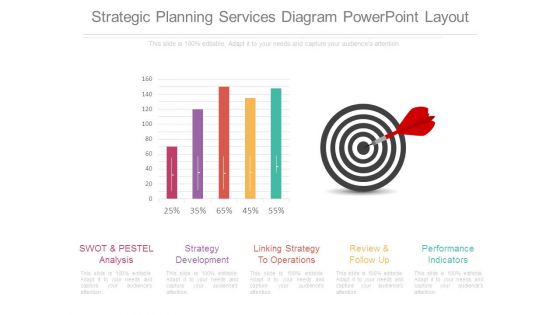
Strategic Planning Services Diagram Powerpoint Layout
This is a strategic planning services diagram powerpoint layout. This is a five stage process. The stages in this process are swot and pestel analysis, strategy development, linking strategy to operations, review and follow up, performance indicators.
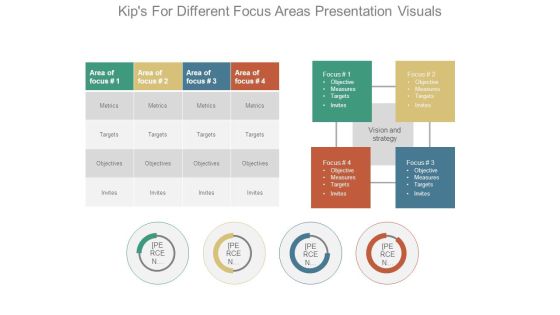
Kips For Different Focus Areas Presentation Visuals
This is a kips for different focus areas presentation visuals. This is a four stage process. The stages in this process are area of focus, metrics, targets, objectives, invites, vision and strategy, focus.
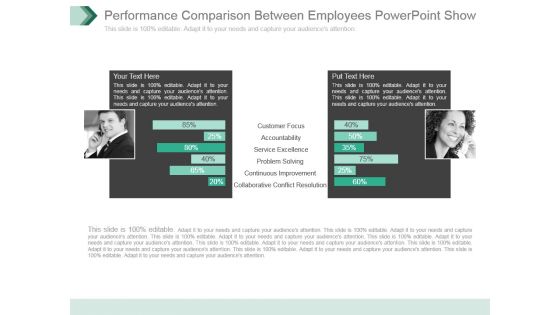
Performance Comparison Between Employees Powerpoint Show
This is a performance comparison between employees powerpoint show. This is a two stage process. The stages in this process are customer focus, accountability, service excellence, problem solving, continuous improvement, collaborative conflict resolution.
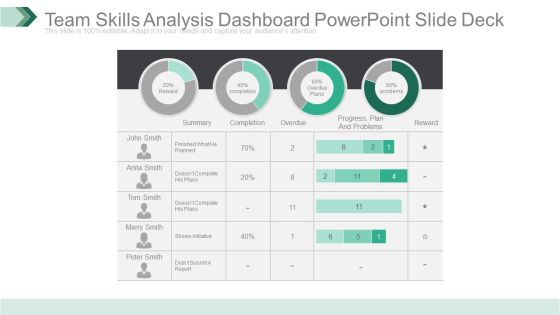
Team Skills Analysis Dashboard Powerpoint Slide Deck
This is a team skills analysis dashboard powerpoint slide deck. This is a four stage process. The stages in this process are reward, summary, completion, overdue, progress plan and problems, problems, reward.
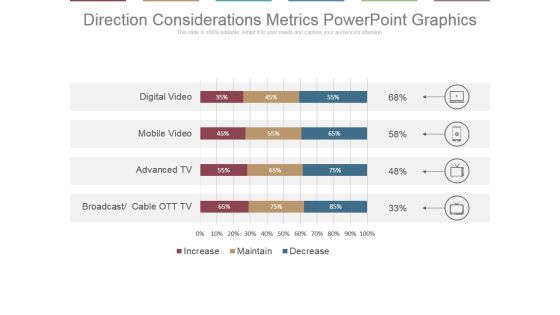
Direction Considerations Metrics Powerpoint Graphics
This is a direction considerations metrics powerpoint graphics. This is a four stage process. The stages in this process are digital video, mobile video, advanced tv, broadcast, cable ott tv.
Spending Directions For Media Channels Ppt Icon
This is a spending directions for media channels ppt icon. This is a four stage process. The stages in this process are digital video, mobile video, advanced tv, broadcast, cable ott tv.

Kpi Dashboard For Operations Powerpoint Slide Images
This is a kpi dashboard for operations powerpoint slide images. This is a four stage process. The stages in this process are outcasts, earned revenue, operations, successful adverts, sold products.

Workforce Performance Comparison Chart Powerpoint Slides Templates
This is a workforce performance comparison chart powerpoint slides templates. This is a two stage process. The stages in this process are customer focus, accountability, service excellence, problem solving, continuous improvement, collaborative conflict resolution.

Employee Performance Comparison Ppt Infographics
This is a employee performance comparison ppt infographics. This is a two stage process. The stages in this process are customer focus, accountability, service excellence, problem solving, continuous improvement, collaborative conflict resolution.

Charts For Portfolio Evaluation Techniques Example Ppt Presentation
This is a charts for portfolio evaluation techniques example ppt presentation. This is a five stage process. The stages in this process are peso govt debt securities, foreign govt debt securities, peso corporate debt securities, dollar corporate debt securities, equity.

Customer Lifetime Value Model Powerpoint Shapes
This is a customer lifetime value model powerpoint shapes. This is a three stage process. The stages in this process are inactive nonprofit able customer, active profitable customers, very active very profitable customers.

Matrix Design For Business Financial Development Ppt Slide Styles
This is a matrix design for business financial development ppt slide styles. This is a four stage process. The stages in this process are establish context, identify question type, strategic matrix, increase revenues.

Competitive Analysis Report On Key Success Factors Ppt PowerPoint Presentation Infographic Template
This is a competitive analysis report on key success factors ppt powerpoint presentation infographic template. This is a five stage process. The stages in this process are key industry success factors, extensive distribution, customer focus, economies of scale, product innovation.

Competitor Analysis Tools Ppt PowerPoint Presentation Example File
This is a competitor analysis tools ppt powerpoint presentation example file. This is a five stage process. The stages in this process are criteria, revenue, profit, market share, main activity, number of employee, product quality.
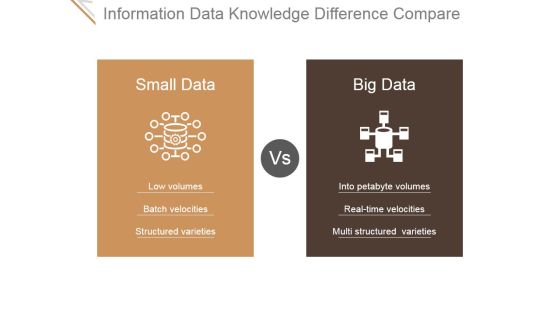
Information Data Knowledge Difference Compare Ppt PowerPoint Presentation Samples
This is a information data knowledge difference compare ppt powerpoint presentation samples. This is a two stage process. The stages in this process are low volumes, batch velocities, structured varieties, into petabyte volumes, real time velocities, multi structured varieties.

Improved Customer Service Experience Pie Charts Ppt PowerPoint Presentation Templates
This is a improved customer service experience pie charts ppt powerpoint presentation templates. This is a four stage process. The stages in this process are increased efficiency, better business decision making, improved customer experience and engagement, achieved financial savings.

Company Annual Report Table With Percentages Ppt PowerPoint Presentation Slides
This is a company annual report table with percentages ppt powerpoint presentation slides. This is ten stage process. The stages in this process are send date time, email name, recipients, delivered, spam, opt out, open, transactions, revenue.

Company Cash Flow Statement Over Years Ppt PowerPoint Presentation Gallery
This is a company cash flow statement over years ppt powerpoint presentation gallery. This is ten stage process. The stages in this process are financial result, financial position, share capital, equity share data.

Competitors Marketing Plan Ppt PowerPoint Presentation Visual Aids
This is a competitors marketing plan ppt powerpoint presentation visual aids. This is a eight stage process. The stages in this process are blogging, social media, white papers, webinars, newsletter, video, call to action, infographics.

5 Stage Input Funnel For Results Ppt PowerPoint Presentation Background Designs
This is a 5 stage input funnel for results ppt powerpoint presentation background designs. This is a five stage process. The stages in this process are adapt it to your needs and capture your audiences attention.
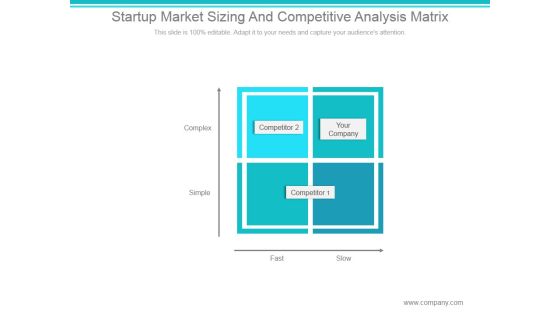
Startup Market Sizing And Competitive Analysis Matrix Ppt PowerPoint Presentation Infographic Template
This is a startup market sizing and competitive analysis matrix ppt powerpoint presentation infographic template. This is a four stage process. The stages in this process are complex, simple, fast, slow, competitor, your company.

Company Mission Statement Ppt PowerPoint Presentation Background Images
This is a company mission statement ppt powerpoint presentation background images. This is a one stage process. The stages in this process are business, mission, vision, marketing, icons, target.

Competitor Analysis Overview Ppt PowerPoint Presentation Images
This is a competitor analysis overview ppt powerpoint presentation images. This is a eight stage process. The stages in this process are number of competitors, number of companies that exited, replacement, rate, industrial cameras, replacement, rate frame, grabbe.

Market Size By Value Ppt PowerPoint Presentation Designs Download
This is a market size by value ppt powerpoint presentation designs download. This is a three stage process. The stages in this process are the united states, middle east and africa, asia pacific.

Bar Graph To Showcase Financial Analysis Ppt PowerPoint Presentation Professional
This is a bar graph to showcase financial analysis ppt powerpoint presentation professional. This is a four stage process. The stages in this process are business, marketing, growth, success, arrows.

Identifying Market Trends Current Number Ppt PowerPoint Presentation Slides
This is a identifying market trends current number ppt powerpoint presentation slides. This is a seven stage process. The stages in this process are latin america, canada, japan, europe, asia pacific, us.

Measuring Content Marketing Performance Ppt PowerPoint Presentation Design Ideas
This is a measuring content marketing performance ppt powerpoint presentation design ideas. This is a eight stage process. The stages in this process are conversion rate, quality of leads, website traffic, number of leads, sales revenue, subscriber list growth.

Bar Graph For Sales Revenue Over The Years Ppt PowerPoint Presentation Professional
This is a bar graph for sales revenue over the years ppt powerpoint presentation professional. This is a nine stage process. The stages in this process are business, marketing, growth, bar, years.

Content Marketing Performance Evaluation Ppt PowerPoint Presentation Influencers
This is a content marketing performance evaluation ppt powerpoint presentation influencers. This is a eight stage process. The stages in this process are brand awareness, engagement, sales, lead generation, customer retention, lead nurturing.
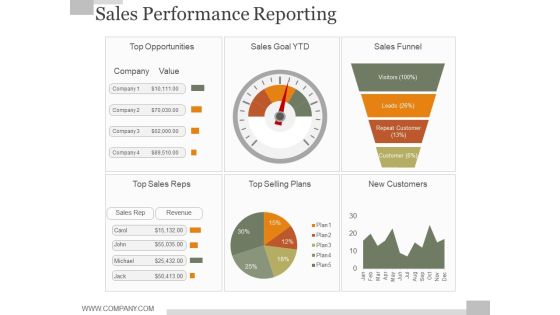
Sales Performance Reporting Ppt PowerPoint Presentation Styles
This is a sales performance reporting ppt powerpoint presentation styles. This is a four stage process. The stages in this process are top opportunities, sales goal ytd, sales funnel, top sales reps, top selling plans, new customers.

Customer Revenue Model Ppt PowerPoint Presentation Designs Download
This is a customer revenue model ppt powerpoint presentation designs download. This is a eleven stage process. The stages in this process are email, display, brand paid search, comparison shopping, business, non brand paid search.
 Home
Home