AI PPT Maker
Templates
PPT Bundles
Design Services
Business PPTs
Business Plan
Management
Strategy
Introduction PPT
Roadmap
Self Introduction
Timelines
Process
Marketing
Agenda
Technology
Medical
Startup Business Plan
Cyber Security
Dashboards
SWOT
Proposals
Education
Pitch Deck
Digital Marketing
KPIs
Project Management
Product Management
Artificial Intelligence
Target Market
Communication
Supply Chain
Google Slides
Research Services
 One Pagers
All Categories
-
Home
- Customer Favorites
- Bank Icon
Bank Icon

Brand Engagement Promotional Campaign Implementation Key Impact Of Promotional Event For Brand Awareness Diagrams PDF
This slide represents key impacts for promotional event. It covers site traffic, ROAS, customer lifetime value, engaged visit rate, page value etc. Find a pre designed and impeccable Brand Engagement Promotional Campaign Implementation Key Impact Of Promotional Event For Brand Awareness Diagrams PDF. The templates can ace your presentation without additional effort. You can download these easy to edit presentation templates to make your presentation stand out from others. So, what are you waiting for Download the template from Slidegeeks today and give a unique touch to your presentation.

Ad And Media Agency Company Profile Revenue And Net Profits Diagrams PDF
This slide focuses on financial highlights of advertising agency which represents revenue and net profits for last five years from 2018 to 2022. Welcome to our selection of the Ad And Media Agency Company Profile Revenue And Net Profits Diagrams PDF. These are designed to help you showcase your creativity and bring your sphere to life. Planning and Innovation are essential for any business that is just starting out. This collection contains the designs that you need for your everyday presentations. All of our PowerPoints are 100 percent editable, so you can customize them to suit your needs. This multi-purpose template can be used in various situations. Grab these presentation templates today.
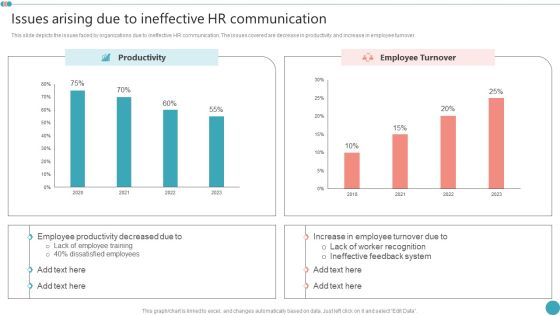
Issues Arising Due To Ineffective HR Communication Employee Engagement HR Strategy At Organization Diagrams PDF
This slide depicts the issues faced by organizations due to ineffective HR communication. The issues covered are decrease in productivity and increase in employee turnover.Want to ace your presentation in front of a live audience Our Issues Arising Due To Ineffective HR Communication Employee Engagement HR Strategy At Organization Diagrams PDF can help you do that by engaging all the users towards you.. Slidegeeks experts have put their efforts and expertise into creating these impeccable powerpoint presentations so that you can communicate your ideas clearly. Moreover, all the templates are customizable, and easy-to-edit and downloadable. Use these for both personal and commercial use.
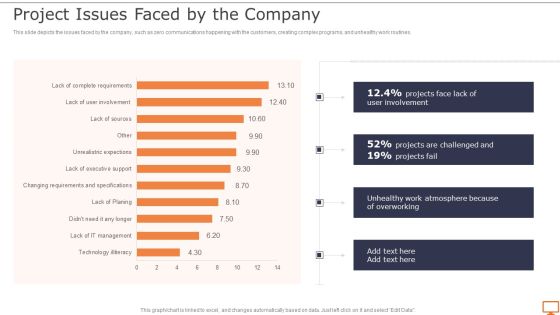
Deploying XP Practices To Enhance Operational Efficiency Project Issues Faced By The Company Diagrams PDF
This slide depicts the issues faced by the company, such as zero communications happening with the customers, creating complex programs, and unhealthy work routines.Want to ace your presentation in front of a live audience Our Deploying XP Practices To Enhance Operational Efficiency Project Issues Faced By The Company Diagrams PDF can help you do that by engaging all the users towards you.. Slidegeeks experts have put their efforts and expertise into creating these impeccable powerpoint presentations so that you can communicate your ideas clearly. Moreover, all the templates are customizable, and easy-to-edit and downloadable. Use these for both personal and commercial use.

Strategic Risk Management And Mitigation Plan Enterprise Cyber Risk Management Dashboard Diagrams PDF
This slide represents dashboard representing details related to management of strategic risks in the organization. It includes details related to risk rating breakdown, risk heat map, top 5 vulnerabilities etc. From laying roadmaps to briefing everything in detail, our templates are perfect for you. You can set the stage with your presentation slides. All you have to do is download these easy to edit and customizable templates. Strategic Risk Management And Mitigation Plan Enterprise Cyber Risk Management Dashboard Diagrams PDF will help you deliver an outstanding performance that everyone would remember and praise you for. Do download this presentation today.

Financial Kpi Dashboard To Evaluate Fundraising Impact Developing Fundraising Techniques Diagrams PDF
This slide showcases dashboard that can help organization to evaluate key changes in financial KPIs post fundraising. Its key components are net profit margin, revenue, gross profit margin, debt to equity and return on equity. From laying roadmaps to briefing everything in detail, our templates are perfect for you. You can set the stage with your presentation slides. All you have to do is download these easy-to-edit and customizable templates. Financial Kpi Dashboard To Evaluate Fundraising Impact Developing Fundraising Techniques Diagrams PDF will help you deliver an outstanding performance that everyone would remember and praise you for. Do download this presentation today.
Process Enhancement Plan To Boost Sales Performance Website Performance Tracking And Monitoring Dashboard Diagrams PDF
The following slide showcases a dashboard to track and measure website performance. It includes key elements such as visits, average session duration, bounce rate, page views, goal conversion, visits by week, traffic sources, top channels by conversions, etc. From laying roadmaps to briefing everything in detail, our templates are perfect for you. You can set the stage with your presentation slides. All you have to do is download these easy to edit and customizable templates. Process Enhancement Plan To Boost Sales Performance Website Performance Tracking And Monitoring Dashboard Diagrams PDF will help you deliver an outstanding performance that everyone would remember and praise you for. Do download this presentation today.
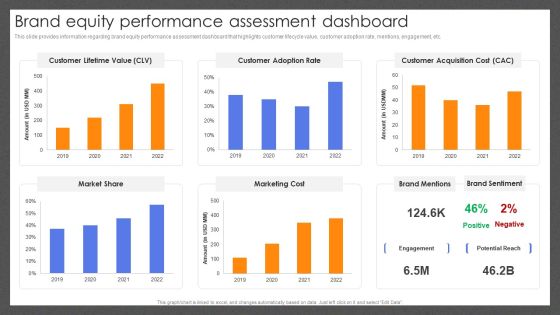
Guide For Effective Brand Brand Equity Performance Assessment Dashboard Diagrams PDF
This slide provides information regarding brand equity performance assessment dashboard that highlights customer lifecycle value, customer adoption rate, mentions, engagement, etc. Present like a pro with Guide For Effective Brand Brand Equity Performance Assessment Dashboard Diagrams PDF Create beautiful presentations together with your team, using our easy-to-use presentation slides. Share your ideas in real-time and make changes on the fly by downloading our templates. So whether youre in the office, on the go, or in a remote location, you can stay in sync with your team and present your ideas with confidence. With Slidegeeks presentation got a whole lot easier. Grab these presentations today.

Personal Branding Plan For Executives Metrics Addressing Social Media Followers Diagrams PDF
This slide illustrates key metrics that can be used by an influencer for addressing their social media followers over different channels such as Facebook, Twitter, Instagram along with their demographics. The Personal Branding Plan For Executives Metrics Addressing Social Media Followers Diagrams PDF is a compilation of the most recent design trends as a series of slides. It is suitable for any subject or industry presentation, containing attractive visuals and photo spots for businesses to clearly express their messages. This template contains a variety of slides for the user to input data, such as structures to contrast two elements, bullet points, and slides for written information. Slidegeeks is prepared to create an impression.

IOS Application Development Revenue Generated Through Developed Apps In 2022 Diagrams PDF
This slide demonstrates the profit generated by our developed apps for the clients in 2021, which is in billion US dollars. Slidegeeks has constructed IOS Application Development Revenue Generated Through Developed Apps In 2022 Diagrams PDF after conducting extensive research and examination. These presentation templates are constantly being generated and modified based on user preferences and critiques from editors. Here, you will find the most attractive templates for a range of purposes while taking into account ratings and remarks from users regarding the content. This is an excellent jumping off point to explore our content and will give new users an insight into our top notch PowerPoint Templates.

You Tube Advertising Influence Survey On Different Age Groups Ppt Diagram Ppt PDF
This slide represents the survey conducted by an organization in order to study the influence or effect which the you tube marketing has on various age groups of the country. Pitch your topic with ease and precision using this You Tube Advertising Influence Survey On Different Age Groups Ppt Diagram Ppt PDF. This layout presents information on Larger Influence, You Tube Marketing, Young Generation. It is also available for immediate download and adjustment. So, changes can be made in the color, design, graphics or any other component to create a unique layout.

Market Demand Equilibrium Gap Of Global Crude Oil Market Diagrams PDF
This slide showcase the effect on demand and supply in retail market.it also explain multiple factor that impacts demand and supply of different products in retail market. It includes consumer income, product price, number of supplier, technology advancement. Pitch your topic with ease and precision using this Market Demand Equilibrium Gap Of Global Crude Oil Market Diagrams PDF. This layout presents information on Demand And Supply, Production Rate, Average. It is also available for immediate download and adjustment. So, changes can be made in the color, design, graphics or any other component to create a unique layout.

Customer Support Center Call Center Action Plan Dashboard Highlighting Agent Diagrams PDF
This slide showcases dashboard for call center action plan which includes total calls, average answer speed, abandon rate, average calls per minute with agent performance and overall customer satisfaction score. Want to ace your presentation in front of a live audience Our Customer Support Center Call Center Action Plan Dashboard Highlighting Agent Diagrams PDF can help you do that by engaging all the users towards you.. Slidegeeks experts have put their efforts and expertise into creating these impeccable powerpoint presentations so that you can communicate your ideas clearly. Moreover, all the templates are customizable, and easy-to-edit and downloadable. Use these for both personal and commercial use.

Comprehensive Market Research Guide Growth Opportunities In Market Research Industry Diagrams PDF
The following slide outlines market size of global market research industry. Information covered in this slide is related to projected revenue from 2022 to 2030 and compound annual growth rate CAGR. Make sure to capture your audiences attention in your business displays with our gratis customizable Comprehensive Market Research Guide Growth Opportunities In Market Research Industry Diagrams PDF. These are great for business strategies, office conferences, capital raising or task suggestions. If you desire to acquire more customers for your tech business and ensure they stay satisfied, create your own sales presentation with these plain slides.

B2B And B2C Startups Marketing Mix Strategies 70 20 10 Rule Social Media Marketing Diagrams PDF
Purpose of the following slide is to display the best practices of utilizing social media marketing. It displays the 70 20 10 rule which defines the type of content to be posted on various social media platforms. Find a pre designed and impeccable B2B And B2C Startups Marketing Mix Strategies 70 20 10 Rule Social Media Marketing Diagrams PDF. The templates can ace your presentation without additional effort. You can download these easy to edit presentation templates to make your presentation stand out from others. So, what are you waiting for Download the template from Slidegeeks today and give a unique touch to your presentation.
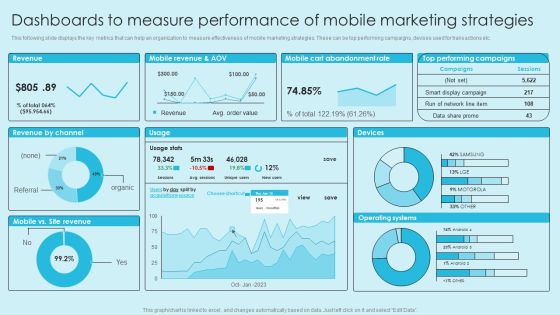
Online Marketing Techniques For Acquiring Clients Dashboards To Measure Performance Of Mobile Marketing Diagrams PDF
This following slide displays the key metrics that can help an organization to measure effectiveness of mobile marketing strategies. These can be top performing campaigns, devises used for transactions etc. Find a pre designed and impeccable Online Marketing Techniques For Acquiring Clients Dashboards To Measure Performance Of Mobile Marketing Diagrams PDF. The templates can ace your presentation without additional effort. You can download these easy to edit presentation templates to make your presentation stand out from others. So, what are you waiting for. Download the template from Slidegeeks today and give a unique touch to your presentation.

Crystal Methods In Agile Framework Impact Of Traditional Model Issues On Business Diagrams PDF
This slide depicts the impacts of the traditional model issues on the business, such as revenue loss and customer loss, by describing the number monthly from January to December. Take your projects to the next level with our ultimate collection of Crystal Methods In Agile Framework Impact Of Traditional Model Issues On Business Diagrams PDF. Slidegeeks has designed a range of layouts that are perfect for representing task or activity duration, keeping track of all your deadlines at a glance. Tailor these designs to your exact needs and give them a truly corporate look with your own brand colors they will make your projects stand out from the rest.
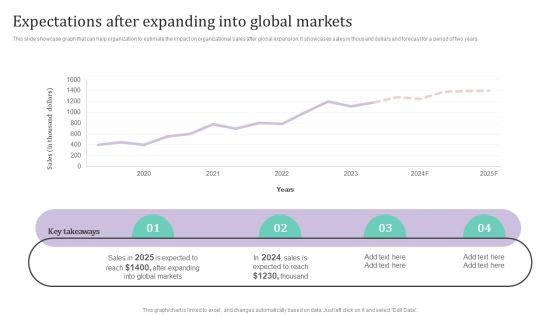
Expectations After Expanding Into Global Markets Ppt PowerPoint Presentation Diagram Lists PDF
This slide showcase graph that can help organization to estimate the impact on organizational sales after global expansion. It showcases sales in thousand dollars and forecast for a period of two years.Want to ace your presentation in front of a live audience Our Expectations After Expanding Into Global Markets Ppt PowerPoint Presentation Diagram Lists PDF can help you do that by engaging all the users towards you.. Slidegeeks experts have put their efforts and expertise into creating these impeccable powerpoint presentations so that you can communicate your ideas clearly. Moreover, all the templates are customizable, and easy-to-edit and downloadable. Use these for both personal and commercial use.

Social Media Influencer Marketing Upcoming Trends Ppt PowerPoint Presentation Diagram Templates PDF
This slide shows the statistical data of the survey conducted for gathering data related to the latest upcoming trends in the field of social media influencer marketing.Showcasing this set of slides titled Social Media Influencer Marketing Upcoming Trends Ppt PowerPoint Presentation Diagram Templates PDF. The topics addressed in these templates are Maintenance Transparency, Better Data Metrics, Integrate Influencers. All the content presented in this PPT design is completely editable. Download it and make adjustments in color, background, font etc. as per your unique business setting.

Successful Corporate Technique Enhancing Firms Performance Corporate Financial Performance Diagrams PDF
This slide provides information regarding dashboard utilized by firm to monitor financial performance. The performance is tracked through revenues generated, vendors associated, profit generated, etc. Find a pre designed and impeccable Successful Corporate Technique Enhancing Firms Performance Corporate Financial Performance Diagrams PDF. The templates can ace your presentation without additional effort. You can download these easy to edit presentation templates to make your presentation stand out from others. So, what are you waiting for Download the template from Slidegeeks today and give a unique touch to your presentation.
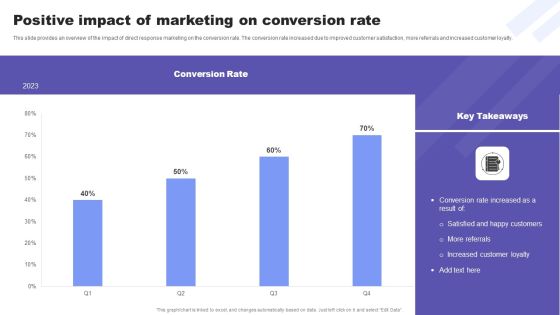
Direct Response Marketing Guide Ultimate Success Positive Impact Of Marketing On Diagrams PDF
This slide provides an overview of the impact of direct response marketing on the conversion rate. The conversion rate increased due to improved customer satisfaction, more referrals and increased customer loyalty. Make sure to capture your audiences attention in your business displays with our gratis customizable Direct Response Marketing Guide Ultimate Success Positive Impact Of Marketing On Diagrams PDF. These are great for business strategies, office conferences, capital raising or task suggestions. If you desire to acquire more customers for your tech business and ensure they stay satisfied, create your own sales presentation with these plain slides.
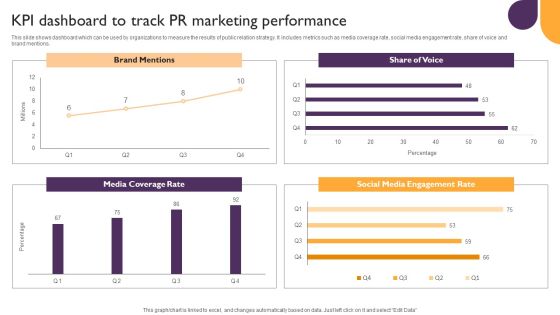
Public Relations Guide To Enhance Brand Credibility KPI Dashboard To Track PR Marketing Performance Diagrams PDF
This slide shows dashboard which can be used by organizations to measure the results of public relation strategy. It includes metrics such as media coverage rate, social media engagement rate, share of voice and brand mentions. Make sure to capture your audiences attention in your business displays with our gratis customizable Public Relations Guide To Enhance Brand Credibility KPI Dashboard To Track PR Marketing Performance Diagrams PDF. These are great for business strategies, office conferences, capital raising or task suggestions. If you desire to acquire more customers for your tech business and ensure they stay satisfied, create your own sales presentation with these plain slides.

Identifying And Increasing Brand Awareness Current Issues Faced By Company Diagrams PDF
This slide covers the current issues faced by company such as rise in bounce rate and low conversion rate due to low-quality content, slow loading time, ad heavy images, lack of sufficient information, poor website performance, etc. Want to ace your presentation in front of a live audience Our Identifying And Increasing Brand Awareness Current Issues Faced By Company Diagrams PDF can help you do that by engaging all the users towards you.. Slidegeeks experts have put their efforts and expertise into creating these impeccable powerpoint presentations so that you can communicate your ideas clearly. Moreover, all the templates are customizable, and easy-to-edit and downloadable. Use these for both personal and commercial use.
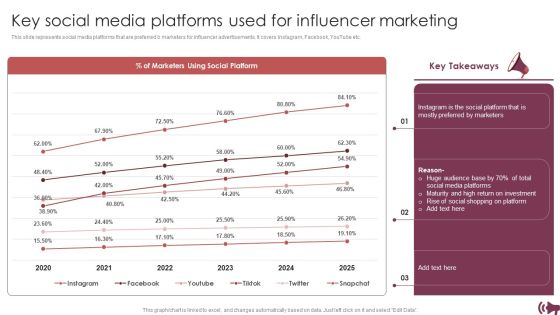
Guide Digital Advertising Optimize Lead Targeting Key Social Media Platforms Used For Influencer Marketing Diagrams PDF
This slide represents social media platforms that are preferred b marketers for influencer advertisements. It covers Instagram, Facebook, YouTube etc. Find a pre designed and impeccable Guide Digital Advertising Optimize Lead Targeting Key Social Media Platforms Used For Influencer Marketing Diagrams PDF. The templates can ace your presentation without additional effort. You can download these easy to edit presentation templates to make your presentation stand out from others. So, what are you waiting for Download the template from Slidegeeks today and give a unique touch to your presentation.

Showcasing The Results Of Resolving Employees Conflict Third Party Training Program Diagrams PDF
The purpose of this slide is to outline results of conflict management training program. The statistics covered in this slide is related to before and after impact of training program on employees performance. From laying roadmaps to briefing everything in detail, our templates are perfect for you. You can set the stage with your presentation slides. All you have to do is download these easy to edit and customizable templates. Showcasing The Results Of Resolving Employees Conflict Third Party Training Program Diagrams PDF will help you deliver an outstanding performance that everyone would remember and praise you for. Do download this presentation today.

Buy Side Merger And Acquisition Advisory Other Sectors Top Clients And Total Revenue Diagrams PDF
The slide identifies a list of companys clients in various other sectors manufacturing, construction, financials services, energy. Mining, automobile etc. along with the total revenue from each sector for the year 2021. Take your projects to the next level with our ultimate collection of Buy Side Merger And Acquisition Advisory Other Sectors Top Clients And Total Revenue Diagrams PDF. Slidegeeks has designed a range of layouts that are perfect for representing task or activity duration, keeping track of all your deadlines at a glance. Tailor these designs to your exact needs and give them a truly corporate look with your own brand colors they will make your projects stand out from the rest.
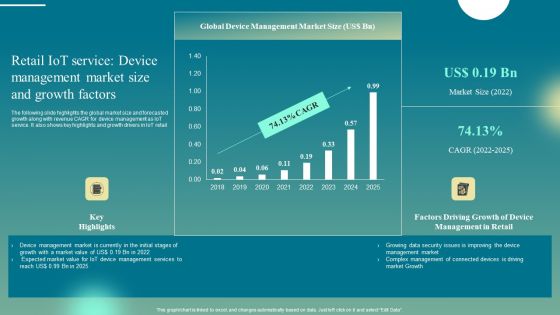
Retail Iot Service Device Management Market Size And Growth Factors Diagrams PDF
The following slide highlights the global market size and forecasted growth along with revenue CAGR for device management as IoT service. It also shows key highlights and growth drivers in IoT retail. If your project calls for a presentation, then Slidegeeks is your go-to partner because we have professionally designed, easy-to-edit templates that are perfect for any presentation. After downloading, you can easily edit Retail Iot Service Device Management Market Size And Growth Factors Diagrams PDF and make the changes accordingly. You can rearrange slides or fill them with different images. Check out all the handy templates
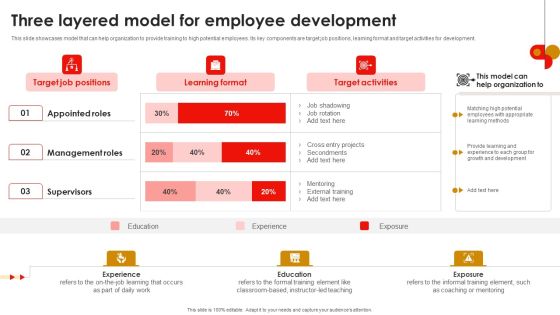
Strategic Talent Development Three Layered Model For Employee Development Diagrams PDF
This slide showcases model that can help organization to provide training to high potential employees. Its key components are target job positions, learning format and target activities for development. From laying roadmaps to briefing everything in detail, our templates are perfect for you. You can set the stage with your presentation slides. All you have to do is download these easy-to-edit and customizable templates. Strategic Talent Development Three Layered Model For Employee Development Diagrams PDF will help you deliver an outstanding performance that everyone would remember and praise you for. Do download this presentation today.
Facebook Advertising Campaign Performance Tracking Report Ppt PowerPoint Presentation Diagram Images PDF
This slide represents the dashboard to track and monitor the performance and effectiveness of Facebook advertising campaign. It includes details related to KPIs such as Facebook Ads amount spent, FB ads websites conversion etc. Make sure to capture your audiences attention in your business displays with our gratis customizable Facebook Advertising Campaign Performance Tracking Report Ppt PowerPoint Presentation Diagram Images PDF. These are great for business strategies, office conferences, capital raising or task suggestions. If you desire to acquire more customers for your tech business and ensure they stay satisfied, create your own sales presentation with these plain slides.

Average Customer Spending In Shopping Malls Ppt PowerPoint Presentation Diagram Images PDF
This slide represents average spending by customers in shopping malls on products and services. It covers information regarding customer buying behavior, sensory emotions, merchandizing offering etc. qIf your project calls for a presentation, then Slidegeeks is your go to partner because we have professionally designed, easy to edit templates that are perfect for any presentation. After downloading, you can easily edit Average Customer Spending In Shopping Malls Ppt PowerPoint Presentation Diagram Images PDF and make the changes accordingly. You can rearrange slides or fill them with different images. Check out all the handy templates

Coffee Cafe Company Profile Business Annual Net Profits And Margin Diagrams PDF
Following slide provides insights into Starbucks business net profits from previous five years. It includes yearly net profit, margin in percentage, and key takeaways. Want to ace your presentation in front of a live audience Our Coffee Cafe Company Profile Business Annual Net Profits And Margin Diagrams PDF can help you do that by engaging all the users towards you. Slidegeeks experts have put their efforts and expertise into creating these impeccable powerpoint presentations so that you can communicate your ideas clearly. Moreover, all the templates are customizable, and easy to edit and downloadable. Use these for both personal and commercial use.

Criteria Checklist To Select Billing Software For Businesses Ppt PowerPoint Presentation Diagram Templates PDF
Following slide shows checklist to select suitable software based on various features. It includes pointers such as data storing, automate multiple payments, data backup, reporting mechanisms etc. Make sure to capture your audiences attention in your business displays with our gratis customizable Criteria Checklist To Select Billing Software For Businesses Ppt PowerPoint Presentation Diagram Templates PDF. These are great for business strategies, office conferences, capital raising or task suggestions. If you desire to acquire more customers for your tech business and ensure they stay satisfied, create your own sales presentation with these plain slides.

Digital Media Streaming Platform Company Profile Disney User Demographics US Diagrams PDF
The following slide highlights the segregation of Disney users based on the individual age and ethnicity for US population. It help streaming platform to develop future strategies based on demographics data analysis Take your projects to the next level with our ultimate collection of Digital Media Streaming Platform Company Profile Disney User Demographics US Diagrams PDF. Slidegeeks has designed a range of layouts that are perfect for representing task or activity duration, keeping track of all your deadlines at a glance. Tailor these designs to your exact needs and give them a truly corporate look with your own brand colors they will make your projects stand out from the rest.
Providing Efficient Client Services Kpi Dashboard For Tracking Customer Retention Diagrams PDF
This slide covers the dashboard for analyzing customer loyalty with metrics such as NPS, loyal customer rate, premium users, CLV, customer churn, revenue churn, net retention, MRR growth, etc. Take your projects to the next level with our ultimate collection of Providing Efficient Client Services Kpi Dashboard For Tracking Customer Retention Diagrams PDF. Slidegeeks has designed a range of layouts that are perfect for representing task or activity duration, keeping track of all your deadlines at a glance. Tailor these designs to your exact needs and give them a truly corporate look with your own brand colors they will make your projects stand out from the rest.

Apparel Ecommerce Business Strategy Ecommerce Apparel Market Insights And Overview Diagrams PDF
This slide provides an overview of ecommerce apparel market. It includes market size value, revenue forecasted, CAGR and expected growth in mens apparel. Want to ace your presentation in front of a live audience Our Apparel Ecommerce Business Strategy Ecommerce Apparel Market Insights And Overview Diagrams PDF can help you do that by engaging all the users towards you. Slidegeeks experts have put their efforts and expertise into creating these impeccable powerpoint presentations so that you can communicate your ideas clearly. Moreover, all the templates are customizable, and easy to edit and downloadable. Use these for both personal and commercial use.

Concerns Regarding Poor Customer Service Ppt PowerPoint Presentation Diagram Images PDF
Are you in need of a template that can accommodate all of your creative concepts This one is crafted professionally and can be altered to fit any style. Use it with Google Slides or PowerPoint. Include striking photographs, symbols, depictions, and other visuals. Fill, move around, or remove text boxes as desired. Test out color palettes and font mixtures. Edit and save your work, or work with colleagues. Download Concerns Regarding Poor Customer Service Ppt PowerPoint Presentation Diagram Images PDF and observe how to make your presentation outstanding. Give an impeccable presentation to your group and make your presentation unforgettable.
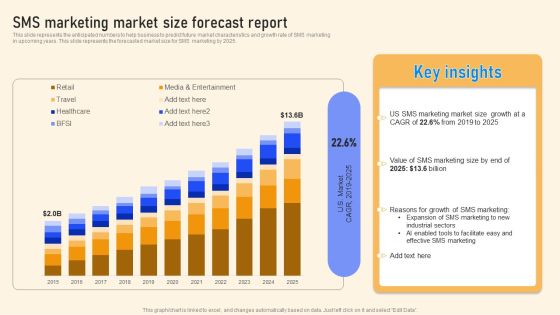
SMS Marketing Market Size Forecast Report Ppt PowerPoint Presentation File Diagrams PDF
This slide represents the anticipated numbers to help business to predict future market characteristics and growth rate of SMS marketing in upcoming years. This slide represents the forecasted market size for SMS marketing by 2025. From laying roadmaps to briefing everything in detail, our templates are perfect for you. You can set the stage with your presentation slides. All you have to do is download these easy to edit and customizable templates. SMS Marketing Market Size Forecast Report Ppt PowerPoint Presentation File Diagrams PDF will help you deliver an outstanding performance that everyone would remember and praise you for. Do download this presentation today.

Corporate Financial KPI Dashboard To Statement Cash Flow Of Company Diagrams PDF
This slide presents a financial dashboard of an enterprise which is being used to report the total spending power of a company. Key performing indicators include cash burn rate, monthly expenses, solvency etc. Showcasing this set of slides titled Corporate Financial KPI Dashboard To Statement Cash Flow Of Company Diagrams PDF. The topics addressed in these templates are Solvency, Debtors, Monthly Expenses. All the content presented in this PPT design is completely editable. Download it and make adjustments in color, background, font etc. as per your unique business setting.

Customer Buying Journey Phases With Touchpoints Sample PDF
This slide contains the information related to the customer journey starting form research of the product till the post purchase. It also includes emotions, goods, questions and touchpoints for the same. Pitch your topic with ease and precision using this Customer Buying Journey Phases With Touchpoints Sample PDF. This layout presents information on Product Cost, Business Capabilities, Social Media. It is also available for immediate download and adjustment. So, changes can be made in the color, design, graphics or any other component to create a unique layout.
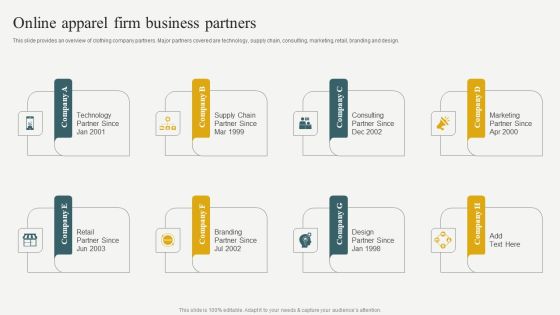
Evaluating Financial Position Of E Commerce Company Online Apparel Firm Business Partners Diagrams PDF
This slide provides an overview of clothing company partners. Major partners covered are technology, supply chain, consulting, marketing, retail, branding and design. Formulating a presentation can take up a lot of effort and time, so the content and message should always be the primary focus. The visuals of the PowerPoint can enhance the presenters message, so our Evaluating Financial Position Of E Commerce Company Online Apparel Firm Business Partners Diagrams PDF was created to help save time. Instead of worrying about the design, the presenter can concentrate on the message while our designers work on creating the ideal templates for whatever situation is needed. Slidegeeks has experts for everything from amazing designs to valuable content, we have put everything into Evaluating Financial Position Of E Commerce Company Online Apparel Firm Business Partners Diagrams PDF

Combo Chart Template 1 Ppt PowerPoint Presentation Inspiration
This is a combo chart template 1 ppt powerpoint presentation inspiration. This is a four stage process. The stages in this process are business, marketing, growth, product, finance.

Column Chart Ppt PowerPoint Presentation Ideas Visual Aids
This is a column chart ppt powerpoint presentation ideas visual aids. This is a two stage process. The stages in this process are growth, business, finance, marketing, analysis.

Combo Chart Ppt PowerPoint Presentation Styles Example File
This is a combo chart ppt powerpoint presentation styles example file. This is a three stage process. The stages in this process are finance, growth, business, analysis, marketing.
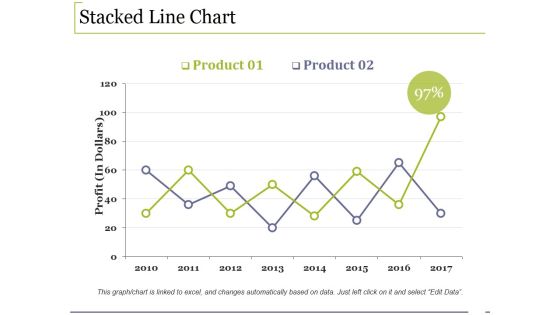
Stacked Line Chart Ppt PowerPoint Presentation Ideas Styles
This is a stacked line chart ppt powerpoint presentation ideas styles. This is a two stage process. The stages in this process are growth, finance, analysis, management, business.

Quarterly Revenue Analysis Generated By Various E Commerce Products Diagrams PDF
This slide shows comparison which can be used to present quarterly comparison between revenue of various products. It covers information about total annual and quarterly sales. Showcasing this set of slides titled Quarterly Revenue Analysis Generated By Various E Commerce Products Diagrams PDF. The topics addressed in these templates are Products Increased, Email Marketing. All the content presented in this PPT design is completely editable. Download it and make adjustments in color, background, font etc. as per your unique business setting.

Business Performance Dashboard Supplier Relationship Management Ideas PDF
This slide covers business and supplier relationship performance management dashboard including metrics such as cist reduction, procurement ROI, cost savings and cost avoidance etc. Deliver an awe inspiring pitch with this creative business performance dashboard supplier relationship management ideas pdf bundle. Topics like cost reduction, cost savings, cost avoidance, purchase order can be discussed with this completely editable template. It is available for immediate download depending on the needs and requirements of the user.
Online Ad Campaign Performance Tracking Dashboard Formats PDF
This slide covers the KPI dashboard for measuring digital campaign results. It includes metrics such as Ad cost, clicks, impressions, CTR, cost per click, conversions, conversion rate, cost per click, cost per thousand impressions, etc. Deliver an awe inspiring pitch with this creative Online Ad Campaign Performance Tracking Dashboard Formats PDF bundle. Topics like Conversation Rate, Cost Per Conversion can be discussed with this completely editable template. It is available for immediate download depending on the needs and requirements of the user.
Developing Significant Business Staff Training Effectiveness Tracking Dashboard Elements PDF
This slide provides information regarding workforce training effectiveness monitoring dashboard. The dashboard includes details such as training cost, cost per participant, number of participants, hours of training, etc. Deliver an awe inspiring pitch with this creative Developing Significant Business Staff Training Effectiveness Tracking Dashboard Elements PDF bundle. Topics like Training Cost, Cost Per Participant, Cost Per Hour can be discussed with this completely editable template. It is available for immediate download depending on the needs and requirements of the user.

How We Are Different Series A Capital Funding Elevator Pitch Deck For Real Estate Formats PDF
Retrieve professionally designed How We Are Different Series A Capital Funding Elevator Pitch Deck For Real Estate Formats PDF to effectively convey your message and captivate your listeners. Save time by selecting pre-made slideshows that are appropriate for various topics, from business to educational purposes. These themes come in many different styles, from creative to corporate, and all of them are easily adjustable and can be edited quickly. Access them as PowerPoint templates or as Google Slides themes. You dont have to go on a hunt for the perfect presentation because Slidegeeks got you covered from everywhere.

Rapping Platform Investor Funding Elevator Pitch Deck Revenue Streams Portrait PDF
This slide provides glimpse about revenue streams of the company including premium beats, and sponsored content. Retrieve professionally designed Rapping Platform Investor Funding Elevator Pitch Deck Revenue Streams Portrait PDF to effectively convey your message and captivate your listeners. Save time by selecting pre made slideshows that are appropriate for various topics, from business to educational purposes. These themes come in many different styles, from creative to corporate, and all of them are easily adjustable and can be edited quickly. Access them as PowerPoint templates or as Google Slides themes. You do not have to go on a hunt for the perfect presentation because Slidegeeks got you covered from everywhere.

PowerPoint Themes Education Chains Ppt Themes
PowerPoint Themes Education Chains PPT Themes-Most events and in every aspect of life are invariably interlinked. Use this chains graphic to outline your thoughts and their inherent interdependance to acheive the final outcome. Highlight the strength and durability of your thoughts, ideas and products.-These amazing PowerPoint pre-designed slides and PowerPoint templates have been carefully created by our team of experts to help you impress your audience. Our stunning collection of Powerpoint slides are 100% editable and can easily fit in any PowerPoint presentations. By using these animations and graphics in PowerPoint and you can easily make professional presentations. Any text can be entered at any point in the PowerPoint template or slide. Just DOWNLOAD our awesome PowerPoint templates and you are ready to go.

PowerPoint Theme Company Chains Ppt Theme
PowerPoint Theme Company Chains PPT Theme-Most events and in every aspect of life are invariably interlinked. Use this chains graphic to outline your thoughts and their inherent interdependance to acheive the final outcome. Highlight the strength and durability of your thoughts, ideas and products.-These amazing PowerPoint pre-designed slides and PowerPoint templates have been carefully created by our team of experts to help you impress your audience. Our stunning collection of Powerpoint slides are 100% editable and can easily fit in any PowerPoint presentations. By using these animations and graphics in PowerPoint and you can easily make professional presentations. Any text can be entered at any point in the PowerPoint template or slide. Just DOWNLOAD our awesome PowerPoint templates and you are ready to go.
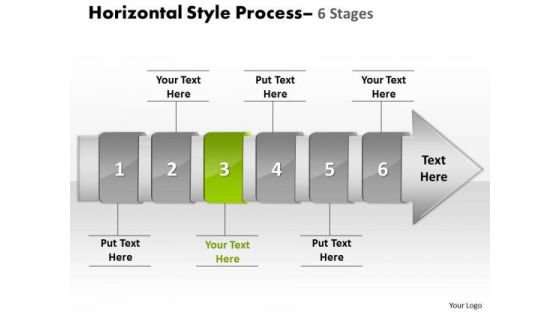
Ppt Theme Horizontal Flow Of 6 Stage Spider Diagram PowerPoint Template 4 Design
We present our PPT Theme horizontal flow of 6 stage spider diagram power point template 4 designs. Use our Arrows PowerPoint Templates because, our ready backdrops leave a lasting impression. Use our Shapes PowerPoint Templates because, it is in your DNA to analyses possible causes to the minutest detail. Use our Finance PowerPoint Templates because, Leadership Template: - Show them the way, be Captain of the ship and lead them to new shores. Use our Business PowerPoint Templates because, Marketing Strategy Business Template:- Maximizing sales of your product is the intended destination. Use our Process and Flows PowerPoint Templates because, Now use this slide to bullet point your views. Use these PowerPoint slides for presentations relating to accent, advertisement, arrow, badge, banner, business, button, collection, color, decoration, design, direction, element, financial, flow, graph, horizontal, instruction, isolated, label, manual, message, process, sale, set, shape, steps, symbol, template. The prominent colors used in the PowerPoint template are Green, Gray, and Black

Arrow Bar Graph Business PowerPoint Templates And PowerPoint Themes 0612
Arrow Bar Graph Business PowerPoint Templates And PowerPoint Themes Business PPT Templates-Business success, finance, sales, success, business, arrows

Success Graph Business PowerPoint Templates And PowerPoint Themes 0612
Success Graph Business PowerPoint Templates And PowerPoint Themes Business PPT Templates-Business graph with arrow, finance, background, arrows, success, business

COVID 19 Risk Analysis Mitigation Policies Ocean Liner Sector Covid19 Impact On Marine Trade And Patterns Background PDF
This slide provides information regarding the impact of coronavirus on marine trade and patterns. It also show the short term and long term implications for marine trade. Deliver an awe inspiring pitch with this creative covid 19 risk analysis mitigation policies ocean liner sector covid19 impact on marine trade and patterns background pdf bundle. Topics like economic, supply, financial, market can be discussed with this completely editable template. It is available for immediate download depending on the needs and requirements of the user.

Addressing Recessional Crisis On ICT Sector Due To COVID 19 Pandemic Ppt Gallery Vector PDF
This slide covers information regarding the recessional crisis on ICT sector and how the sector has affected due to recent COVID 19 pandemic outbreak. Deliver an awe inspiring pitch with this creative addressing recessional crisis on ict sector due to covid 19 pandemic ppt gallery vector pdf bundle. Topics like segment, maintaining, technologies, economic, telecommunication can be discussed with this completely editable template. It is available for immediate download depending on the needs and requirements of the user.

Addressing Unemployment Risk In ICT Sector Ppt Model Visuals PDF
This slide covers information regarding the rise in unemployment in ICT sector due to recent COVID 19 pandemic outbreak. Deliver and pitch your topic in the best possible manner with this addressing unemployment risk in ict sector ppt model visuals pdf. Use them to share invaluable insights on global unemployment, services, economic and impress your audience. This template can be altered and modified as per your expectations. So, grab it now.

Post COVID Recovery Strategy For Retail Industry Addressing Consumer Spending During Pandemic Portrait PDF
This slide provides information regarding consumer spending during pandemic and how consumer spending has been reduced in various sectors due to social isolation, restrictions and lower consumer confidence. Deliver an awe inspiring pitch with this creative post covid recovery strategy for retail industry addressing consumer spending during pandemic portrait pdf bundle. Topics like segment, economic, social isolation can be discussed with this completely editable template. It is available for immediate download depending on the needs and requirements of the user.

Reverse Logistic In Supply Chain Strategy Waste Generation By Various Activities Professional PDF
The purpose of this slide is to provide information regarding the different activities that generate major chunk of waste like manufacturing.Deliver and pitch your topic in the best possible manner with this reverse logistic in supply chain strategy waste generation by various activities professional pdf. Use them to share invaluable insights on manufacturing, other economic activities, agriculture, forestry and fishing, construction and impress your audience. This template can be altered and modified as per your expectations. So, grab it now.

Reverse Logistics Management Waste Generation By Various Activities Ppt Portfolio Shapes PDF
The purpose of this slide is to provide information regarding the different activities that generate major chunk of waste like manufacturing. Deliver an awe inspiring pitch with this creative reverse logistics management waste generation by various activities ppt portfolio shapes pdf bundle. Topics like manufacturing, economic, waste generation, services can be discussed with this completely editable template. It is available for immediate download depending on the needs and requirements of the user.

Feasibility Analysis Template Different Projects Hospital Project Risk Analysis Graphics PDF
This slide provides the glimpse about the hospital project risk analysis along with different categories such as design, external, environmental, project management, occupancy, economical, etc. and mitigations. Deliver and pitch your topic in the best possible manner with this feasibility analysis template different projects hospital project risk analysis graphics pdf . Use them to share invaluable insights on hospital project risk analysis and impress your audience. This template can be altered and modified as per your expectations. So, grab it now.
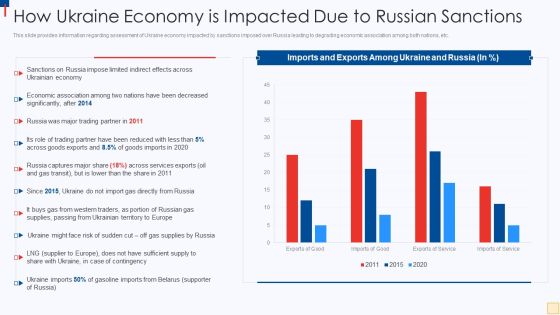
Ukraine Vs Russia Examining How Ukraine Economy Is Impacted Due To Russian Sanctions Pictures PDF
This slide provides information regarding assessment of Ukraine economy impacted by sanctions imposed over Russia leading to degrading economic association among both nations, etc. Deliver an awe inspiring pitch with this creative Ukraine Vs Russia Examining How Ukraine Economy Is Impacted Due To Russian Sanctions Pictures PDF bundle. Topics like Imports And Exports, Among Ukraine And Russia, 2011 To 2020 can be discussed with this completely editable template. It is available for immediate download depending on the needs and requirements of the user.

5G Evolution Architectural Technology Addressing 5G Spectrum Network Coverage Introduction PDF
This slide provides details regarding 5G spectrum network coverage including hotspots, urban coverage and rural coverage.Deliver an awe inspiring pitch with this creative 5G Evolution Architectural Technology Addressing 5G Spectrum Network Coverage Introduction PDF bundle. Topics like Economic Challenge, Broadband Infrastructure, Availability Of Technology can be discussed with this completely editable template. It is available for immediate download depending on the needs and requirements of the user.

Communication Barriers Manager Dashboard For Analyzing Ppt PowerPoint Presentation Inspiration Grid PDF
This slide represents the dashboard of communication manager. It includes KPIs such as current conversation, performance, customers and opportunities.Pitch your topic with ease and precision using this Communication Barriers Manager Dashboard For Analyzing Ppt PowerPoint Presentation Inspiration Grid PDF. This layout presents information on Current Conversation, Economic Indicator, Conversation Calls. It is also available for immediate download and adjustment. So, changes can be made in the color, design, graphics or any other component to create a unique layout.

Addressing 5G Spectrum Network Coverage Hotspots Urban Rural Brochure PDF
This slide provides details regarding 5G spectrum network coverage including hotspots, urban coverage and rural coverage. Deliver an awe inspiring pitch with this creative Addressing 5G Spectrum Network Coverage Hotspots Urban Rural Brochure PDF bundle. Topics like Broadband Gap, Economic Challenge, Resilient Broadband can be discussed with this completely editable template. It is available for immediate download depending on the needs and requirements of the user.
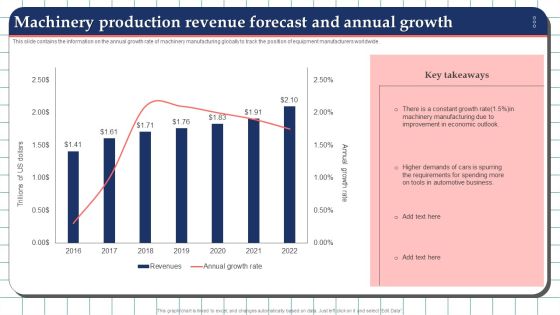
Machinery Production Revenue Forecast And Annual Growth Template PDF
This slide contains the information on the annual growth rate of machinery manufacturing globally to track the position of equipment manufacturers worldwide. Showcasing this set of slides titled Machinery Production Revenue Forecast And Annual Growth Template PDF. The topics addressed in these templates are Manufacturing, Economic, Growth Rate. All the content presented in this PPT design is completely editable. Download it and make adjustments in color, background, font etc. as per your unique business setting.

Financial Feasibility Analysis Dashboard Depicting Income And Unemployment Analysis Download PDF
This slide illustrates economic feasibility dashboard depicting income and unemployment analysis. It contains information about household income, unemployment rate, poverty, status, etc. Pitch your topic with ease and precision using this Financial Feasibility Analysis Dashboard Depicting Income And Unemployment Analysis Download PDF. This layout presents information on Median Household Income, Unemployment Rate, Percent Living Poverty. It is also available for immediate download and adjustment. So, changes can be made in the color, design, graphics or any other component to create a unique layout.

After Marketing Strategy Of Automobile Commercial Vehicle Sales Trend Designs PDF
Following slide depicts the sales trends of automobile industry for commercial vehicle for analyzing the challenges faced during the years. Showcasing this set of slides titled After Marketing Strategy Of Automobile Commercial Vehicle Sales Trend Designs PDF. The topics addressed in these templates are Global Meltdown, Economic Recovery, Replacement Demand. All the content presented in this PPT design is completely editable. Download it and make adjustments in color, background, font etc. as per your unique business setting.

Positive Impact Of Effective Cost Of Services Provided To Smart Phone Company Themes PDF
This slide provides an overview of fee charged by event planning company. The services provided are developing budget, venue selection, creating launch poster, third party vendor booking, live polling, social wall setup, thank you emails, etc. If you are looking for a format to display your unique thoughts, then the professionally designed Positive Impact Of Effective Cost Of Services Provided To Smart Phone Company Themes PDF is the one for you. You can use it as a Google Slides template or a PowerPoint template. Incorporate impressive visuals, symbols, images, and other charts. Modify or reorganize the text boxes as you desire. Experiment with shade schemes and font pairings. Alter, share or cooperate with other people on your work. Download Positive Impact Of Effective Cost Of Services Provided To Smart Phone Company Themes PDF and find out how to give a successful presentation. Present a perfect display to your team and make your presentation unforgettable.

Strategic Sourcing And Supplier Quality Performance Analysis Of Business Suppliers Diagrams PDF
The slide represents the dashboard to illustrates the existing performance of business suppliers. It includes information regarding the suppliers availability, defect rate, compliance rate, sourcing time along with the efficiency details.Welcome to our selection of the Strategic Sourcing And Supplier Quality Performance Analysis Of Business Suppliers Diagrams PDF. These are designed to help you showcase your creativity and bring your sphere to life. Planning and Innovation are essential for any business that is just starting out. This collection contains the designs that you need for your everyday presentations. All of our PowerPoints are 100precent editable, so you can customize them to suit your needs. This multi-purpose template can be used in various situations. Grab these presentation templates today.
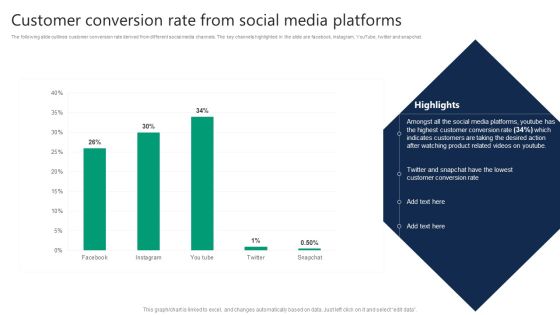
Formulating Video Marketing Strategies To Enhance Sales Customer Conversion Rate From Social Media Platforms Diagrams PDF
The following slide outlines customer conversion rate derived from different social media channels. The key channels highlighted in the slide are facebook, instagram, YouTube, twitter and snapchat. Are you in need of a template that can accommodate all of your creative concepts This one is crafted professionally and can be altered to fit any style. Use it with Google Slides or PowerPoint. Include striking photographs, symbols, depictions, and other visuals. Fill, move around, or remove text boxes as desired. Test out color palettes and font mixtures. Edit and save your work, or work with colleagues. Download Formulating Video Marketing Strategies To Enhance Sales Customer Conversion Rate From Social Media Platforms Diagrams PDF and observe how to make your presentation outstanding. Give an impeccable presentation to your group and make your presentation unforgettable.

Manufacturing Process Automation For Enhancing Productivity Supply Chain And Logistics RPA Management Dashboard Diagrams PDF
This slide illustrates supply chain and logistics robotic process automation RPA management dashboard. It provides information about active bots, bot hours, carton pickup, pickup productivity, etc. Present like a pro with Manufacturing Process Automation For Enhancing Productivity Supply Chain And Logistics RPA Management Dashboard Diagrams PDF Create beautiful presentations together with your team, using our easy to use presentation slides. Share your ideas in real time and make changes on the fly by downloading our templates. So whether you are in the office, on the go, or in a remote location, you can stay in sync with your team and present your ideas with confidence. With Slidegeeks presentation got a whole lot easier. Grab these presentations today.

Nielsen Business Profile Revenue And Operating Income Ppt PowerPoint Presentation Diagram PDF
This slide highlights the Nielsen company revenue and operating income for the last 3 years. It includes the data in million of US dollars with a key takeaways section. This Nielsen Business Profile Revenue And Operating Income Ppt PowerPoint Presentation Diagram PDF from Slidegeeks makes it easy to present information on your topic with precision. It provides customization options, so you can make changes to the colors, design, graphics, or any other component to create a unique layout. It is also available for immediate download, so you can begin using it right away. Slidegeeks has done good research to ensure that you have everything you need to make your presentation stand out. Make a name out there for a brilliant performance.
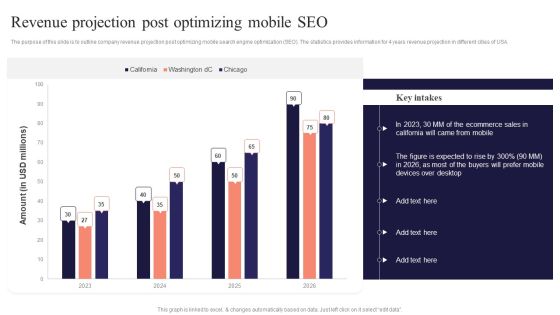
Revenue Projection Post Optimizing Mobile SEO Performing Mobile SEO Audit To Analyze Web Traffic Diagrams PDF
The purpose of this slide is to outline company revenue projection post optimizing mobile search engine optimization SEO. The statistics provides information for 4 years revenue projection in different cities of USA.Welcome to our selection of the Revenue Projection Post Optimizing Mobile SEO Performing Mobile SEO Audit To Analyze Web Traffic Diagrams PDF. These are designed to help you showcase your creativity and bring your sphere to life. Planning and Innovation are essential for any business that is just starting out. This collection contains the designs that you need for your everyday presentations. All of our PowerPoints are 100 precent editable, so you can customize them to suit your needs. This multi-purpose template can be used in various situations. Grab these presentation templates today.

New Product Launch Event Management Activities Event Planning Industry And Market Overview Diagrams PDF
This slide provides an overview of event planning industry. It includes facts and figures, industry market by type and region.Are you in need of a template that can accommodate all of your creative concepts This one is crafted professionally and can be altered to fit any style. Use it with Google Slides or PowerPoint. Include striking photographs, symbols, depictions, and other visuals. Fill, move around, or remove text boxes as desired. Test out color palettes and font mixtures. Edit and save your work, or work with colleagues. Download New Product Launch Event Management Activities Event Planning Industry And Market Overview Diagrams PDF and observe how to make your presentation outstanding. Give an impeccable presentation to your group and make your presentation unforgettable.
IT Business Alignment Framework Dashboard For Tracking Business And IT Alignment Diagrams PDF
This slide depicts the dashboard for business and IT alignment by covering details of total sales, customer support service, percentage of business operations aligned IT, usage of communication channels, and top performer associates.This IT Business Alignment Framework Dashboard For Tracking Business And IT Alignment Diagrams PDF from Slidegeeks makes it easy to present information on your topic with precision. It provides customization options, so you can make changes to the colors, design, graphics, or any other component to create a unique layout. It is also available for immediate download, so you can begin using it right away. Slidegeeks has done good research to ensure that you have everything you need to make your presentation stand out. Make a name out there for a brilliant performance.

Dashboard For Tracking Customer Service Team Performance Consumer Contact Point Guide Diagrams PDF
This slide covers the KPI dashboard for analyzing the performance of client support department. It includes metrics such as first call resolution, unresolved calls, average response rate, the best day to call, average time to solve issues, etc. The Dashboard For Tracking Customer Service Team Performance Consumer Contact Point Guide Diagrams PDF is a compilation of the most recent design trends as a series of slides. It is suitable for any subject or industry presentation, containing attractive visuals and photo spots for businesses to clearly express their messages. This template contains a variety of slides for the user to input data, such as structures to contrast two elements, bullet points, and slides for written information. Slidegeeks is prepared to create an impression.

Social Networks Marketing To Improve Enterprise Audience Insights For Developing Diagrams PDF
This slide shows the report showing details related to insights of target audience of the enterprise. It includes details related to age, gender split, location spread , page views, fans and reach etc. Slidegeeks is here to make your presentations a breeze with Social Networks Marketing To Improve Enterprise Audience Insights For Developing Diagrams PDF With our easy-to-use and customizable templates, you can focus on delivering your ideas rather than worrying about formatting. With a variety of designs to choose from, youre sure to find one that suits your needs. And with animations and unique photos, illustrations, and fonts, you can make your presentation pop. So whether youre giving a sales pitch or presenting to the board, make sure to check out Slidegeeks first.

Prevention Of Information Determining The Actors Behind Most Significant Cyber Attack Diagrams PDF
The purpose of this slide is to outline different actors who are involved in the most critical cyber attack. Online criminals, foreign governments, hackers and malicious insiders are some of the key players who are responsible for cyber attack. Present like a pro with Prevention Of Information Determining The Actors Behind Most Significant Cyber Attack Diagrams PDF Create beautiful presentations together with your team, using our easy-to-use presentation slides. Share your ideas in real-time and make changes on the fly by downloading our templates. So whether youre in the office, on the go, or in a remote location, you can stay in sync with your team and present your ideas with confidence. With Slidegeeks presentation got a whole lot easier. Grab these presentations today.

Cloud Computing Scalability Impact On The Organization After Removing Multi Cloud Diagrams PDF
This slide covers the impact on organization such as consistent policy and control, simplified management, enhance visibility, improved reliability and increased security after implementing multi cloud management strategies. Are you in need of a template that can accommodate all of your creative concepts This one is crafted professionally and can be altered to fit any style. Use it with Google Slides or PowerPoint. Include striking photographs, symbols, depictions, and other visuals. Fill, move around, or remove text boxes as desired. Test out color palettes and font mixtures. Edit and save your work, or work with colleagues. Download Cloud Computing Scalability Impact On The Organization After Removing Multi Cloud Diagrams PDF and observe how to make your presentation outstanding. Give an impeccable presentation to your group and make your presentation unforgettable.
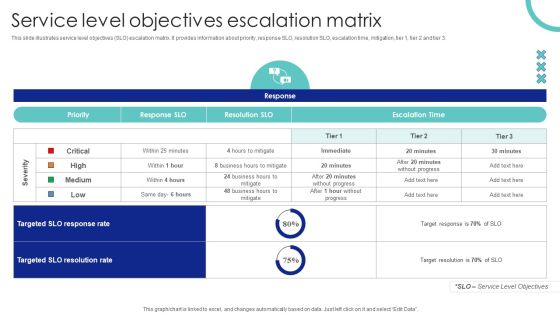
Service Level Objectives Escalation Matrix Ppt PowerPoint Presentation File Diagrams PDF
This slide illustrates service level objectives SLO escalation matrix. It provides information about priority, response SLO, resolution SLO, escalation time, mitigation, tier 1, tier 2 and tier 3. Slidegeeks is here to make your presentations a breeze with Service Level Objectives Escalation Matrix Ppt PowerPoint Presentation File Diagrams PDF With our easy to use and customizable templates, you can focus on delivering your ideas rather than worrying about formatting. With a variety of designs to choose from, you are sure to find one that suits your needs. And with animations and unique photos, illustrations, and fonts, you can make your presentation pop. So whether you are giving a sales pitch or presenting to the board, make sure to check out Slidegeeks first.

Maintenance Administration Dashboard To Monitor Production Plant Shift Efficiency Diagrams PDF
This slide represents the dashboard to monitor production plant efficiency for the multiple shifts. The multiple KPIs covered in dashboard are availability, performance of manufacturing plant machines. It also provides information regarding the total downtime along with good parts yield. Want to ace your presentation in front of a live audience Our Maintenance Administration Dashboard To Monitor Production Plant Shift Efficiency Diagrams PDF can help you do that by engaging all the users towards you. Slidegeeks experts have put their efforts and expertise into creating these impeccable powerpoint presentations so that you can communicate your ideas clearly. Moreover, all the templates are customizable, and easy-to-edit and downloadable. Use these for both personal and commercial use.
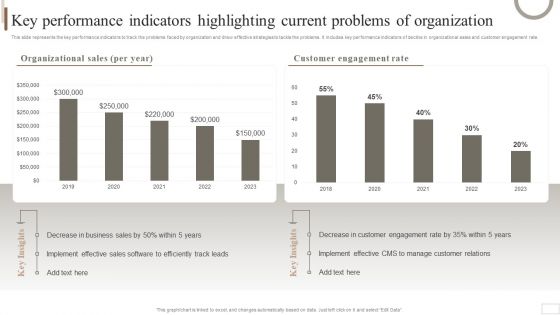
Strategic Plan For Enterprise Key Performance Indicators Highlighting Current Problems Diagrams PDF
This slide represents the key performance indicators to track the problems faced by organization and draw effective strategies to tackle the problems. It includes key performance indicators of decline in organizational sales and customer engagement rate. Coming up with a presentation necessitates that the majority of the effort goes into the content and the message you intend to convey. The visuals of a PowerPoint presentation can only be effective if it supplements and supports the story that is being told. Keeping this in mind our experts created Strategic Plan For Enterprise Key Performance Indicators Highlighting Current Problems Diagrams PDF to reduce the time that goes into designing the presentation. This way, you can concentrate on the message while our designers take care of providing you with the right template for the situation.

Role Of IT In Business Communication Live Chat Support For Better Customer Experience Diagrams PDF
This slide talks about live chat support for a better customer experience. It includes the reasons for employing the live chat feature on the website and statistics gathered from the customer survey conducted by the company. This modern and well-arranged Role Of IT In Business Communication Live Chat Support For Better Customer Experience Diagrams PDF provides lots of creative possibilities. It is very simple to customize and edit with the Powerpoint Software. Just drag and drop your pictures into the shapes. All facets of this template can be edited with Powerpoint, no extra software is necessary. Add your own material, put your images in the places assigned for them, adjust the colors, and then you can show your slides to the world, with an animated slide included.

Strategic Guide To Perform Marketing Marketing Campaign Performance Management Dashboard Diagrams PDF
This slide presents a dashboard ti track and measure performance of marketing campaign for effective decision making. It provides information about bounce rate, new users, users, average session duration, page performance, page path, average time on page, goal conversion rate and goal completions. Slidegeeks is here to make your presentations a breeze with Strategic Guide To Perform Marketing Marketing Campaign Performance Management Dashboard Diagrams PDF With our easy to use and customizable templates, you can focus on delivering your ideas rather than worrying about formatting. With a variety of designs to choose from, youre sure to find one that suits your needs. And with animations and unique photos, illustrations, and fonts, you can make your presentation pop. So whether youre giving a sales pitch or presenting to the board, make sure to check out Slidegeeks first.
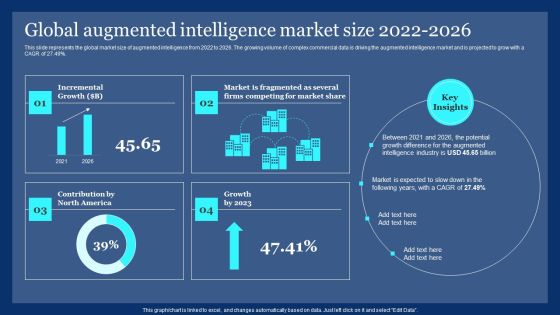
Global Augmented Intelligence Market Size 2022 2026 Ppt PowerPoint Presentation Diagram PDF
This slide represents the global market size of augmented intelligence from 2022 to 2026. The growing volume of complex commercial data is driving the augmented intelligence market and is projected to grow with a CAGR of 27.49 percent. This Global Augmented Intelligence Market Size 2022 2026 Ppt PowerPoint Presentation Diagram PDF from Slidegeeks makes it easy to present information on your topic with precision. It provides customization options, so you can make changes to the colors, design, graphics, or any other component to create a unique layout. It is also available for immediate download, so you can begin using it right away. Slidegeeks has done good research to ensure that you have everything you need to make your presentation stand out. Make a name out there for a brilliant performance.
Industrial Robots System Industrial Robots System Performance Tracking Dashboard Diagrams PDF
This slide shows the dashboard to keep a regular track of the performance of industrial robots. the purpose of this slide is to provide a graphical representation of robots performance to enhance the accuracy and effectiveness of these machines. This modern and well-arranged Industrial Robots System Industrial Robots System Performance Tracking Dashboard Diagrams PDF provides lots of creative possibilities. It is very simple to customize and edit with the Powerpoint Software. Just drag and drop your pictures into the shapes. All facets of this template can be edited with Powerpoint, no extra software is necessary. Add your own material, put your images in the places assigned for them, adjust the colors, and then you can show your slides to the world, with an animated slide included.
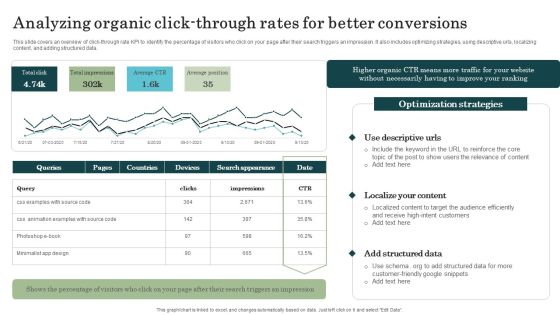
Marketing Success Metrics Analyzing Organic Click Through Rates For Better Diagrams PDF
This slide covers an overview of click-through rate KPI to identify the percentage of visitors who click on your page after their search triggers an impression. It also includes optimizing strategies, using descriptive urls, localizing content, and adding structured data. Welcome to our selection of the Marketing Success Metrics Analyzing Organic Click Through Rates For Better Diagrams PDF. These are designed to help you showcase your creativity and bring your sphere to life. Planning and Innovation are essential for any business that is just starting out. This collection contains the designs that you need for your everyday presentations. All of our PowerPoints are 100 percent editable, so you can customize them to suit your needs. This multi-purpose template can be used in various situations. Grab these presentation templates today.
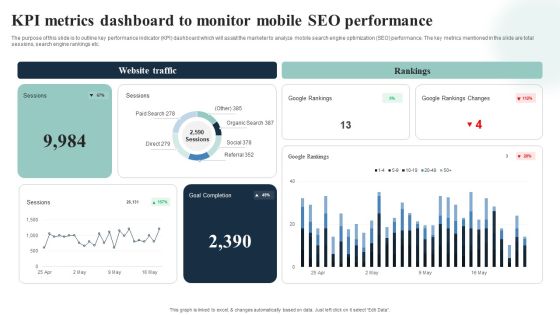
Introduction To Mobile SEM KPI Metrics Dashboard To Monitor Mobile SEO Performance Diagrams PDF
The purpose of this slide is to outline key performance indicator KPI dashboard which will assist the marketer to analyze mobile search engine optimization SEO performance. The key metrics mentioned in the slide are total sessions, search engine rankings etc. Take your projects to the next level with our ultimate collection of Introduction To Mobile SEM KPI Metrics Dashboard To Monitor Mobile SEO Performance Diagrams PDF. Slidegeeks has designed a range of layouts that are perfect for representing task or activity duration, keeping track of all your deadlines at a glance. Tailor these designs to your exact needs and give them a truly corporate look with your own brand colors they will make your projects stand out from the rest.
Metrics For Tracking Effectiveness Of Safety Measures In The Organization Ppt PowerPoint Presentation File Diagrams PDF
The following slide showcases five safety metrics to monitor the effectiveness of current safety measures. Key KPIs inluded here are reported incidents, accident free days, cases of near misses, audit acore, BBS score etc. Want to ace your presentation in front of a live audience Our Metrics For Tracking Effectiveness Of Safety Measures In The Organization Ppt PowerPoint Presentation File Diagrams PDF can help you do that by engaging all the users towards you. Slidegeeks experts have put their efforts and expertise into creating these impeccable powerpoint presentations so that you can communicate your ideas clearly. Moreover, all the templates are customizable, and easy to edit and downloadable. Use these for both personal and commercial use.

Brand Development Techniques To Increase Revenues Dashboard Depicting Website Data Diagrams PDF
This slide shows the dashboard that depicts website data insights which covers channels such as display, social and email with total sessions, pages, average session duration, bounce rate, goal completion. Are you in need of a template that can accommodate all of your creative concepts This one is crafted professionally and can be altered to fit any style. Use it with Google Slides or PowerPoint. Include striking photographs, symbols, depictions, and other visuals. Fill, move around, or remove text boxes as desired. Test out color palettes and font mixtures. Edit and save your work, or work with colleagues. Download Brand Development Techniques To Increase Revenues Dashboard Depicting Website Data Diagrams PDF and observe how to make your presentation outstanding. Give an impeccable presentation to your group and make your presentation unforgettable.

Dashboard To Manage Marketing Campaigns Of Multiple Brands Ppt PowerPoint Presentation Diagram PDF
This slide showcases dashboard that can help organization to manage the marketing campaigns in multi brand strategy. Its key elements are lead breakdown, total leads, key conversion metrics etc. Coming up with a presentation necessitates that the majority of the effort goes into the content and the message you intend to convey. The visuals of a PowerPoint presentation can only be effective if it supplements and supports the story that is being told. Keeping this in mind our experts created Dashboard To Manage Marketing Campaigns Of Multiple Brands Ppt PowerPoint Presentation Diagram PDF to reduce the time that goes into designing the presentation. This way, you can concentrate on the message while our designers take care of providing you with the right template for the situation.
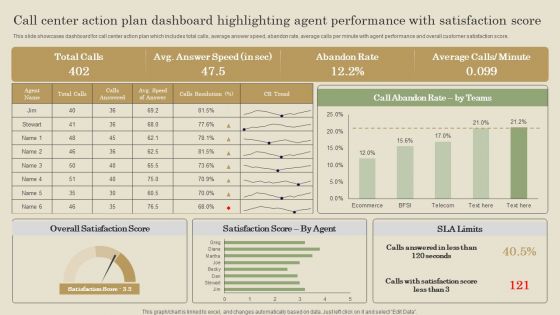
Call Center Action Plan Dashboard Highlighting Agent Performance With Satisfaction Score Diagrams PDF
This slide showcases dashboard for call center action plan which includes total calls, average answer speed, abandon rate, average calls per minute with agent performance and overall customer satisfaction score. Slidegeeks has constructed Call Center Action Plan Dashboard Highlighting Agent Performance With Satisfaction Score Diagrams PDF after conducting extensive research and examination. These presentation templates are constantly being generated and modified based on user preferences and critiques from editors. Here, you will find the most attractive templates for a range of purposes while taking into account ratings and remarks from users regarding the content. This is an excellent jumping off point to explore our content and will give new users an insight into our top notch PowerPoint Templates.
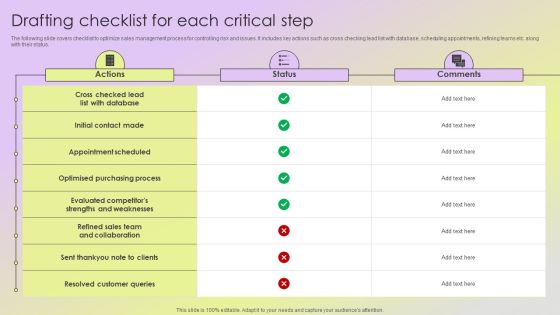
Mitigating Sales Risks With Strategic Action Planning Drafting Checklist For Each Critical Step Diagrams PDF
The following slide covers checklist to optimize sales management process for controlling risk and issues. It includes key actions such as cross checking lead list with database, scheduling appointments, refining teams etc. along with their status. Welcome to our selection of the Mitigating Sales Risks With Strategic Action Planning Drafting Checklist For Each Critical Step Diagrams PDF. These are designed to help you showcase your creativity and bring your sphere to life. Planning and Innovation are essential for any business that is just starting out. This collection contains the designs that you need for your everyday presentations. All of our PowerPoints are 100 percent editable, so you can customize them to suit your needs. This multi purpose template can be used in various situations. Grab these presentation templates today.

Coffee Cafe Company Profile Coffee Stores Growth Highlighting Global Footprint Diagrams PDF
Mentioned slide provides insights into international store presence of Starbucks business. It includes number of stores increased on yearly basis, years of growth, and key takeaways. Slidegeeks is here to make your presentations a breeze with Coffee Cafe Company Profile Coffee Stores Growth Highlighting Global Footprint Diagrams PDF With our easy to use and customizable templates, you can focus on delivering your ideas rather than worrying about formatting. With a variety of designs to choose from, you are sure to find one that suits your needs. And with animations and unique photos, illustrations, and fonts, you can make your presentation pop. So whether you are giving a sales pitch or presenting to the board, make sure to check out Slidegeeks first.

Factors To Consider Before Buying Software Tool Ppt PowerPoint Presentation Diagram PDF
The following slide showcases different factors which can be considered before buying a marketing technology stack. The key factors outlined in the slide are software price, personalization, customer rating, ease of use, and free trial availability. This modern and well arranged Factors To Consider Before Buying Software Tool Ppt PowerPoint Presentation Diagram PDF provides lots of creative possibilities. It is very simple to customize and edit with the Powerpoint Software. Just drag and drop your pictures into the shapes. All facets of this template can be edited with Powerpoint no extra software is necessary. Add your own material, put your images in the places assigned for them, adjust the colors, and then you can show your slides to the world, with an animated slide included.

Impact Of Marketing Strategies On Business Performance Ppt PowerPoint Presentation Diagram Lists PDF
The following slide showcases the positive outcome of marketing strategies on companys performance. Post-implementing marketing strategies company recorded significant increase in brand awareness rate, sales and profit, market share, and customer retention rate. The Impact Of Marketing Strategies On Business Performance Ppt PowerPoint Presentation Diagram Lists PDF is a compilation of the most recent design trends as a series of slides. It is suitable for any subject or industry presentation, containing attractive visuals and photo spots for businesses to clearly express their messages. This template contains a variety of slides for the user to input data, such as structures to contrast two elements, bullet points, and slides for written information. Slidegeeks is prepared to create an impression.
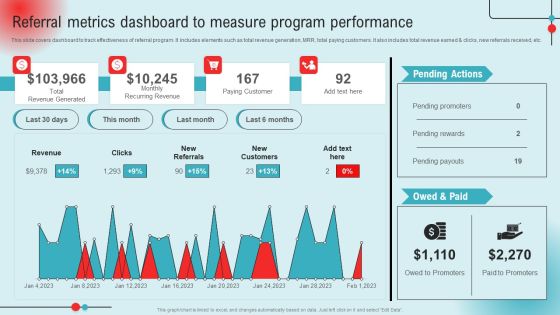
Referral Metrics Dashboard To Measure Program Performance Ppt PowerPoint Presentation Diagram Lists PDF
This slide covers dashboard to track effectiveness of referral program. It includes elements such as total revenue generation, MRR, total paying customers. It also includes total revenue earned and clicks, new referrals received, etc. This Referral Metrics Dashboard To Measure Program Performance Ppt PowerPoint Presentation Diagram Lists PDF from Slidegeeks makes it easy to present information on your topic with precision. It provides customization options, so you can make changes to the colors, design, graphics, or any other component to create a unique layout. It is also available for immediate download, so you can begin using it right away. Slidegeeks has done good research to ensure that you have everything you need to make your presentation stand out. Make a name out there for a brilliant performance.

Enhancing Digital Visibility Using SEO Content Strategy KPI Dashboard To Evaluate Content Performance Diagrams PDF
This slide shows key performance indicators dashboard which can be used by content marketing managers to measure content performance. It includes metrics such as page views, social shares, content first touch, pipeline generated, etc. This modern and well arranged Enhancing Digital Visibility Using SEO Content Strategy KPI Dashboard To Evaluate Content Performance Diagrams PDF provides lots of creative possibilities. It is very simple to customize and edit with the Powerpoint Software. Just drag and drop your pictures into the shapes. All facets of this template can be edited with Powerpoint no extra software is necessary. Add your own material, put your images in the places assigned for them, adjust the colors, and then you can show your slides to the world, with an animated slide included.

Global Business Market Development Guide Country Wise Increase In Organizational Revenues Diagrams PDF
The slide illustrates a graph highlighting the revenues earned by the business in different countries after expansion from 2023 to 2026. Various countries involved are U.S, China, Russia, Australia, Russia and India Are you in need of a template that can accommodate all of your creative concepts This one is crafted professionally and can be altered to fit any style. Use it with Google Slides or PowerPoint. Include striking photographs, symbols, depictions, and other visuals. Fill, move around, or remove text boxes as desired. Test out color palettes and font mixtures. Edit and save your work, or work with colleagues. Download Global Business Market Development Guide Country Wise Increase In Organizational Revenues Diagrams PDF and observe how to make your presentation outstanding. Give an impeccable presentation to your group and make your presentation unforgettable.
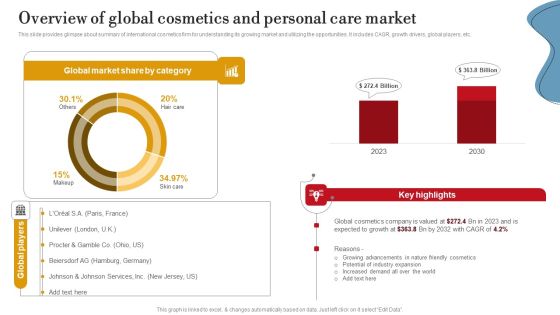
Overview Of Global Cosmetics And Personal Care Market Ppt PowerPoint Presentation Diagram Images PDF
This slide provides glimpse about summary of international cosmetics firm for understanding its growing market and utilizing the opportunities. It includes CAGR, growth drivers, global players, etc. Are you in need of a template that can accommodate all of your creative concepts This one is crafted professionally and can be altered to fit any style. Use it with Google Slides or PowerPoint. Include striking photographs, symbols, depictions, and other visuals. Fill, move around, or remove text boxes as desired. Test out color palettes and font mixtures. Edit and save your work, or work with colleagues. Download Overview Of Global Cosmetics And Personal Care Market Ppt PowerPoint Presentation Diagram Images PDF and observe how to make your presentation outstanding. Give an impeccable presentation to your group and make your presentation unforgettable.

Call Center Quality Enhancement Plan Impact Of Poor Customer Support At Call Center Diagrams PDF
This slide highlights the impacts on the company of poor customer support at BPO call center which showcases comparison of call center companies performance with Quarterly revenue. This Call Center Quality Enhancement Plan Impact Of Poor Customer Support At Call Center Diagrams PDF from Slidegeeks makes it easy to present information on your topic with precision. It provides customization options, so you can make changes to the colors, design, graphics, or any other component to create a unique layout. It is also available for immediate download, so you can begin using it right away. Slidegeeks has done good research to ensure that you have everything you need to make your presentation stand out. Make a name out there for a brilliant performance.

Digitalized Business Checklist Need Of Appointing Chief Digital Officer Diagrams PDF
This slide covers details about the requirement of Chief Digital Officer which will be considered as important in digital advancement of firm as he plays vital role in increasing firms digital capabilities. The Digitalized Business Checklist Need Of Appointing Chief Digital Officer Diagrams PDF is a compilation of the most recent design trends as a series of slides. It is suitable for any subject or industry presentation, containing attractive visuals and photo spots for businesses to clearly express their messages. This template contains a variety of slides for the user to input data, such as structures to contrast two elements, bullet points, and slides for written information. Slidegeeks is prepared to create an impression.
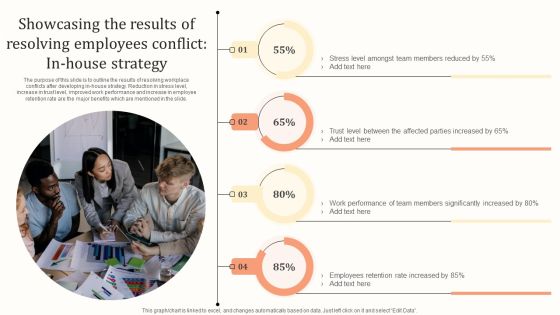
Showcasing The Results Of Resolving Employees Conflict In House Strategy Diagrams PDF
The purpose of this slide is to outline the results of resolving workplace conflicts after developing in-house strategy. Reduction in stress level, increase in trust level, improved work performance and increase in employee retention rate are the major benefits which are mentioned in the slide. Take your projects to the next level with our ultimate collection of Showcasing The Results Of Resolving Employees Conflict In House Strategy Diagrams PDF. Slidegeeks has designed a range of layouts that are perfect for representing task or activity duration, keeping track of all your deadlines at a glance. Tailor these designs to your exact needs and give them a truly corporate look with your own brand colors they will make your projects stand out from the rest.
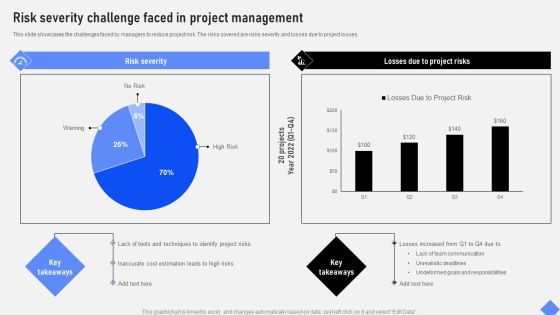
Effective Business Project Risk Mitigation Plan Risk Severity Challenge Faced In Project Management Diagrams PDF
This slide showcases the challenges faced by managers to reduce project risk. The risks covered are risks severity and losses due to project issues. This Effective Business Project Risk Mitigation Plan Risk Severity Challenge Faced In Project Management Diagrams PDF from Slidegeeks makes it easy to present information on your topic with precision. It provides customization options, so you can make changes to the colors, design, graphics, or any other component to create a unique layout. It is also available for immediate download, so you can begin using it right away. Slidegeeks has done good research to ensure that you have everything you need to make your presentation stand out. Make a name out there for a brilliant performance.

B2B Buyers Focus On Identifying And Diagnosing Own Concerns Diagrams PDF
This slide provides information regarding characteristic of B2B buyer in identifying and diagnosing own concerns, Todays B2B buyer focus on exploring solutions at their own. Are you in need of a template that can accommodate all of your creative concepts This one is crafted professionally and can be altered to fit any style. Use it with Google Slides or PowerPoint. Include striking photographs, symbols, depictions, and other visuals. Fill, move around, or remove text boxes as desired. Test out color palettes and font mixtures. Edit and save your work, or work with colleagues. Download B2B Buyers Focus On Identifying And Diagnosing Own Concerns Diagrams PDF and observe how to make your presentation outstanding. Give an impeccable presentation to your group and make your presentation unforgettable.

International Cloud Kitchen Industry Analysis Global Cloud Kitchen Market Size And Growth Diagrams PDF
This slide presents an overview of growth and size of global cloud kitchen market to analyze market competency and potential. It covers key elements such as yearly market growth size and key takeaways. This modern and well-arranged International Cloud Kitchen Industry Analysis Global Cloud Kitchen Market Size And Growth Diagrams PDF provides lots of creative possibilities. It is very simple to customize and edit with the Powerpoint Software. Just drag and drop your pictures into the shapes. All facets of this template can be edited with Powerpoint, no extra software is necessary. Add your own material, put your images in the places assigned for them, adjust the colors, and then you can show your slides to the world, with an animated slide included.

Cashless Payment Strategies To Enhance Business Performance Statistics Highlighting Non Cash Transactions Diagrams PDF
Mentioned slide showcases global non cash transactional which can be used by businesses to evaluate the growth of cashless transactions from previous years. It includes key regions such as Middle east and Africa, Latin America, North America, Europe and Asia Pacific. Want to ace your presentation in front of a live audience Our Cashless Payment Strategies To Enhance Business Performance Statistics Highlighting Non Cash Transactions Diagrams PDF can help you do that by engaging all the users towards you.. Slidegeeks experts have put their efforts and expertise into creating these impeccable powerpoint presentations so that you can communicate your ideas clearly. Moreover, all the templates are customizable, and easy-to-edit and downloadable. Use these for both personal and commercial use.
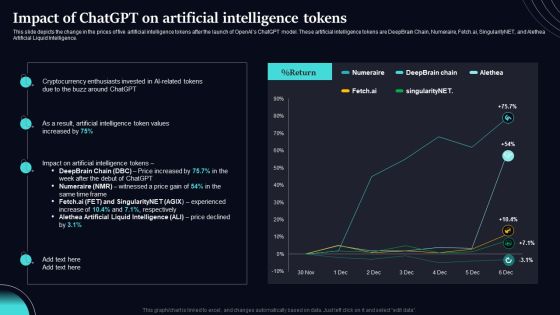
Regenerative Artificial Intelligence Systems Impact Of Chatgpt On Artificial Intelligence Tokens Diagrams PDF
This slide depicts the change in the prices of five artificial intelligence tokens after the launch of OpenAIs ChatGPT model. These artificial intelligence tokens are DeepBrain Chain, Numeraire, Fetch.ai, SingularityNET, and Alethea Artificial Liquid Intelligence. Coming up with a presentation necessitates that the majority of the effort goes into the content and the message you intend to convey. The visuals of a PowerPoint presentation can only be effective if it supplements and supports the story that is being told. Keeping this in mind our experts created Regenerative Artificial Intelligence Systems Impact Of Chatgpt On Artificial Intelligence Tokens Diagrams PDF to reduce the time that goes into designing the presentation. This way, you can concentrate on the message while our designers take care of providing you with the right template for the situation.

SMS Marketing Performance Analytics Report Ppt PowerPoint Presentation Diagram Templates PDF
This slide represents the dashboard to track and monitor the overall performance of SMS marketing campaign and its impact on business sales and revenues. It includes details related to top automated flows, attributed revenue etc. Slidegeeks is here to make your presentations a breeze with SMS Marketing Performance Analytics Report Ppt PowerPoint Presentation Diagram Templates PDF With our easy to use and customizable templates, you can focus on delivering your ideas rather than worrying about formatting. With a variety of designs to choose from, you are sure to find one that suits your needs. And with animations and unique photos, illustrations, and fonts, you can make your presentation pop. So whether you are giving a sales pitch or presenting to the board, make sure to check out Slidegeeks first.

Optimizing Brand Equity Through Strategic Management Impact Of Strategic Brand Management On Brand Image Diagrams PDF
This slide presents a brand image tracking analysis to determine the positive impact of various branding activities on brand value perception among consumers. It includes before and after analysis and key insights. Coming up with a presentation necessitates that the majority of the effort goes into the content and the message you intend to convey. The visuals of a PowerPoint presentation can only be effective if it supplements and supports the story that is being told. Keeping this in mind our experts created Optimizing Brand Equity Through Strategic Management Impact Of Strategic Brand Management On Brand Image Diagrams PDF to reduce the time that goes into designing the presentation. This way, you can concentrate on the message while our designers take care of providing you with the right template for the situation.

Most Popular Social Media Channel Across Globe Ppt PowerPoint Presentation Diagram Lists PDF
The following slide outlines graphical representation of widely used social media platforms. It covers information about channels such as Facebook, Instagram, YouTube, Snapchat, Twitter, iMessage, and Pinterest along with key takeaways. Slidegeeks is here to make your presentations a breeze with Most Popular Social Media Channel Across Globe Ppt PowerPoint Presentation Diagram Lists PDF With our easy to use and customizable templates, you can focus on delivering your ideas rather than worrying about formatting. With a variety of designs to choose from, you are sure to find one that suits your needs. And with animations and unique photos, illustrations, and fonts, you can make your presentation pop. So whether you are giving a sales pitch or presenting to the board, make sure to check out Slidegeeks first.
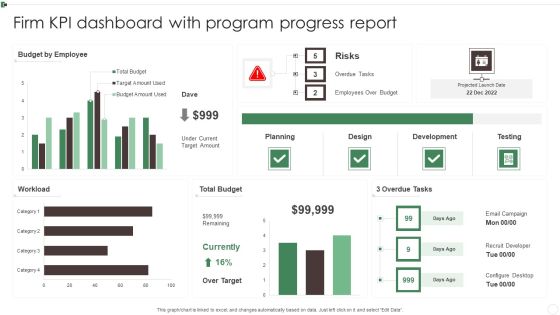
Firm KPI Dashboard With Program Progress Report Ppt Pictures Deck PDF
This graph or chart is linked to excel, and changes automatically based on data. Just left click on it and select Edit Data. Showcasing this set of slides titled Firm KPI Dashboard With Program Progress Report Ppt Pictures Deck PDF. The topics addressed in these templates are Budget By Employee, Total Budget, 3 Overdue Tasks, Workload. All the content presented in this PPT design is completely editable. Download it and make adjustments in color, background, font etc. as per your unique business setting.
Project Tracking And Evaluation Dashboard Portrait PDF
This slide illustrates graphical representation and facts and figures relating to project management data. It includes budget by employee, overdue tasks, workload charts etc. Pitch your topic with ease and precision using this Project Tracking And Evaluation Dashboard Portrait PDF. This layout presents information on Employee Budget, Target, Design, Development. It is also available for immediate download and adjustment. So, changes can be made in the color, design, graphics or any other component to create a unique layout.
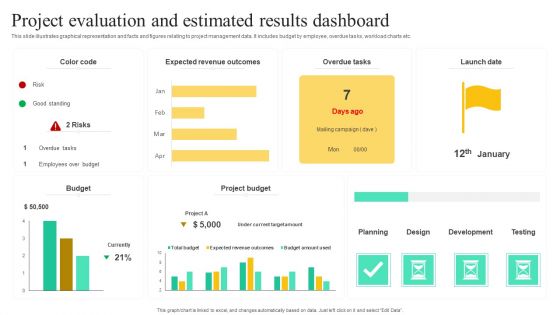
Project Evaluation And Estimated Results Dashboard Ideas PDF
This slide illustrates graphical representation and facts and figures relating to project management data. It includes budget by employee, overdue tasks, workload charts etc. Showcasing this set of slides titled Project Evaluation And Estimated Results Dashboard Ideas PDF. The topics addressed in these templates are Overdue Tasks, Project Budget, Project Evaluation. All the content presented in this PPT design is completely editable. Download it and make adjustments in color, background, font etc. as per your unique business setting.

IT Project Time Scheduling Dashboard With Task Progress Sample PDF
This slide exhibits IT project time management dashboard with task progress. It contains information about project or task entry, time taken, budget, etc. which can be beneficial in tracking an IT projects weekly budget and time. Showcasing this set of slides titled it project time scheduling dashboard with task progress sample pdf. The topics addressed in these templates are project, budget. All the content presented in this PPT design is completely editable. Download it and make adjustments in color, background, font etc. as per your unique business setting.

Project Portfolio Metrics Dashboard With Activity Plan Clipart PDF
This slide focuses on project portfolio management dashboard which includes completed projects, budget spent, number of team members, associated risks and issues, activity plan with duration, status percentage, budget allocation, critical issues, tasks, comments, etc. Pitch your topic with ease and precision using this Project Portfolio Metrics Dashboard With Activity Plan Clipart PDF. This layout presents information on Budgets, Team, Risks. It is also available for immediate download and adjustment. So, changes can be made in the color, design, graphics or any other component to create a unique layout.

Acquisition Cost Per Customer Ppt PowerPoint Presentation Example 2015
This is a acquisition cost per customer ppt powerpoint presentation example 2015. This is a three stage process. The stages in this process are rising, steady, falling.

Cost Reducing Measures In Manufacturing Business Information PDF
This slide shows ways to reduce manufacturing costs to maintain profitability of business. It includes five ways audit, cut out surplus, optimize efficiency, quality control and smart investments. Presenting Cost Reducing Measures In Manufacturing Business Information PDF to dispense important information. This template comprises Five stages. It also presents valuable insights into the topics including Cut Out Surplus, Optimize Efficiency, Quality Control. This is a completely customizable PowerPoint theme that can be put to use immediately. So, download it and address the topic impactfully.
