AI PPT Maker
Templates
PPT Bundles
Design Services
Business PPTs
Business Plan
Management
Strategy
Introduction PPT
Roadmap
Self Introduction
Timelines
Process
Marketing
Agenda
Technology
Medical
Startup Business Plan
Cyber Security
Dashboards
SWOT
Proposals
Education
Pitch Deck
Digital Marketing
KPIs
Project Management
Product Management
Artificial Intelligence
Target Market
Communication
Supply Chain
Google Slides
Research Services
 One Pagers
All Categories
-
Home
- Customer Favorites
- Bank Icon
Bank Icon

Proactive Method For 5G Deployment By Telecom Companies 5G Emerging As Network Of Opportunity Diagrams PDF
This slide provides details regarding 5G as next generation mobile technology and emerging as network of opportunity catering various need of users, telecom operators, etc. Deliver an awe inspiring pitch with this creative Proactive Method For 5G Deployment By Telecom Companies 5G Emerging As Network Of Opportunity Diagrams PDF bundle. Topics like Consistent Connectivity, Overall Enhancement, Across Geographical can be discussed with this completely editable template. It is available for immediate download depending on the needs and requirements of the user.
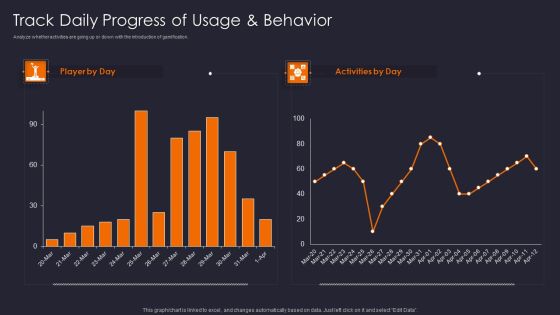
Implementing Gamification Marketing Plan To Increase Conversions Track Daily Progress Of Usage Diagrams PDF
Analyze whether activities are going up or down with the introduction of gamification.Deliver an awe inspiring pitch with this creative Implementing Gamification Marketing Plan To Increase Conversions Track Daily Progress Of Usage Diagrams PDF bundle. Topics like Track Daily, Progress Usage, Behavior can be discussed with this completely editable template. It is available for immediate download depending on the needs and requirements of the user.

Digital Asset Management In Visual World Why Digital Content Diagrams PDF
This slide covers introduction about digital media, how it has evolved till now and facts about social media content etc.Deliver and pitch your topic in the best possible manner with this Digital Asset Management In Visual World Why Digital Content Diagrams PDF Use them to share invaluable insights on Earliest Recorded, Paintings Of Lascaux, Although Distribution and impress your audience. This template can be altered and modified as per your expectations. So, grab it now.

Sales CRM Cloud Solutions Deployment CRM Implementation Dashboard With Customer Diagrams PDF
This slide showcases the dashboard for CRM which includes the revenue, marketing expenses, satisfaction rate, conversion funnel, tickets volume by priority, and expected sales this year.Deliver an awe inspiring pitch with this creative Sales CRM Cloud Solutions Deployment CRM Implementation Dashboard With Customer Diagrams PDF bundle. Topics like Conversion Funnel, Customer Satisfaction, Expected Sales can be discussed with this completely editable template. It is available for immediate download depending on the needs and requirements of the user.

How To Develop Branding And Storytelling With DAM Why Digital Content Diagrams PDF
This slide covers introduction about digital media, how it has evolved till now and facts about social media content etc. Deliver an awe inspiring pitch with this creative How To Develop Branding And Storytelling With DAM Why Digital Content Diagrams PDF bundle. Topics like Produced Digital, Printed And Distributed, Medium Of Communication can be discussed with this completely editable template. It is available for immediate download depending on the needs and requirements of the user.
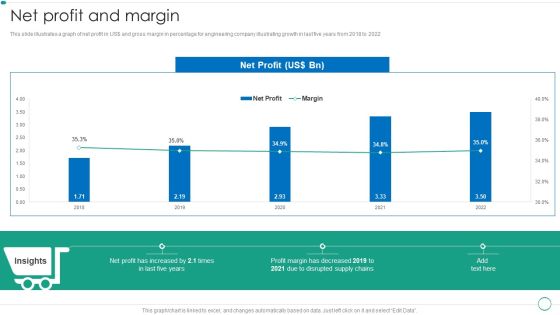
Real Estate Construction And Engineering Company Profile Net Profit And Margin Diagrams PDF
This slide illustrates a graph of net profit in US and gross margin in percentage for engineering company illustrating growth in last five years from 2018 to 2022.Deliver an awe inspiring pitch with this creative Real Estate Construction And Engineering Company Profile Net Profit And Margin Diagrams PDF bundle. Topics like Disrupted Supply, Profit Margin, Increased can be discussed with this completely editable template. It is available for immediate download depending on the needs and requirements of the user.

Current Situation Decrease In Year Over Year Revenue Generation Diagrams PDF
This slide covers revenue generation statistics of the firm over past three years. It also depicts that revenue recorded in FY21 was dollar2070 as compared to dollar4720 in FY19.Deliver an awe inspiring pitch with this creative Current Situation Decrease In Year Over Year Revenue Generation Diagrams PDF bundle. Topics like Revenue Generated, Gets Decreased, Key Takeaways can be discussed with this completely editable template. It is available for immediate download depending on the needs and requirements of the user.

Top Cyber Risks Faced By The Real Estate Company Diagrams PDF
The following slide exhibits four cyber risks which are faced by the real estate organization. It provides key information about the ransomware, phishing, web-based attack and email fraud attack. Deliver an awe inspiring pitch with this creative Top Cyber Risks Faced By The Real Estate Company Diagrams PDF bundle. Topics like Ransomware Business Compromise, Businesses Currently can be discussed with this completely editable template. It is available for immediate download depending on the needs and requirements of the user.

Computer Simulation Human Thinking Tracking Essential Virtual Agents Activities Dashboard Diagrams PDF
This slide provides information regarding virtual agents essential activities dashboard in terms of daily number of new conversation, unique users weekly conversations by channel, etc. Deliver an awe inspiring pitch with this creative Computer Simulation Human Thinking Tracking Essential Virtual Agents Activities Dashboard Diagrams PDF bundle. Topics like Unique Users, Weekly Conversations Channel, Weekly Conversations Topic can be discussed with this completely editable template. It is available for immediate download depending on the needs and requirements of the user.
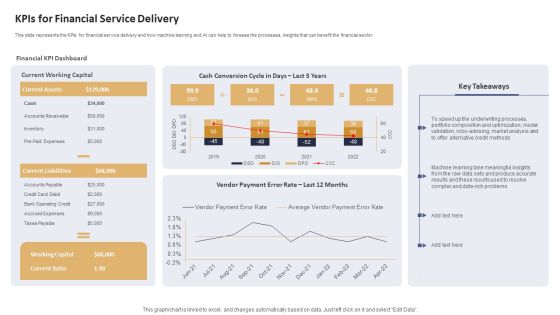
Data Processing Services Delivery Kpis For Financial Service Delivery Diagrams PDF
This slide represents the KPIs for financial service delivery and how machine learning and AI can help to foresee the processes, insights that can benefit the financial sector. Deliver an awe inspiring pitch with this creative Data Processing Services Delivery Kpis For Financial Service Delivery Diagrams PDF bundle. Topics like Financial KPI Dashboard, Current Working Capital, Cash Conversion can be discussed with this completely editable template. It is available for immediate download depending on the needs and requirements of the user.

Customer Relationship Management Post Implementation Impacts On Business Aspects Diagrams PDF
This slide covers major improvements after CRM software implementation. It includes major impact on areas such as customer retention, customer satisfaction, sales revenue, and upselling cross selling. Deliver and pitch your topic in the best possible manner with this Customer Relationship Management Post Implementation Impacts On Business Aspects Diagrams PDF. Use them to share invaluable insights on Regular Reminders, Customer Retention, Customer Interaction and impress your audience. This template can be altered and modified as per your expectations. So, grab it now.

Agile Sprint Technique In Software Advantages Of Agile Methodology Diagrams PDF
This slide depicts the advantages of agile methodology that include managing changing priorities, project visibility, IT alignment, delivery speed, team morale, increased productivity, and so on.Deliver and pitch your topic in the best possible manner with this Agile Sprint Technique In Software Advantages Of Agile Methodology Diagrams PDF. Use them to share invaluable insights on Software Maintainability, Managing Distributed, Engineering Discipline and impress your audience. This template can be altered and modified as per your expectations. So, grab it now.

Complete Online Marketing Audit Guide Findings Of Social Media Channels Audit Diagrams PDF
This slide highlights the social media audit which showcase the performance grade of presence with Facebook, Instagram, twitter and YouTube detailed audit results, Deliver an awe inspiring pitch with this creative Complete Online Marketing Audit Guide Findings Of Social Media Channels Audit Diagrams PDF bundle. Topics like Engagement Rate, Social Media Presence can be discussed with this completely editable template. It is available for immediate download depending on the needs and requirements of the user.

Complete Online Marketing Audit Guide Website Seo Audit With Page Load Speed Diagrams PDF
This slide highlights the SEO audit which showcases the page score, critical errors, warnings, crawled pages results, site health, hreflang audit and page load speed. Deliver an awe inspiring pitch with this creative Complete Online Marketing Audit Guide Website Seo Audit With Page Load Speed Diagrams PDF bundle. Topics like Website SEO Audit can be discussed with this completely editable template. It is available for immediate download depending on the needs and requirements of the user.

Metrics To Measure Business Performance Effective Rate Metrics By Customer And Offering Diagrams PDF
This slide covers effective rate metrics. It shows over year over comparison of effective rate per customer as well as effective rate per offering. Deliver and pitch your topic in the best possible manner with this Metrics To Measure Business Performance Effective Rate Metrics By Customer And Offering Diagrams PDF. Use them to share invaluable insights on Effective Rate, Per Customer, Per Offering and impress your audience. This template can be altered and modified as per your expectations. So, grab it now.

B2B Sales Techniques Playbook B2B Sales Representatives Performance Tracking Dashboard Diagrams PDF
This slide provides information regarding B2B sales representatives performance tracking dashboard to measure leads by region, revenue breakdown, top performers by leads, revenues, etc. Deliver and pitch your topic in the best possible manner with this B2B Sales Techniques Playbook B2B Sales Representatives Performance Tracking Dashboard Diagrams PDF. Use them to share invaluable insights on Combine Sales, Individual Performance, Achieved Highest and impress your audience. This template can be altered and modified as per your expectations. So, grab it now.

Dashboard For Big Data Management Ppt PowerPoint Presentation File Diagrams PDF
This slide represents the dashboards for big data deployment by covering details of visitors and return visitors, subscribers, top 3 articles by readers, avg duration, and pages per visit. Deliver an awe inspiring pitch with this creative Dashboard For Big Data Management Ppt PowerPoint Presentation File Diagrams PDF bundle. Topics like Dashboard, Big Data Management can be discussed with this completely editable template. It is available for immediate download depending on the needs and requirements of the user.
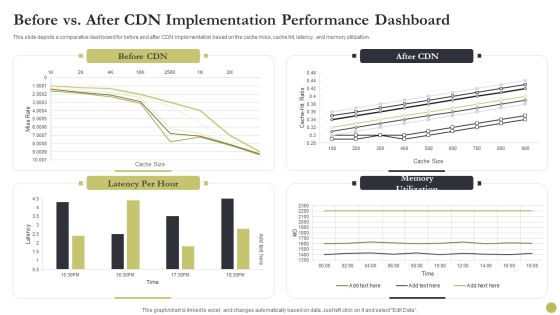
Content Delivery Network Edge Server Before Vs After CDN Implementation Performance Dashboard Diagrams PDF
This slide depicts a comparative dashboard for before and after CDN implementation based on the cache miss, cache hit, latency, and memory utilization. Deliver an awe inspiring pitch with this creative Content Delivery Network Edge Server Before Vs After CDN Implementation Performance Dashboard Diagrams PDF bundle. Topics like After Cdn Implementation, Performance Dashboard can be discussed with this completely editable template. It is available for immediate download depending on the needs and requirements of the user.
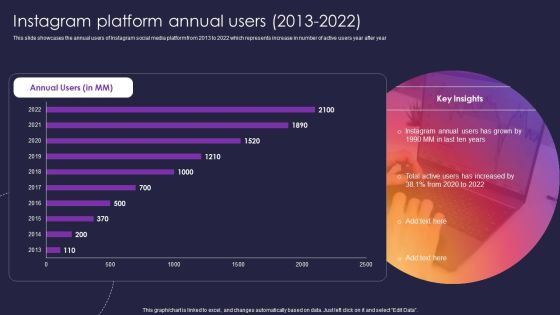
Instagram Company Details Instagram Platform Annual Users 2013 To 2022 Diagrams PDF
This slide showcases the annual users of Instagram social media platform from 2013 to 2022 which represents increase in number of active users year after year. Deliver and pitch your topic in the best possible manner with this Instagram Company Details Instagram Platform Annual Users 2013 To 2022 Diagrams PDF. Use them to share invaluable insights on Instagram Platform Annual Users and impress your audience. This template can be altered and modified as per your expectations. So, grab it now.

Analysis Of Average Wait Time At Retail Store Checkout Counters Retail Outlet Operations Diagrams PDF
The slide visually provides information regarding the average time customer spent at the checkout counter of retail store. It also provides details regarding waiting timings of competitors.Deliver an awe inspiring pitch with this creative Analysis Of Average Wait Time At Retail Store Checkout Counters Retail Outlet Operations Diagrams PDF bundle. Topics like Quarter Customers, Complaints Regarding, Behavior Increased can be discussed with this completely editable template. It is available for immediate download depending on the needs and requirements of the user.

Analysis Of Cleanliness At Retail Store Retail Outlet Operations Performance Evaluation Diagrams PDF
This slide illustrates the graph to showcase visitors responses towards the cleanliness of multiple store areas such as floor, display counters, try rooms etc.Deliver and pitch your topic in the best possible manner with this Analysis Of Cleanliness At Retail Store Retail Outlet Operations Performance Evaluation Diagrams PDF. Use them to share invaluable insights on Retail Store, Visitors Responded, Stores Floors and impress your audience. This template can be altered and modified as per your expectations. So, grab it now.
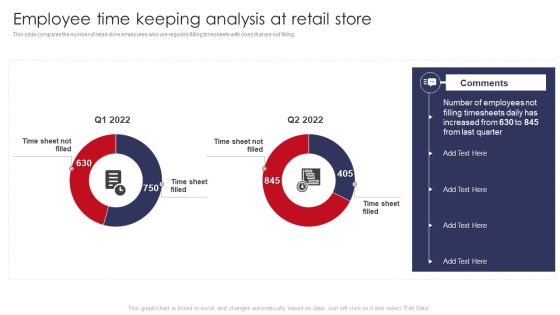
Employee Time Keeping Analysis At Retail Store Retail Outlet Operations Performance Evaluation Diagrams PDF
This slide compares the number of retail store employees who are regularly filling timesheets with ones that are not filling.Deliver an awe inspiring pitch with this creative Employee Time Keeping Analysis At Retail Store Retail Outlet Operations Performance Evaluation Diagrams PDF bundle. Topics like Filling Timesheets, Increased, Last Quarter can be discussed with this completely editable template. It is available for immediate download depending on the needs and requirements of the user.
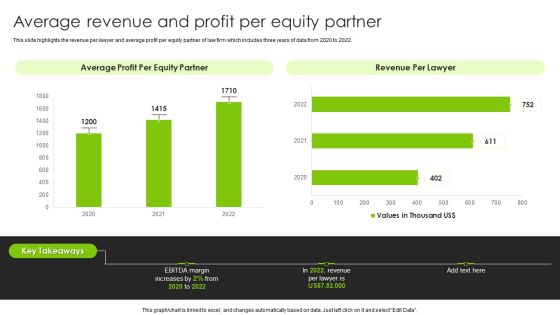
International Legal And Business Services Company Profile Average Revenue And Profit Per Equity Partner Diagrams PDF
This slide highlights the revenue per lawyer and average profit per equity partner of law firm which includes three years of data from 2020 to 2022. Deliver an awe inspiring pitch with this creative International Legal And Business Services Company Profile Average Revenue And Profit Per Equity Partner Diagrams PDF bundle. Topics like Revenue Per Lawyer, Average Profit, Equity Partner can be discussed with this completely editable template. It is available for immediate download depending on the needs and requirements of the user.
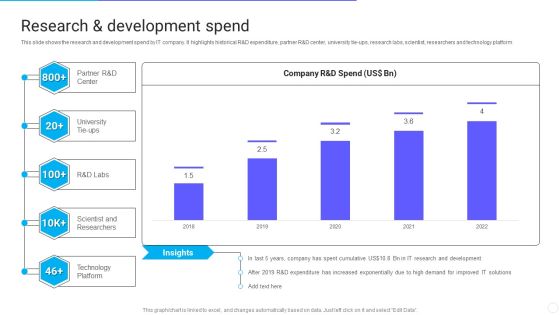
IT Application Services Company Outline Research And Development Spend Diagrams PDF
This slide shows the research and development spend by IT company. It highlights historical R and D expenditure, partner R and D center, university tie ups, research labs, scientist, researchers and technology platform. Deliver an awe inspiring pitch with this creative IT Application Services Company Outline Research And Development Spend Diagrams PDF bundle. Topics like Expenditure, Demand, Development can be discussed with this completely editable template. It is available for immediate download depending on the needs and requirements of the user.

Vendor Procurement Cycle And Expenses Management Dashboard Vendor Management Strategies Diagrams PDF
The following slide illustrates supplier procurement cycle and expenses management dashboard. It provides information about conracted, unlisted, top suppliers, spending, savings, procurement cycle time, etc.Deliver an awe inspiring pitch with this creative Vendor Procurement Cycle And Expenses Management Dashboard Vendor Management Strategies Diagrams PDF bundle. Topics like Contracted, Unlisted, Vendors Procurement can be discussed with this completely editable template. It is available for immediate download depending on the needs and requirements of the user.
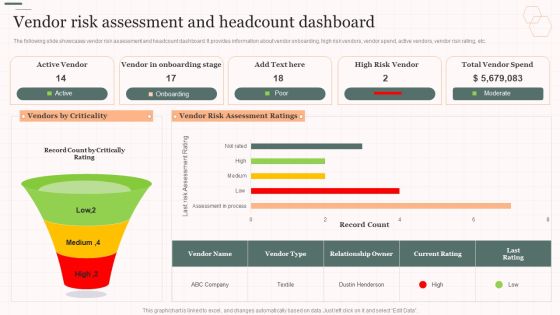
Vendor Risk Assessment And Headcount Dashboard Vendor Management Strategies Diagrams PDF
The following slide showcases vendor risk assessment and headcount dashboard. It provides information about vendor onboarding, high risk vendors, vendor spend, active vendors, vendor risk rating, etc. Deliver and pitch your topic in the best possible manner with this Vendor Risk Assessment And Headcount Dashboard Vendor Management Strategies Diagrams PDF. Use them to share invaluable insights on Assessment Ratings, Vendors Criticality, Vendor Onboarding and impress your audience. This template can be altered and modified as per your expectations. So, grab it now.

Strategic Management Consultancy Business Profile Employee Count And Breakdown Diagrams PDF
This slide represents the employee count for last five years from 2018 to 2022. It also includes employee split by geography and gender. Deliver an awe inspiring pitch with this creative Strategic Management Consultancy Business Profile Employee Count And Breakdown Diagrams PDF bundle. Topics like Employee Split By Gender, Employee Split By Geography, Employee Count can be discussed with this completely editable template. It is available for immediate download depending on the needs and requirements of the user.
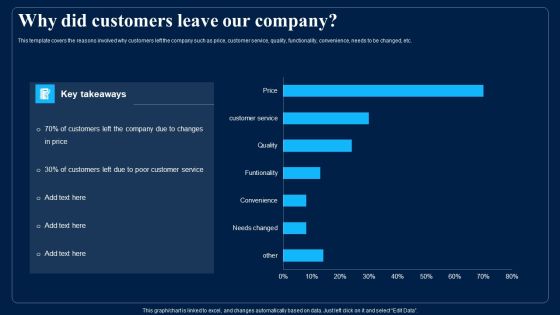
Identifying Optimum Pricing Methods For Business Why Did Customers Leave Our Company Diagrams PDF
This template covers the reasons involved why customers left the company such as price, customer service, quality, functionality, convenience, needs to be changed, etc. Deliver and pitch your topic in the best possible manner with this Identifying Optimum Pricing Methods For Business Why Did Customers Leave Our Company Diagrams PDF. Use them to share invaluable insights on Quality, Customer Service, Price and impress your audience. This template can be altered and modified as per your expectations. So, grab it now.

Organizational Change Management Process Flow Dashboard Ppt PowerPoint Presentation Diagram PDF
This slide covers Business change management lifecycle dashboard. It involves overall health, customer data, financials and operational efficiency. Pitch your topic with ease and precision using this Organizational Change Management Process Flow Dashboard Ppt PowerPoint Presentation Diagram PDF. This layout presents information on Financial Data, Operational Efficiency, Consumer Data. It is also available for immediate download and adjustment. So, changes can be made in the color, design, graphics or any other component to create a unique layout.
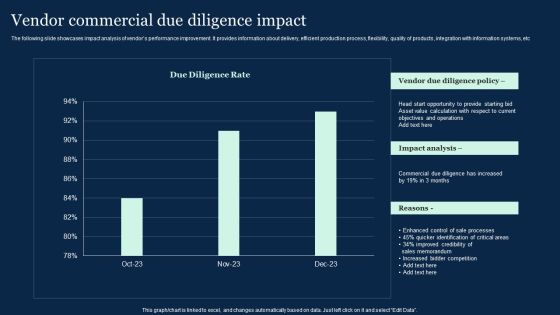
Vendor Commercial Due Diligence Impact Effective Vendor Management For Enhancing Diagrams PDF
The following slide showcases impact analysis of vendors performance improvement. It provides information about delivery, efficient production process, flexibility, quality of products, integration with information systems, etc. There are so many reasons you need a Vendor Commercial Due Diligence Impact Effective Vendor Management For Enhancing Diagrams PDF. The first reason is you can not spend time making everything from scratch, Thus, Slidegeeks has made presentation templates for you too. You can easily download these templates from our website easily.

Target Customer Analysis Evaluating Growth Rate Of Target Market Diagrams PDF
This slide showcases graph that can help organization to evaluate growth rate of target market. It can help company to identify potential and suitability of target market for expanding operations globally. There are so many reasons you need a Target Customer Analysis Evaluating Growth Rate Of Target Market Diagrams PDF. The first reason is you cant spend time making everything from scratch, Thus, Slidegeeks has made presentation templates for you too. You can easily download these templates from our website easily.

Boosting Customer Base Through Effective Dashboard Depicting Customer Service Insights Diagrams PDF
This slide shows the dashboard that depicts customer service insights which includes number of solved tickets, average resolution and response time, customer feedback, total visitors and chats. There are so many reasons you need a Boosting Customer Base Through Effective Dashboard Depicting Customer Service Insights Diagrams PDF. The first reason is you cant spend time making everything from scratch, Thus, Slidegeeks has made presentation templates for you too. You can easily download these templates from our website easily.
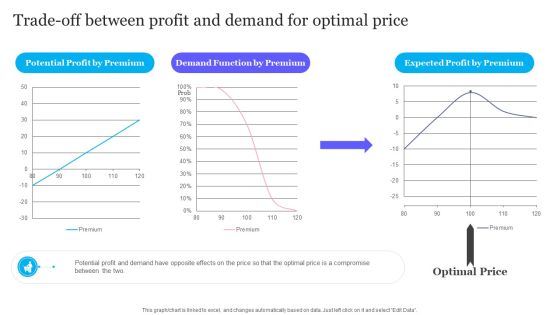
Trade Off Between Profit And Demand For Optimal Price Diagrams PDF
From laying roadmaps to briefing everything in detail, our templates are perfect for you. You can set the stage with your presentation slides. All you have to do is download these easy to edit and customizable templates. Trade Off Between Profit And Demand For Optimal Price Diagrams PDF will help you deliver an outstanding performance that everyone would remember and praise you for. Do download this presentation today.
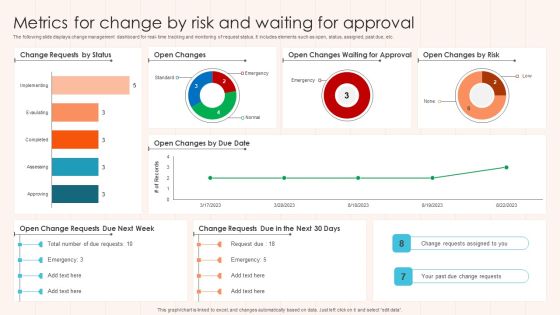
Metrics For Change By Risk And Waiting For Approval Diagrams PDF
The following slide displays change management dashboard for real- time tracking and monitoring of request status. It includes elements such as open, status, assigned, past due, etc. Pitch your topic with ease and precision using this Metrics For Change By Risk And Waiting For Approval Diagrams PDF This layout presents information on Approval, Risk, Status. It is also available for immediate download and adjustment. So, changes can be made in the color, design, graphics or any other component to create a unique layout.

Analyzing Impact Of Performance Marketing Campaigns Ppt PowerPoint Presentation Diagram Images PDF
This slide showcases impact of performance marketing campaigns which can help organization to evaluate the effectiveness of executed plan. Its key elements are website traffic and product sales There are so many reasons you need a Analyzing Impact Of Performance Marketing Campaigns Ppt PowerPoint Presentation Diagram Images PDF. The first reason is you cannot spend time making everything from scratch, Thus, Slidegeeks has made presentation templates for you too. You can easily download these templates from our website easily.

Best Time And Day To Post Content On Facebook Ppt PowerPoint Presentation Diagram Templates PDF
The following slide outlines optimal time and day of week when brands should publish content on Facebook page to reach and engage with maximum number of people. Posting content at right time can assist companies in increasing organic reach and customer engagement. Presenting this PowerPoint presentation, titled Best Time And Day To Post Content On Facebook Ppt PowerPoint Presentation Diagram Templates PDF, with topics curated by our researchers after extensive research. This editable presentation is available for immediate download and provides attractive features when used. Download now and captivate your audience. Presenting this Best Time And Day To Post Content On Facebook Ppt PowerPoint Presentation Diagram Templates PDF. Our researchers have carefully researched and created these slides with all aspects taken into consideration. This is a completely customizable Best Time And Day To Post Content On Facebook Ppt PowerPoint Presentation Diagram Templates PDF that is available for immediate downloading. Download now and make an impact on your audience. Highlight the attractive features available with our PPTs.

Cryptocurrency Mining Methods With Estimated Operations Cost Information PDF
This slide showcases methods of bitcoin mining that can help organization assess different process on the basis of investment cost recovery and average setup cost. Its four methods are cloud mining, CPU mining, GPU mining and ASIC mining Presenting Cryptocurrency Mining Methods With Estimated Operations Cost Information PDF to dispense important information. This template comprises four stages. It also presents valuable insights into the topics including Cloud Mining, Cpu Mining, Gpu Mining. This is a completely customizable PowerPoint theme that can be put to use immediately. So, download it and address the topic impactfully.

Computer Development And Generation Chart Powerpoint Slides
This PPT slide displays graphics of computer devices. Use this PPT design to display technology development and generation. This PowerPoint template can be customized as per requirements of business education or any other theme.

Essential Factors Before Making Funding Decision Ppt PowerPoint Presentation File Model PDF
Presenting Essential Factors Before Making Funding Decision Ppt PowerPoint Presentation File Model PDF to dispense important information. This template comprises one stages. It also presents valuable insights into the topics including Draw Financial Roadmap, Maintain Emergency Fund, Evaluate Risk Tolerance Limit, Consider Rebalancing Portfolio. This is a completely customizable PowerPoint theme that can be put to use immediately. So, download it and address the topic impactfully.
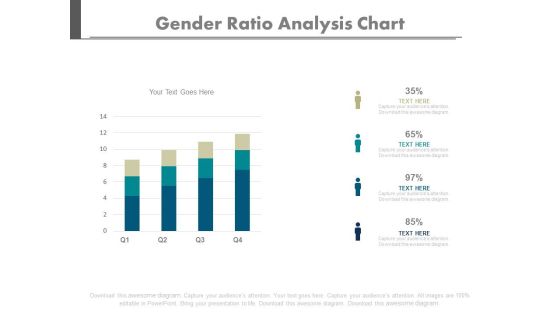
Four Bars Gender Population Ratio Chart Powerpoint Slides
Create dynamic presentations with our creative template of bar graph. This diagram may be used to present gender population. Download this template to leave permanent impression on your audience.
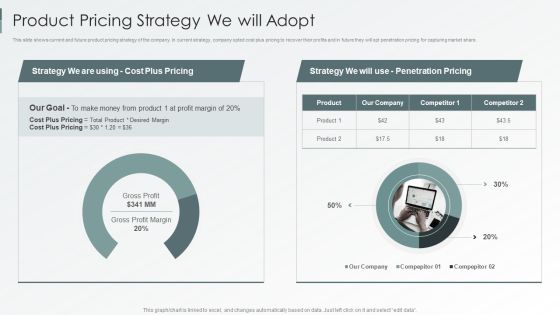
Enterprise Sustainability Performance Metrics Product Pricing Strategy We Will Adopt Brochure PDF
This slide shows current and future product pricing strategy of the company. In current strategy, company opted cost plus pricing to recover their profits and in future they will opt penetration pricing for capturing market share.Deliver and pitch your topic in the best possible manner with this Enterprise Sustainability Performance Metrics Product Pricing Strategy We Will Adopt Brochure PDF. Use them to share invaluable insights on Competitor, Desired Margin, Money Product and impress your audience. This template can be altered and modified as per your expectations. So, grab it now.

Deploying Online Marketing Key Statistics Associated With Digital Marketing Themes PDF
This slide represents digital marketing statistics that enable marketers to understand market, make marketing related decisions and respond to customer demand. It include SEO, social media, open rate, social selling etc. Boost your pitch with our creative Deploying Online Marketing Key Statistics Associated With Digital Marketing Themes PDF. Deliver an awe-inspiring pitch that will mesmerize everyone. Using these presentation templates you will surely catch everyones attention. You can browse the ppts collection on our website. We have researchers who are experts at creating the right content for the templates. So you dont have to invest time in any additional work. Just grab the template now and use them.
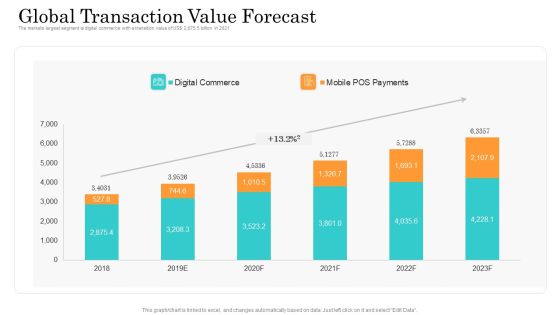
Online Payment Service Global Transaction Value Forecast Ppt Infographics Ideas PDF
The markets largest segment is digital commerce with a transition value of US dollar 2,875.5 billion in 2021. Deliver an awe-inspiring pitch with this creative online payment service global transaction value forecast ppt infographics ideas pdf bundle. Topics like global transaction value forecast can be discussed with this completely editable template. It is available for immediate download depending on the needs and requirements of the user.

Advancement Of Retail Store In Future Challenges Faced By Retailers At Present Pictures PDF
This slide provides information regarding challenges faced by retailers at current times and challenges associated to on demand consumer characteristics. Deliver an awe inspiring pitch with this creative advancement of retail store in future challenges faced by retailers at present pictures pdf bundle. Topics like maintaining, commoditization, awareness, e commerce can be discussed with this completely editable template. It is available for immediate download depending on the needs and requirements of the user.

Advance IT Service Delivery Kpis For Service Delivery Sales And Marketing Formats PDF
This slide describes how sales and marketing will be boost by incorporating AI which will further lead to business growth and profits. Deliver and pitch your topic in the best possible manner with this advance it service delivery kpis for service delivery sales and marketing formats pdf. Use them to share invaluable insights on dynamic and personalization, e commerce purchases, time and impress your audience. This template can be altered and modified as per your expectations. So, grab it now.
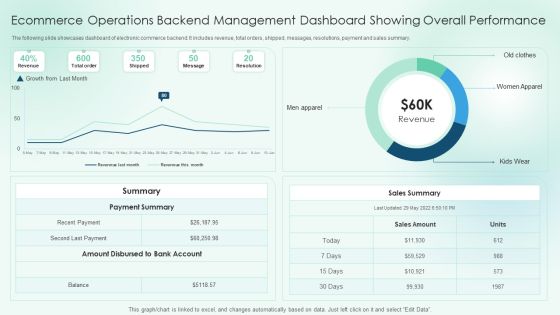
Ecommerce Operations Backend Management Dashboard Showing Overall Performance Slides PDF
The following slide showcases dashboard of electronic commerce backend. It includes revenue, total orders, shipped, messages, resolutions, payment and sales summary.Pitch your topic with ease and precision using this Ecommerce Operations Backend Management Dashboard Showing Overall Performance Slides PDF. This layout presents information on Payment Summary, Amount Disbursed, Sales Summary. It is also available for immediate download and adjustment. So, changes can be made in the color, design, graphics or any other component to create a unique layout.
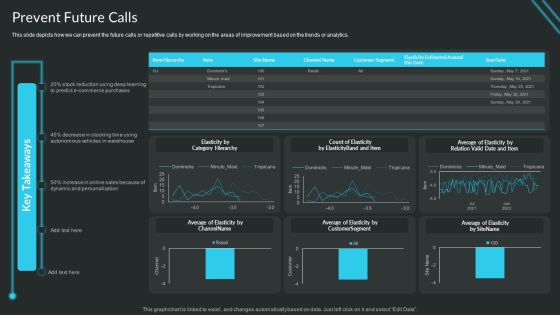
Proactive Consumer Solution And How To Perform It Prevent Future Calls Slide Rules PDF
This slide depicts how we can prevent the future calls or repetitive calls by working on the areas of improvement based on the trends or analytics.Deliver an awe inspiring pitch with this creative Proactive Consumer Solution And How To Perform It Prevent Future Calls Slide Rules PDF bundle. Topics like Commerce Purchases, Autonomous Vehicles, Dynamic Person can be discussed with this completely editable template. It is available for immediate download depending on the needs and requirements of the user.

Logistics Shipment Company Profile Client Distribution By Transportation Orders Demonstration PDF
The slide showcases the client distribution by transportation orders illustrating shipping orders distribution between US government, manufacturing companies, ecommerce services, medical deliveries, private packages, imports and exports. Deliver an awe inspiring pitch with this creative Logistics Shipment Company Profile Client Distribution By Transportation Orders Demonstration PDF bundle. Topics like Shipping Orders, Distribution 2022, Strategic Partnerships, E Commerce Services can be discussed with this completely editable template. It is available for immediate download depending on the needs and requirements of the user.

Expand Total Addressable Market Crm Salesforce Business Profile Clipart PDF
This slide highlights the salesforce total addressable market for sales, service, marketing and commerce, platform and data for financial year 2021 to 2025. Deliver and pitch your topic in the best possible manner with this Expand Total Addressable Market Crm Salesforce Business Profile Clipart PDF. Use them to share invaluable insights on Target, Addressable Market, Growth and impress your audience. This template can be altered and modified as per your expectations. So, grab it now.

Customer Review Snapshot On Apparel Business Ideas PDF
This slide showcases customer review snapshot of women apparel e commerce business. It further covers ratings distribution, pros, best uses and buyer description. Showcasing this set of slides titled Customer Review Snapshot On Apparel Business Ideas PDF. The topics addressed in these templates are Customer Review Snapshot, Apparel Business. All the content presented in this PPT design is completely editable. Download it and make adjustments in color, background, font etc. as per your unique business setting.

Ecommerce Landing Page Conversion Rate Optimization Statistics Sample PDF
This slide depicts conversion rates of e-commerce website visitors to customers based on industries. It includes sports, arts, automotive, apparel, healthcare, kitchen appliances, home accessories, pet care, etc. Showcasing this set of slides titled Ecommerce Landing Page Conversion Rate Optimization Statistics Sample PDF. The topics addressed in these templates are Conversion Rates, Artistic Products, Infant Products. All the content presented in this PPT design is completely editable. Download it and make adjustments in color, background, font etc. as per your unique business setting.
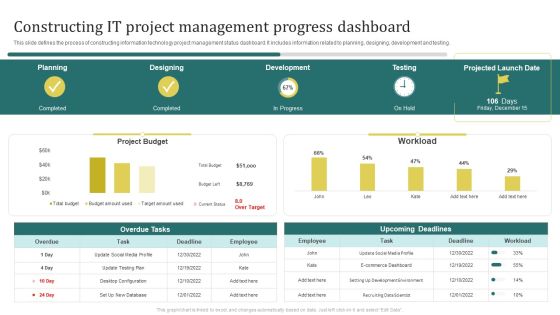
Constructing It Project Management Progress Dashboard Brochure PDF
This slide defines the process of constructing information technology project management status dashboard. It includes information related to planning, designing, development and testing.Pitch your topic with ease and precision using this Constructing It Project Management Progress Dashboard Brochure PDF. This layout presents information on E Commerce Dashboard, Development Environment, Recruiting Data Scientist. It is also available for immediate download and adjustment. So, changes can be made in the color, design, graphics or any other component to create a unique layout.

Actual And Forecasted Corporate Sales Comparison Brochure PDF
This slide shows the comparison of actual and forecasted sales for each quarter of e-commerce products. Actual sales are less then expected due to poor implementation of strategy. Showcasing this set of slides titled Actual And Forecasted Corporate Sales Comparison Brochure PDF. The topics addressed in these templates are Actual And Forecasted, Corporate Sales Comparison. All the content presented in this PPT design is completely editable. Download it and make adjustments in color, background, font etc. as per your unique business setting.
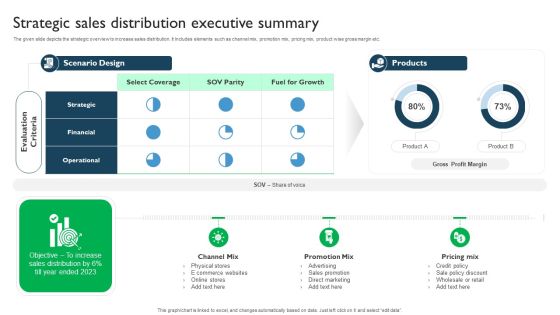
Strategic Sales Distribution Executive Summary Demonstration PDF
The given slide depicts the strategic overview to increase sales distribution. It Includes elements such as channel mix, promotion mix, pricing mix, product wise gross margin etc. Pitch your topic with ease and precision using this Strategic Sales Distribution Executive Summary Demonstration PDF. This layout presents information on E Commerce Websites, Sales Promotion, Advertising. It is also available for immediate download and adjustment. So, changes can be made in the color, design, graphics or any other component to create a unique layout.

Implementation Of An Effective Retail Center Advertising Plan Major Challenges Faced Shopping Formats PDF
This slide represents challenges faced by shopping centers such as decline in foot traffic and customer conversion rate. It includes details regarding e-commerce stores, personalization for products and services. There are so many reasons you need a Implementation Of An Effective Retail Center Advertising Plan Major Challenges Faced Shopping Formats PDF. The first reason is you cannot spend time making everything from scratch, Thus, Slidegeeks has made presentation templates for you too. You can easily download these templates from our website easily.
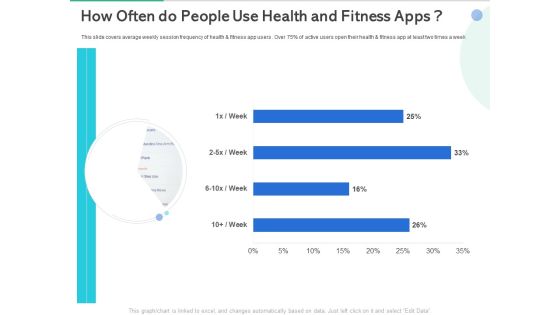
Market Overview Fitness Industry How Often Do People Use Health And Fitness Apps Diagrams PDF
This slide covers average weekly session frequency of health and fitness app users . Over 75 percent of active users open their health and fitness app at least two times a week. Deliver an awe-inspiring pitch with this creative market overview fitness industry how often do people use health and fitness apps diagrams pdf bundle. Topics like people use health and fitness apps can be discussed with this completely editable template. It is available for immediate download depending on the needs and requirements of the user.
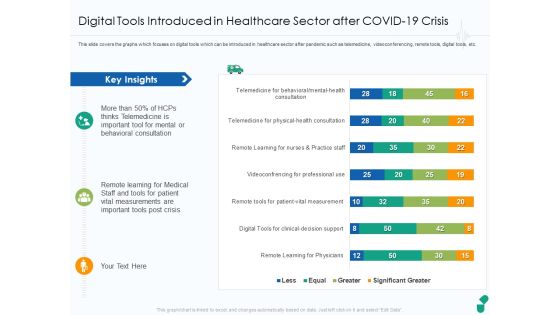
Digital Tools Introduced In Healthcare Sector After COVID 19 Crisis Ppt Outline Diagrams PDF
This slide covers the graphs which focuses on digital tools which can be introduced in healthcare sector after pandemic such as telemedicine, videoconferencing, remote tools, digital tools, etc. Deliver an awe-inspiring pitch with this creative digital tools introduced in healthcare sector after covid 19 crisis ppt outline diagrams pdf bundle. Topics like key insights, patient vital measurements, important tools post crisis, behavioral consultation can be discussed with this completely editable template. It is available for immediate download depending on the needs and requirements of the user.
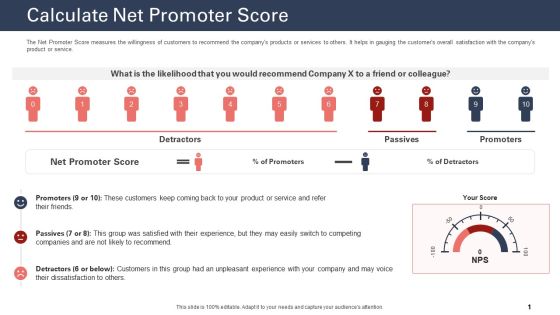
Techniques To Increase Customer Satisfaction Calculate Net Promoter Score Diagrams PDF
The Net Promoter Score measures the willingness of customers to recommend the companys products or services to others. It helps in gauging the customers overall satisfaction with the companys product or service. Deliver an awe inspiring pitch with this creative techniques to increase customer satisfaction calculate net promoter score diagrams pdf bundle. Topics like calculate net promoter score, product or service, net promoter score can be discussed with this completely editable template. It is available for immediate download depending on the needs and requirements of the user.
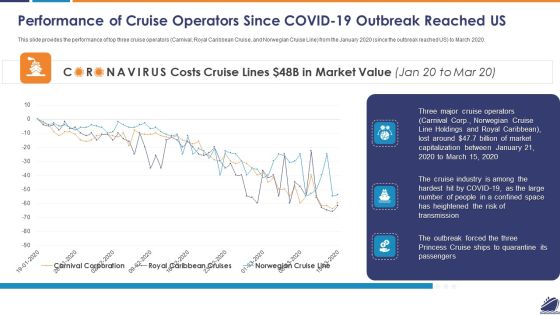
Performance Of Cruise Operators Since COVID 19 Outbreak Reached US Diagrams PDF
This slide provides the performance of top three cruise operators Carnival, Royal Caribbean Cruise, and Norwegian Cruise Line from the January 2020 since the outbreak reached US to March 2020. Deliver an awe inspiring pitch with this creative performance of cruise operators since covid 19 outbreak reached us diagrams pdf bundle. Topics like performance of cruise operators since covid 19 outbreak reached us can be discussed with this completely editable template. It is available for immediate download depending on the needs and requirements of the user.

Sales Department Strategies Increase Revenues Weekly Sales Performance Report Leads Diagrams PDF
The weekly sales reports helps in tracking companies and individuals sales performance and essential KPIs such as lead to opportunity ratio, lead conversion ratio, customer lifetime value. Deliver and pitch your topic in the best possible manner with this sales department strategies increase revenues weekly sales performance report leads diagrams pdf. Use them to share invaluable insights on lead to opportunity ratio, customer lifetime value and impress your audience. This template can be altered and modified as per your expectations. So, grab it now.

Problem And Solution 5 Fall In The Rate Of Net Promoter Score NPS Diagrams PDF
This slide shows the problem that the company is facing related to falling Net Promoter Score due to decreasing potential customer satisfaction rate and increasing loyalty issues. Also, some recommendations are provided to solve the problem. Deliver an awe-inspiring pitch with this creative problem and solution 5 fall in the rate of net promoter score nps diagrams pdf. bundle. Topics like net promoter score, 2017 to 2021 can be discussed with this completely editable template. It is available for immediate download depending on the needs and requirements of the user.

Total Numbers Of Visitor In The Zoo After Implementing Strategies Ppt Summary Diagrams PDF
This slide shows the forecasted total number of visitors in the ABC Zoo from the years 2020 to 2024. It shows the increase in the total visitors due to the successful implementation of the strategies.Deliver an awe-inspiring pitch with this creative total numbers of visitor in the zoo after implementing strategies ppt summary diagrams pdf. bundle. Topics like total number of visitors, 2020 to 2024 can be discussed with this completely editable template. It is available for immediate download depending on the needs and requirements of the user.

Estimated Customer Attrition Rate In IBN Outsourcing Company After Implementing Strategies Ppt Visual Aids Diagrams PDF
This slide shows a graph of decrease in level of Customer Satisfaction in IBN Outsourcing Company for past 5 years. Additionally, this slide provides information on some reasons High Response Time, Insufficient Knowledge with the Agent, Inability in Prioritizing Customer Requests etc. of fall in customer satisfaction level from 2017 to 2021.Deliver and pitch your topic in the best possible manner with this estimated customer attrition rate in ibn outsourcing company after implementing strategies ppt visual aids diagrams pdf. Use them to share invaluable insights on customer attrition rate, 2021 to 2025 and impress your audience. This template can be altered and modified as per your expectations. So, grab it now.

Customer Attrition Rate In IBN Outsourcing Company For 5 Years Ppt Styles Diagrams PDF
This slide shows an increase in the Customer Attrition Rate in IBN Outsourcing Company due to certain factors such as Poor Onboarding Procedures, Lack of Proactive Customer Support and Communication, increased product service bugginess due to use of outdated technologies etc. for a period of 5 years starting from 2017 to 2021. Deliver an awe inspiring pitch with this creative customer attrition rate in IBN outsourcing company for 5 years ppt styles diagrams pdf bundle. Topics like product bugginess, quality customer service, absence of proactive customer support, 2017 to 2021 can be discussed with this completely editable template. It is available for immediate download depending on the needs and requirements of the user.

Average Customer Queue Time In Ibn Outsourcing Company For 5 Years Diagrams PDF
This slide shows a graph of increase in Average Customer Queue Time in IBN Outsourcing Company for past 5 years. Additionally, this slide provides information on some reasons High Response Time, Insufficient Knowledge with the Agent, Inability in Prioritizing Customer Requests etc. of increased customer queue time from 2017 to 2021. Deliver an awe-inspiring pitch with this creative average customer queue time in ibn outsourcing company for 5 years diagrams pdf. bundle. Topics like average customer queue time in ibn outsourcing company for 5 years can be discussed with this completely editable template. It is available for immediate download depending on the needs and requirements of the user.

Operational Changes Done By The Restaurants For Their Survival Diagrams PDF
Mentioned slide provides information on the operational changes done by the restaurant operators in order to survive during the pandemic. Here the graph shows that 51 percentage of the restaurants re trained their staff to ensure food safety. Deliver an awe inspiring pitch with this creative operational changes done by the restaurants for their survival diagrams pdf bundle. Topics like business, services, key takeaways can be discussed with this completely editable template. It is available for immediate download depending on the needs and requirements of the user.

Amalgamation Marketing Pitch Deck Impact Of Choosing Right Mix Of Multi Channel Marketing Customer Diagrams PDF
This graph shows the impact of choosing right mix of multi channel marketing which leads to improved customer engagement, new customers, better website traffic, etc. Deliver and pitch your topic in the best possible manner with this amalgamation marketing pitch deck impact of choosing right mix of multi channel marketing customer diagrams pdf. Use them to share invaluable insights on engagement, website, traffic, revenue, referrals and impress your audience. This template can be altered and modified as per your expectations. So, grab it now.
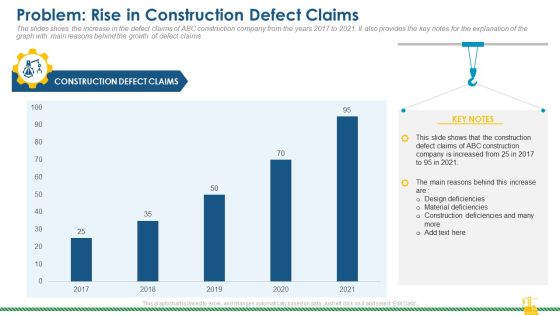
Rising Construction Defect Claims Against The Corporation Problem Rise In Construction Defect Claims Diagrams PDF
The slides shows the increase in the defect claims of ABC construction company from the years 2017 to 2021. It also provides the key notes for the explanation of the graph with main reasons behind the growth of defect claims. Deliver and pitch your topic in the best possible manner with this rising construction defect claims against the corporation problem rise in construction defect claims diagrams pdf. Use them to share invaluable insights on defect, claims, material deficiencies, design deficiencies and impress your audience. This template can be altered and modified as per your expectations. So, grab it now.
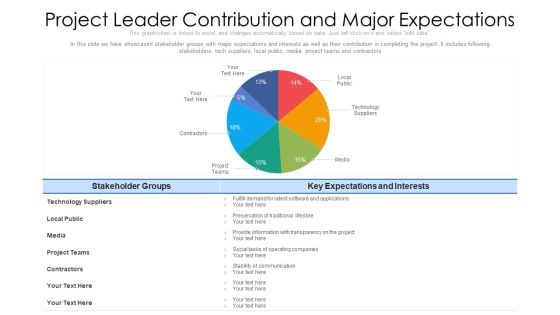
Project Leader Contribution And Major Expectations Ppt PowerPoint Presentation File Diagrams PDF
In this slide we have showcased stakeholder groups with major expectations and interests as well as their contribution in completing the project. It includes following stakeholders- tech suppliers, local public, media, project teams and contractors. Pitch your topic with ease and precision using this project leader contribution and major expectations ppt powerpoint presentation file diagrams pdf. This layout presents information on technology, media, contractors. It is also available for immediate download and adjustment. So, changes can be made in the color, design, graphics or any other component to create a unique layout.

Customer Relationship Strategy For Building Loyalty Identifying Customer Touch Points Diagrams PDF
This slide aims to identify key customer touch points to be optimized in order to gain leverage on company service delivery message. It alos covers key insights related to preferred customer touch points. Deliver an awe inspiring pitch with this creative customer relationship strategy for building loyalty identifying customer touch points diagrams pdf bundle. Topics like retailer website, internet search, brand website, social media can be discussed with this completely editable template. It is available for immediate download depending on the needs and requirements of the user.

Examination Of Buyer Mindset Towards Dairy Products Total Sales Of Dairy Products Worldwide Diagrams PDF
This slide shows total worldwide sales of dairy products, from the years 2018 to 2022. It shows the increase in sales of all dairy products Milk, Cheese, Yogurt, Flavored milk drinks, Other dairy products. Deliver and pitch your topic in the best possible manner with this examination of buyer mindset towards dairy products total sales of dairy products worldwide diagrams pdf. Use them to share invaluable insights on total sales of dairy products worldwide and impress your audience. This template can be altered and modified as per your expectations. So, grab it now.
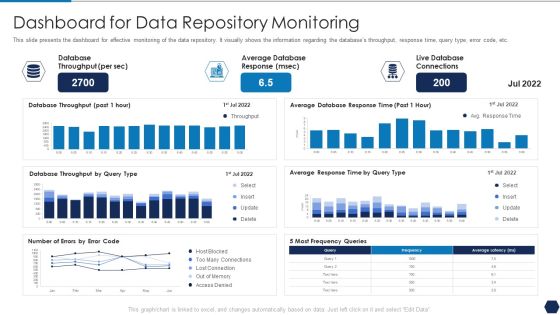
Tactical Plan For Upgrading DBMS Dashboard For Data Repository Monitoring Diagrams PDF
This slide presents the dashboard for effective monitoring of the data repository. It visually shows the information regarding the databases throughput, response time, query type, error code, etc. Deliver and pitch your topic in the best possible manner with this tactical plan for upgrading dbms dashboard for data repository monitoring diagrams pdf. Use them to share invaluable insights on database throughput, average database response, live database connections and impress your audience. This template can be altered and modified as per your expectations. So, grab it now.

Sequoia Company Capital Raising Elevator What Does The Market Competition Looks Like Diagrams PDF
The following slide displays the market competition as it highlights the Industry by its application along with the market share and the name of the market competitors. Deliver and pitch your topic in the best possible manner with this sequoia company capital raising elevator what does the market competition looks like diagrams pdf. Use them to share invaluable insights on enterprise, commercial, consumer, market share and impress your audience. This template can be altered and modified as per your expectations. So, grab it now.

Strategy To Improve Team Proficiency Team Performance Observation Dashboard Diagrams PDF
This slide provides an overview of statistics related to current team performance based on observation method selected in previous slide for data collection. It involves team conflict status, Planned vs actual project status, leadership status and communication gap status. Deliver an awe inspiring pitch with this creative proficiency team performance observation dashboard diagrams pdf bundle. Topics like team performance observation dashboard can be discussed with this completely editable template. It is available for immediate download depending on the needs and requirements of the user.
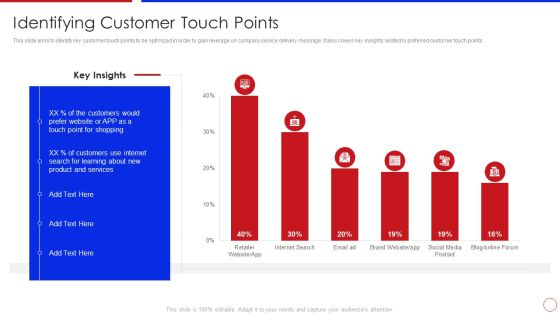
Strategy To Enhance Buyer Intimacy Identifying Customer Touch Points Ppt Infographics Diagrams PDF
This slide aims to identify key customer touch points to be optimized in order to gain leverage on company service delivery message. It alos covers key insights related to preferred customer touch points. Deliver and pitch your topic in the best possible manner with this strategy to enhance buyer intimacy identifying customer touch points ppt infographics diagrams pdf. Use them to share invaluable insights on identifying customer touch points and impress your audience. This template can be altered and modified as per your expectations. So, grab it now.
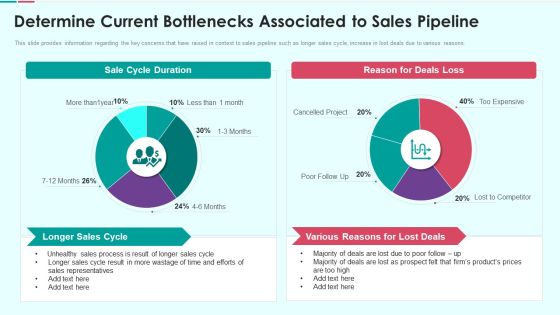
Sales Funnel Management For Revenue Generation Determine Current Bottlenecks Diagrams PDF
This slide provides information regarding the key concerns that have raised in context to sales pipeline such as longer sales cycle, increase in lost deals due to various reasons. Deliver and pitch your topic in the best possible manner with this sales funnel management for revenue generation determine current bottlenecks diagrams pdf Use them to share invaluable insights on longer sales cycle, various reasons for lost deals, sales representatives and impress your audience. This template can be altered and modified as per your expectations. So, grab it now.
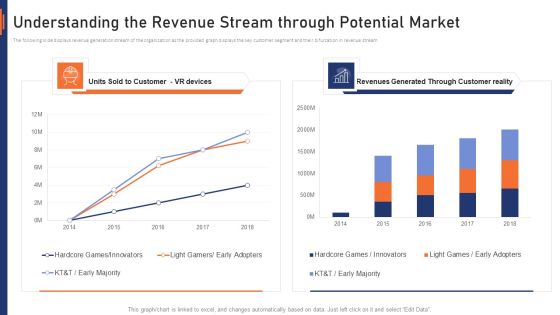
VR Market Capital Raising Elevator Pitch Deck Understanding The Revenue Stream Through Potential Market Diagrams PDF
The following slide displays revenue generation stream of the organization as the provided graph displays the key customer segment and their bifurcation in revenue stream. Deliver and pitch your topic in the best possible manner with this vr market capital raising elevator pitch deck understanding the revenue stream through potential market diagrams pdf. Use them to share invaluable insights on understanding the revenue stream through potential market and impress your audience. This template can be altered and modified as per your expectations. So, grab it now.

Enhancing Stp Strategies For A Successful Market Promotion Kpi Dashboard To Monitor Diagrams PDF
Mentioned slide shows the KPI dashboard that can be used to track win and lost sales opportunities. It includes metrics namely won opportunities, lost opportunities, pipeline by territory, total opportunities. Deliver and pitch your topic in the best possible manner with this enhancing stp strategies for a successful market promotion kpi dashboard to monitor diagrams pdf. Use them to share invaluable insights on kpi dashboard to monitor sales opportunities and impress your audience. This template can be altered and modified as per your expectations. So, grab it now.
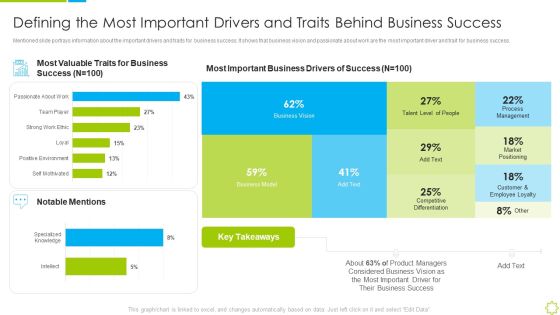
Launch New Sales Enablement Program Lead Generation Defining The Most Important Drivers Diagrams PDF
Mentioned slide portrays information about the important drivers and traits for business success. It shows that business vision and passionate about work are the most important driver and trait for business success. Deliver an awe inspiring pitch with this creative launch new sales enablement program lead generation defining the most important drivers diagrams pdf bundle. Topics like defining the most important drivers and traits behind business success can be discussed with this completely editable template. It is available for immediate download depending on the needs and requirements of the user.

Application Patient Satisfaction Tactics Enhance Clinical Results Current Patient Satisfaction Status Diagrams PDF
This slide shows the current Patient Satisfaction Status at the medical facility. This slide shows the percentage of patients that are satisfied and percentage that are dissatisfied at a medical facility due to various reasons. Deliver an awe inspiring pitch with this creative application patient satisfaction tactics enhance clinical results current patient satisfaction status diagrams pdf bundle. Topics like current patient satisfaction status at the medical facility can be discussed with this completely editable template. It is available for immediate download depending on the needs and requirements of the user.
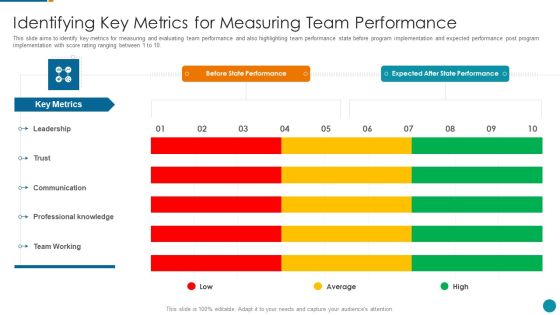
Strategic Procedure To Improve Employee Efficiency Identifying Key Metrics For Measuring Diagrams PDF
This slide aims to identify key metrics for measuring and evaluating team performance and also highlighting team performance state before program implementation and expected performance post program implementation with score rating ranging between 1 to 10.Deliver and pitch your topic in the best possible manner with this strategic procedure to improve employee efficiency identifying key metrics for measuring diagrams pdf Use them to share invaluable insights on expected after state performance, professional knowledge, communication and impress your audience. This template can be altered and modified as per your expectations. So, grab it now.
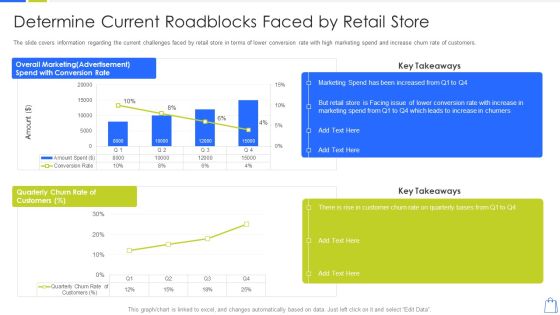
Redefining Experiential Retail Marketing Determine Current Roadblocks Faced By Retail Store Diagrams PDF
The slide covers information regarding the current challenges faced by retail store in terms of lower conversion rate with high marketing spend and increase churn rate of customers. Deliver and pitch your topic in the best possible manner with this redefining experiential retail marketing determine current roadblocks faced by retail store diagrams pdf. Use them to share invaluable insights on determine current roadblocks faced by retail store and impress your audience. This template can be altered and modified as per your expectations. So, grab it now.

Customer Rapport Strategy To Build Loyal Client Base Customer Service Dashboard Diagrams PDF
This slide majorly aims to provide insights about the impact of customer intimacy strategy on customer service quality. It shows complaint ticket status, customer happiness ratings, and average traffic analysis etc. Deliver and pitch your topic in the best possible manner with this customer rapport strategy to build loyal client base customer service dashboard diagrams pdf. Use them to share invaluable insights on customer service dashboard and impress your audience. This template can be altered and modified as per your expectations. So, grab it now.

Analyzing The Impact Of Russia Ukraine Conflict On Gas Sector Russian Invasion Impact Diagrams PDF
The following slide represents impact of Russian Ukrainian gas war tensions on USA. It provides information about gasoline prices, gas production, demands, sanctions, ban, etc. Deliver and pitch your topic in the best possible manner with this analyzing the impact of russia ukraine conflict on gas sector russian invasion impact diagrams pdf. Use them to share invaluable insights on russian invasion impact on united states of america and impress your audience. This template can be altered and modified as per your expectations. So, grab it now.

Call Center Application Market Industry Top Market Players In Contact Center Software Market Industry Diagrams PDF
The following slide shows the major top players of the Contact Center Software Market Industry across globe along with their relative market share in percentage. Deliver an awe inspiring pitch with this creative call center application market industry top market players in contact center software market industry diagrams pdf bundle. Topics like top market players in contact center software market industry can be discussed with this completely editable template. It is available for immediate download depending on the needs and requirements of the user.

Mixpanel Capital Raising Pitch Deck Mixpanel Cultural Statistics Topics PDF Diagrams PDF
This slide shows the cultural statistics of Mixpanel in term of ratings related to overall work culture, CEO score, compensation, retention, office culture, environment, executive team, NPS Net Promoter Score etc. Deliver an awe inspiring pitch with this creative mixpanel capital raising pitch deck mixpanel cultural statistics topics pdf diagrams pdf bundle. Topics like office culture, retention, executive team, work culture, environment can be discussed with this completely editable template. It is available for immediate download depending on the needs and requirements of the user.
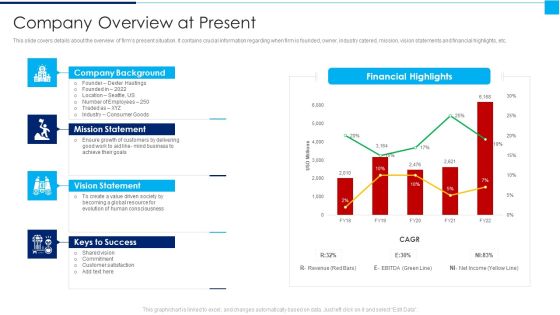
Ways To Enhance Organizations Profitability Company Overview At Present Diagrams PDF
This slide covers details about the overview of firms present situation. It contains crucial information regarding when firm is founded, owner, industry catered, mission, vision statements and financial highlights, etc. Deliver and pitch your topic in the best possible manner with this ways to enhance organizations profitability company overview at present diagrams pdf Use them to share invaluable insights on mission statement, vision statement, keys to success and impress your audience. This template can be altered and modified as per your expectations. So, grab it now.
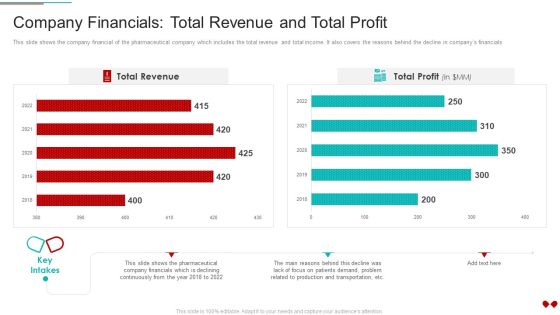
Environmental Impact Analysis For A Pharmaceutical Company Financials Total Revenue And Total Profit Diagrams PDF
This slide shows the company financial of the pharmaceutical company which includes the total revenue and total income. It also covers the reasons behind the decline in companys financialsDeliver an awe inspiring pitch with this creative Environmental Impact Analysis For A Pharmaceutical Company Financials Total Revenue And Total Profit Diagrams PDF bundle. Topics like Company Financials Total Revenue And Total Profit can be discussed with this completely editable template. It is available for immediate download depending on the needs and requirements of the user.

Russia Ukraine Conflict Effect Impact Of Higher Container Freight Rates On Products Diagrams PDF
This slide highlights the higher container freight rates impacts on consumer prices which includes electronic products, furniture, textile, leather, rubber and plastic products, pharma products and fabricated metals. Deliver an awe inspiring pitch with this creative Russia Ukraine Conflict Effect Impact Of Higher Container Freight Rates On Products Diagrams PDF bundle. Topics like Impact On Commodities Price, Consumer Price Increases, Ocean Freight Rate, Prices Of Consumer can be discussed with this completely editable template. It is available for immediate download depending on the needs and requirements of the user.
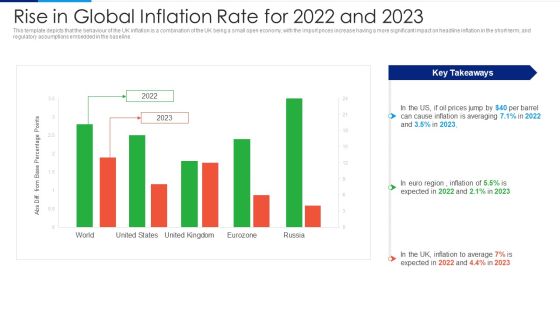
Russia Ukraine Conflict Effect Rise In Global Inflation Rate For 2022 And 2023 Diagrams PDF
This template depicts that the behaviour of the UK inflation is a combination of the UK being a small open economy, with the import prices increase having a more significant impact on headline inflation in the short-term, and regulatory assumptions embedded in the baseline. Deliver and pitch your topic in the best possible manner with this Russia Ukraine Conflict Effect Rise In Global Inflation Rate For 2022 And 2023 Diagrams PDF. Use them to share invaluable insights on Inflation To Average, 2022 To 2023, Abs Diff From Base Percentage Points and impress your audience. This template can be altered and modified as per your expectations. So, grab it now.

Innovation Procedure For Online Business Market Scenario And Disruption In Business Diagrams PDF
The following slide illustrates market scenario and business disruption for digital transformation industry. The following slide displays the adoption rate of digital transformation, key issues in the Industry and solution for major problems in Industry. Deliver and pitch your topic in the best possible manner with this Innovation Procedure For Online Business Market Scenario And Disruption In Business Diagrams PDF Use them to share invaluable insights on Key Industries, Solution Digital Transformation, Organizations Dependent and impress your audience. This template can be altered and modified as per your expectations. So, grab it now.

Influence Buyers To Purchase Additional High Company Financials After The Implementation Diagrams PDF
This slide shows the forecasted company financials after the implementation of upsell strategy total Revenue and Total Profits for the last five years from 2021 to 2025 along with the key notes.Deliver an awe inspiring pitch with this creative Influence Buyers To Purchase Additional High Company Financials After The Implementation Diagrams PDF bundle. Topics like Company Financials After The Implementation Of Upsell Strategy can be discussed with this completely editable template. It is available for immediate download depending on the needs and requirements of the user.
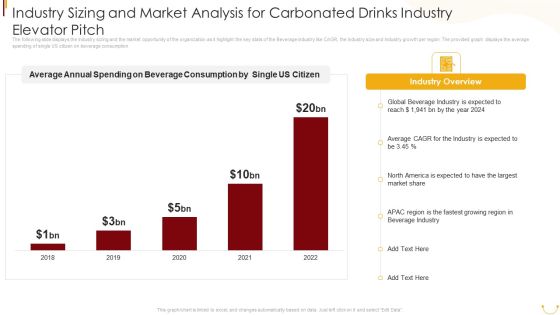
Industry Sizing And Market Analysis For Carbonated Drinks Industry Elevator Pitch Diagrams PDF
The following slide displays the Industry sizing and the market opportunity of the organization as it highlight the key stats of the Beverage industry like CAGR, the Industry size and Industry growth per region. The provided graph displays the average spending of single US citizen on beverage consumption. Deliver and pitch your topic in the best possible manner with this Industry Sizing And Market Analysis For Carbonated Drinks Industry Elevator Pitch Diagrams PDF. Use them to share invaluable insights on Average Annual Spending, Beverage Consumption, Single US Citizen, Global Beverage Industry, 2018 To 2022 and impress your audience. This template can be altered and modified as per your expectations. So, grab it now.

Insurance Company Business Plan Addressing Market Assessment For Insurance Business Diagrams PDF
This slide covers information regarding market assessment of insurance business with high competition existing. It covers details about key players and market share associated to top players. Deliver and pitch your topic in the best possible manner with this Insurance Company Business Plan Addressing Market Assessment For Insurance Business Diagrams PDF Use them to share invaluable insights on America Insurance, General Insurance, Local Competition Includes and impress your audience. This template can be altered and modified as per your expectations. So, grab it now.

Shoe Firm Investor Pitch Deck Year On Year Market Growth In Percentage Diagrams PDF
This slide shows the year-on year market growth of footwear and accessories industry. This includes percentage of market growth in different locations worldwide such as Chinese market, USA market, Global Market, etc. Deliver an awe inspiring pitch with this creative Shoe Firm Investor Pitch Deck Year On Year Market Growth In Percentage Diagrams PDF bundle. Topics like Market Growth, Accessories Industry, Global Merket can be discussed with this completely editable template. It is available for immediate download depending on the needs and requirements of the user.
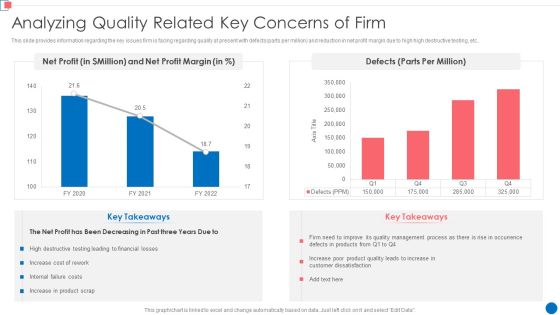
Optimize Enterprise Core Analyzing Quality Related Key Concerns Of Firm Diagrams PDF
This slide provides information regarding the key issues firm is facing regarding quality at present with defects parts per million and reduction in net profit margin due to high high destructive testing, etc. Deliver an awe inspiring pitch with this creative Optimize Enterprise Core Analyzing Quality Related Key Concerns Of Firm Diagrams PDF bundle. Topics like Net Profit, Net Profit Margin, 2020 To 2022 can be discussed with this completely editable template. It is available for immediate download depending on the needs and requirements of the user.

Digital Marketing Agency Business Profile Revenue And Net Profit Diagrams PDF
This slide highlights the revenue and net profit of digital marketing agency through bar graph and tabular format. It covers three years data of revenue, gross margin and net profit. Deliver and pitch your topic in the best possible manner with this Digital Marketing Agency Business Profile Revenue And Net Profit Diagrams PDF. Use them to share invaluable insights on Increase In Revenue, Growth Rate, Net Profit and impress your audience. This template can be altered and modified as per your expectations. So, grab it now.

Creating Successful Strategies To Enhance Customer Experience Firm Focusing On Optimizing Digital Diagrams PDF
This slide focuses on firm focusing on optimizing digital customer experience that shows rate of overall customer experience and engagement quality with company today and in next three years.Deliver and pitch your topic in the best possible manner with this Creating Successful Strategies To Enhance Customer Experience Firm Focusing On Optimizing Digital Diagrams PDF Use them to share invaluable insights on Experience And Engagement, Improving Product, Customers Excellent and impress your audience. This template can be altered and modified as per your expectations. So, grab it now.
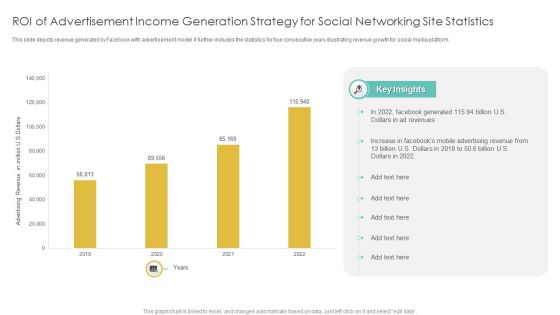
Roi Of Advertisement Income Generation Strategy For Social Networking Site Statistics Diagrams PDF
This slide depicts revenue generated by Facebook with advertisement model. It further includes the statistics for four consecutive years illustrating revenue growth for social media platform. Pitch your topic with ease and precision using this Roi Of Advertisement Income Generation Strategy For Social Networking Site Statistics Diagrams PDF. This layout presents information on Advertisement Income, Generation Strategy, Social Networking Site Statistics. It is also available for immediate download and adjustment. So, changes can be made in the color, design, graphics or any other component to create a unique layout.

Knowledge Process Outsourcing Company Profile Revenue And Profit Of Call Centers Diagrams PDF
This slide highlights the revenue and profit of call center company through bar graph format which includes data from last 5 years from financial year 2018 to 2022.Deliver and pitch your topic in the best possible manner with this Knowledge Process Outsourcing Company Profile Revenue And Profit Of Call Centers Diagrams PDF. Use them to share invaluable insights on Revenue Increased, Profit Increased, Key Takeaways and impress your audience. This template can be altered and modified as per your expectations. So, grab it now.

Strategic Brand Management Brand Asset Valuator Power Grid To Assess Overall Health Diagrams PDF
This slide provides information regarding brand asset valuator power grid to analyze overall brand health. It caters details about new, unfocused, eroding, power, declining or niche brands. Deliver and pitch your topic in the best possible manner with this Strategic Brand Management Brand Asset Valuator Power Grid To Assess Overall Health Diagrams PDF. Use them to share invaluable insights on Brand Vitality, Brand Stature, Declining Brands, Eroding Brands and impress your audience. This template can be altered and modified as per your expectations. So, grab it now.

Digital Risk Assessment Key Metrics Monitoring Dashboard Ppt Ideas Diagrams PDF
The following slide highlights the cyber security key metrics monitoring dashboard illustrating critical applications, mission critical, other regulations, SOX, key metrics, controls, audits and cyber security training compliance. Showcasing this set of slides titled Digital Risk Assessment Key Metrics Monitoring Dashboard Ppt Ideas Diagrams PDF. The topics addressed in these templates are Critical Applications, Mission Critical, Other Regulation. All the content presented in this PPT design is completely editable. Download it and make adjustments in color, background, font etc. as per your unique business setting.

Tour And Travels Agency Profile Revenue Split By Geography And Tours Diagrams PDF
This slide shows the revenue split by geography which represents highest revenue from South Africa region and type of tours such as educational, adventure, culture, MICE tours, etc.Deliver and pitch your topic in the best possible manner with this Tour And Travels Agency Profile Revenue Split By Geography And Tours Diagrams PDF. Use them to share invaluable insights on Revenue Generated, America Region, Such As Meetings and impress your audience. This template can be altered and modified as per your expectations. So, grab it now.
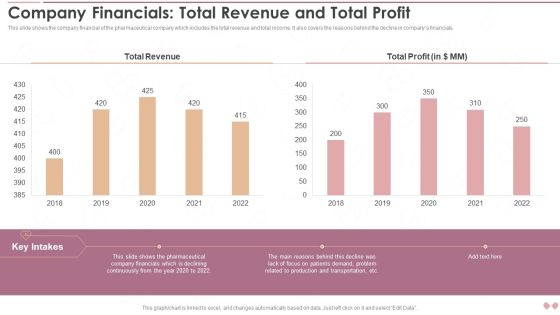
Innovative Business Model Of Pharmaceutical Company Financials Total Revenue And Total Profit Diagrams PDF
This slide shows the key impacts of the strategies on companys operations. It includes operational and environmental impacts such as accurate demand forecasting, reward research and development etc.Deliver and pitch your topic in the best possible manner with this Innovative Business Model Of Pharmaceutical Company Financials Total Revenue And Total Profit Diagrams PDF. Use them to share invaluable insights on Total Revenue, Total Profit, Related Production and impress your audience. This template can be altered and modified as per your expectations. So, grab it now.

ETL Repository Effect On The Organization After Implementation Ppt PowerPoint Presentation Portfolio Diagrams PDF
Here we have shown the effect of implementing data management solutions in the organization such as marketing targets are being met on time, customer journey analysis has been improved with the help of data management. Deliver an awe inspiring pitch with this creative ETL Repository Effect On The Organization After Implementation Ppt PowerPoint Presentation Portfolio Diagrams PDF bundle. Topics like Market Research, Account Based, Sales Attributed can be discussed with this completely editable template. It is available for immediate download depending on the needs and requirements of the user.
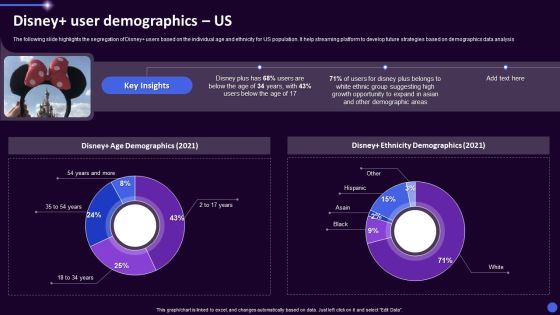
Disney Plus OTT Platform Company Summary Disney User Demographics Us Ppt Gallery Diagrams PDF
The following slide highlights the segregation of Disney users based on the individual age and ethnicity for US population. It help streaming platform to develop future strategies based on demographics data analysis. Deliver an awe inspiring pitch with this creative Disney Plus OTT Platform Company Summary Disney User Demographics Us Ppt Gallery Diagrams PDF bundle. Topics like Disney Ethnicity Demographics, Disney Age Demographics, 2021 can be discussed with this completely editable template. It is available for immediate download depending on the needs and requirements of the user.

SAC Planning And Implementation Major Users Of SAP Analytics Cloud Suite Diagrams PDF
The following slide illustrates the major user of SAP Analytics Cloud suite which are business users and business intelligence seekers. It also contains details regarding the usage statistics of both the users. Deliver an awe inspiring pitch with this creative SAC Planning And Implementation Major Users Of SAP Analytics Cloud Suite Diagrams PDF bundle. Topics like Executives, Casuals, Business Intelligence Seekers, Data Scientist can be discussed with this completely editable template. It is available for immediate download depending on the needs and requirements of the user.

B2B Sales Techniques Playbook Sales Management Activities Tracking Dashboard Diagrams PDF
This slide provides information regarding sales management activities tracking dashboard to measure closed business, sales pipeline, sales activity by sales rep, month over month growth, forecast by month, etc. Deliver and pitch your topic in the best possible manner with this B2B Sales Techniques Playbook Sales Management Activities Tracking Dashboard Diagrams PDF. Use them to share invaluable insights on Sales Pipeline, Sales Activity, Sales Pipeline and impress your audience. This template can be altered and modified as per your expectations. So, grab it now.
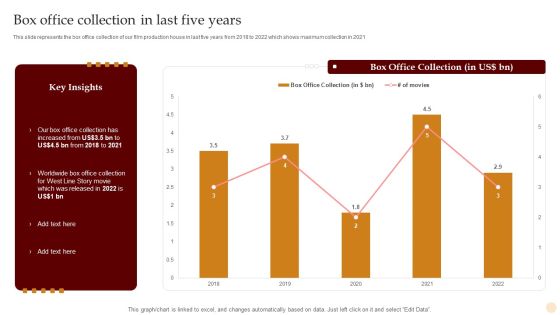
Motion Pictures Production Company Profile Box Office Collection In Last Five Years Diagrams PDF
This slide represents the box office collection of our film production house in last five years from 2018 to 2022 which shows maximum collection in 2021. Deliver and pitch your topic in the best possible manner with this Motion Pictures Production Company Profile Box Office Collection In Last Five Years Diagrams PDF. Use them to share invaluable insights on Box Office Collection, 2018 To 2022 and impress your audience. This template can be altered and modified as per your expectations. So, grab it now.
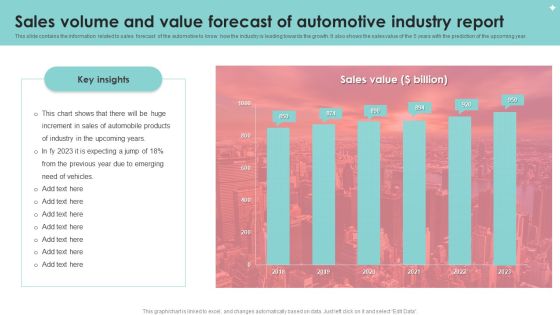
Sales Volume And Value Forecast Of Automotive Industry Report Diagrams PDF
This slide contains the information related to sales forecast of the automotive to know how the industry is leading towards the growth. It also shows the sales value of the 5 years with the prediction of the upcoming year. Showcasing this set of slides titled Sales Volume And Value Forecast Of Automotive Industry Report Diagrams PDF. The topics addressed in these templates are Sales Volume, Value Forecast, Automotive Industry Report. All the content presented in this PPT design is completely editable. Download it and make adjustments in color, background, font etc. as per your unique business setting.

Insider Threat In Cyber Security Detection And Prevention Dashboard Diagrams PDF
This slide shows dashboard for detecting and preventing insider threats. It provides details about antivirus, vector detection, patch, admin access, email security, network and endpoint threat, etc. Pitch your topic with ease and precision using this Insider Threat In Cyber Security Detection And Prevention Dashboard Diagrams PDF. This layout presents information on Active Clients, Network Threat Prevention, Endpoint Threat Prevention. It is also available for immediate download and adjustment. So, changes can be made in the color, design, graphics or any other component to create a unique layout.

Company Top Consulting Projects Progress Status Report Comparison Summary Diagrams PDF
The following slide showcases the status of two projects of a consulting services firm. The slide covers new, opened, in progress, completed and projects kept on hold. Pitch your topic with ease and precision using this Company Top Consulting Projects Progress Status Report Comparison Summary Diagrams PDF. This layout presents information on Company Top Consulting Projects Progress, Status Report Comparison Summary. It is also available for immediate download and adjustment. So, changes can be made in the color, design, graphics or any other component to create a unique layout.
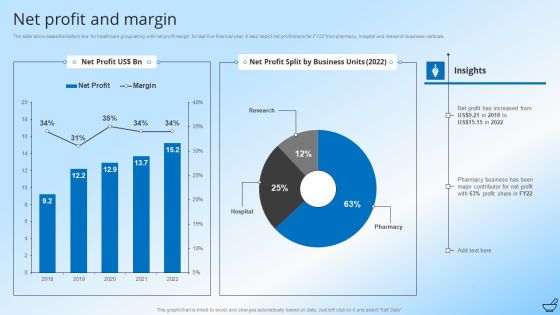
Pharmaceutical And Clinical Research Summary Net Profit And Margin Diagrams PDF
The slide showcases the bottom line for healthcare group along with net profit margin for last five financial year. It also depict net profit share for FY22 from pharmacy, hospital and research business verticals. Deliver an awe inspiring pitch with this creative Pharmaceutical And Clinical Research Summary Net Profit And Margin Diagrams PDF bundle. Topics like Pharmacy Business, Profit Share, Business Units can be discussed with this completely editable template. It is available for immediate download depending on the needs and requirements of the user.
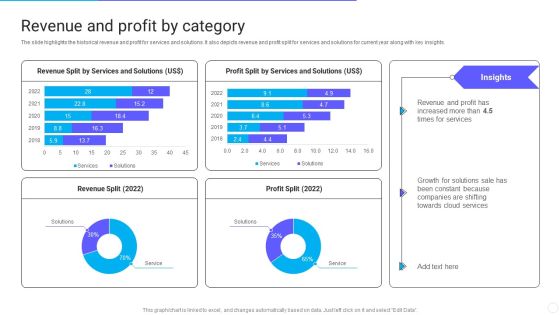
IT Application Services Company Outline Revenue And Profit By Category Diagrams PDF
The slide highlights the historical revenue and profit for services and solutions. It also depicts revenue and profit split for services and solutions for current year along with key insights. Deliver and pitch your topic in the best possible manner with this IT Application Services Company Outline Revenue And Profit By Category Diagrams PDF. Use them to share invaluable insights on Revenue Split, Profit Split, Services and impress your audience. This template can be altered and modified as per your expectations. So, grab it now.

Merger And Acquisition Buying Strategy For Business Growth Overview Of The Target Companys Operations Diagrams PDF
This slide gives an overview of the target companys operations. For the last five years, a business summary contains a firm introduction, mission and vision statement, financial highlights, and non performing assets. Deliver and pitch your topic in the best possible manner with this Merger And Acquisition Buying Strategy For Business Growth Overview Of The Target Companys Operations Diagrams PDF. Use them to share invaluable insights on Customers, Financial Highlights, Enterprises and impress your audience. This template can be altered and modified as per your expectations. So, grab it now.

Strategic Management Consultancy Business Profile Revenue Split By Geography And Business Areas Diagrams PDF
This slide showcases the revenue breakdown by geography such as Asia, North America, Australia, etc. It also covers business areas revenue split such as management consulting, IT consulting, etc. Deliver and pitch your topic in the best possible manner with this Strategic Management Consultancy Business Profile Revenue Split By Geography And Business Areas Diagrams PDF. Use them to share invaluable insights on Demand For Management, Consulting Services, Revenue and impress your audience. This template can be altered and modified as per your expectations. So, grab it now.

Buy Side Merger And Acquisition Pitch Book Overview Of The Target Companys Operations Diagrams PDF
This slide gives an overview of the target companys operations. For the last five years, a business summary contains a firm introduction, mission and vision statement, financial highlights, and non performing assets. Deliver and pitch your topic in the best possible manner with this Buy Side Merger And Acquisition Pitch Book Overview Of The Target Companys Operations Diagrams PDF. Use them to share invaluable insights on Financial Highlights, Enterprises, Customers and impress your audience. This template can be altered and modified as per your expectations. So, grab it now.
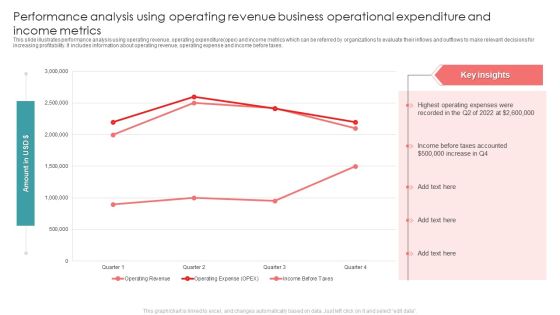
Performance Analysis Using Operating Revenue Business Operational Expenditure And Income Metrics Diagrams PDF
This slide illustrates performance analysis using operating revenue, operating expenditure opex and income metrics which can be referred by organizations to evaluate their inflows and outflows to make relevant decisions for increasing profitability. It includes information about operating revenue, operating expense and income before taxes. Pitch your topic with ease and precision using this Performance Analysis Using Operating Revenue Business Operational Expenditure And Income Metrics Diagrams PDF. This layout presents information on Taxes, Highest Operating, Recorded. It is also available for immediate download and adjustment. So, changes can be made in the color, design, graphics or any other component to create a unique layout.

COVID Impact Analysis On Food And Transportation Industry Ppt Infographic Template Diagrams PDF
This slide depicts impact of COVID-19 on multiple services of travel and tourism industry. It includes operations such as food services, lodging, air transportation, retail, recreation and amusement. Showcasing this set of slides titled COVID Impact Analysis On Food And Transportation Industry Ppt Infographic Template Diagrams PDF. The topics addressed in these templates are Food Services, Air Transportation Faced, Restrictions Travel Policy. All the content presented in this PPT design is completely editable. Download it and make adjustments in color, background, font etc. as per your unique business setting.

Impact On Customers Due To Poor Product Pricing Strategy Pricing Strategies For New Diagrams PDF
This template covers the high customer churn rate in the company due to poor product pricing strategy involved within the organization.Present like a pro with Impact On Customers Due To Poor Product Pricing Strategy Pricing Strategies For New Diagrams PDF Create beautiful presentations together with your team, using our easy-to-use presentation slides. Share your ideas in real-time and make changes on the fly by downloading our templates. So whether you are in the office, on the go, or in a remote location, you can stay in sync with your team and present your ideas with confidence. With Slidegeeks presentation got a whole lot easier. Grab these presentations today.
