Analytics Dashboard

Automating Key Activities Of HR Manager Dashboard Depicting HR Analytics Of Organization Themes PDF
This slide shows the dashboard that depicts total number of employees including permanent, fixed contract and temporary with business unit distribution.Deliver an awe inspiring pitch with this creative Automating Key Activities Of HR Manager Dashboard Depicting HR Analytics Of Organization Themes PDF bundle. Topics like Business Distribution, Deliverance Team, Administration can be discussed with this completely editable template. It is available for immediate download depending on the needs and requirements of the user.

Human Resource Digital Transformation Dashboard Depicting HR Analytics Of Organization Designs PDF
This slide shows the dashboard that depicts total number of employees including permanent, fixed contract and temporary with business unit distribution. Deliver an awe inspiring pitch with this creative Human Resource Digital Transformation Dashboard Depicting HR Analytics Of Organization Designs PDF bundle. Topics like Business Unit Distribution, Temporary, Fixed Contract, Permanent can be discussed with this completely editable template. It is available for immediate download depending on the needs and requirements of the user.

RPA In HR Operations Dashboard Depicting HR Analytics Of Organization Clipart PDF
This slide shows the dashboard that depicts total number of employees including permanent, fixed contract and temporary with business unit distribution.Deliver and pitch your topic in the best possible manner with this RPA In HR Operations Dashboard Depicting HR Analytics Of Organization Clipart PDF. Use them to share invaluable insights on Unit Distribution, Business Unit, Administration and impress your audience. This template can be altered and modified as per your expectations. So, grab it now.

Developing HR Process Flow Dashboard Depicting HR Analytics Of Organization Clipart PDF
This slide shows the dashboard that depicts total number of employees including permanent, fixed contract and temporary with business unit distribution.Deliver an awe inspiring pitch with this creative Developing HR Process Flow Dashboard Depicting HR Analytics Of Organization Clipart PDF bundle. Topics like Business Distribution, Deliverance Team, Administration can be discussed with this completely editable template. It is available for immediate download depending on the needs and requirements of the user.

Tools For HR Business Analytics Workforce Performance Analysis KPI Dashboard Pictures PDF
This slide represents the dashboard representing key metrics to analyze the performance of overall workforce. It includes details related to absence rate, benefits satisfaction, engagement index etc. Here you can discover an assortment of the finest PowerPoint and Google Slides templates. With these templates, you can create presentations for a variety of purposes while simultaneously providing your audience with an eye-catching visual experience. Download Tools For HR Business Analytics Workforce Performance Analysis KPI Dashboard Pictures PDF to deliver an impeccable presentation. These templates will make your job of preparing presentations much quicker, yet still, maintain a high level of quality. Slidegeeks has experienced researchers who prepare these templates and write high-quality content for you. Later on, you can personalize the content by editing the Tools For HR Business Analytics Workforce Performance Analysis KPI Dashboard Pictures PDF.

Landing Page Leads And Revenue Generation Analytics For User Experience Optimization Dashboard Formats PDF
This slide covers website analytics based on revenue earned. It also included leads generated, bounce rates, customer churn stats, annual and monthly recurring revenue, etc. Pitch your topic with ease and precision using this Landing Page Leads And Revenue Generation Analytics For User Experience Optimization Dashboard Formats PDF. This layout presents information on Monthly Recurring Revenue, Bounce Rate, Gross Volume. It is also available for immediate download and adjustment. So, changes can be made in the color, design, graphics or any other component to create a unique layout.
Online Marketing Analytics To Enhance Business Growth Dashboard For Tracking Business Blog Kpis Template PDF
This slide covers the dashboard for analyzing blogging KPIs such as performance, published posts, views, new blog subscribers, top blog posts by pageviews, top blog posts by CTR, etc. Slidegeeks is one of the best resources for PowerPoint templates. You can download easily and regulate Online Marketing Analytics To Enhance Business Growth Dashboard For Tracking Business Blog Kpis Template PDF for your personal presentations from our wonderful collection. A few clicks is all it takes to discover and get the most relevant and appropriate templates. Use our Templates to add a unique zing and appeal to your presentation and meetings. All the slides are easy to edit and you can use them even for advertisement purposes.
Optimizing Marketing Analytics To Enhance Organizational Growth Dashboard For Tracking Business Designs PDF
This slide covers the dashboard for analyzing blogging KPIs such as performance, published posts, views, new blog subscribers, top blog posts by pageviews, top blog posts by CTR, etc. Do you know about Slidesgeeks Optimizing Marketing Analytics To Enhance Organizational Growth Dashboard For Tracking Business Designs PDF These are perfect for delivering any kind od presentation. Using it, create PowerPoint presentations that communicate your ideas and engage audiences. Save time and effort by using our pre designed presentation templates that are perfect for a wide range of topic. Our vast selection of designs covers a range of styles, from creative to business, and are all highly customizable and easy to edit. Download as a PowerPoint template or use them as Google Slides themes.
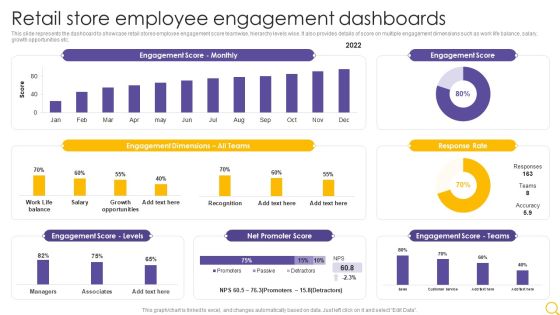
Retail Outlet Operational Efficiency Analytics Retail Store Employee Engagement Dashboards Sample PDF
This slide represents the dashboard to showcase retail stores employee engagement score teamwise, hierarchy levels wise. It also provides details of score on multiple engagement dimensions such as work life balance, salary, growth opportunities etc. Deliver an awe inspiring pitch with this creative Retail Outlet Operational Efficiency Analytics Retail Store Employee Engagement Dashboards Sample PDF bundle. Topics like Engagement Score Monthly, Engagement Dimensions, Engagement Score Levels can be discussed with this completely editable template. It is available for immediate download depending on the needs and requirements of the user.

Iot Digital Twin Technology Post Covid Expenditure Management Healthcare Dashboard Showing Analytical Data Brochure PDF
This slide shows the healthcare dashboard that presents analytical data such as occupancy, patient turnover, efficiency and costs, satisfaction and service indicators. Deliver an awe inspiring pitch with this creative iot digital twin technology post covid expenditure management healthcare dashboard showing analytical data brochure pdf bundle. Topics like service, indicators, cost, appointments, turnover can be discussed with this completely editable template. It is available for immediate download depending on the needs and requirements of the user.
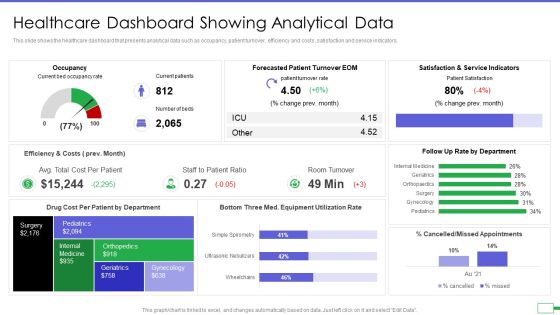
Iot And Digital Twin To Reduce Costs Post Covid Healthcare Dashboard Showing Analytical Data Elements PDF
This slide shows the healthcare dashboard that presents analytical data such as occupancy, patient turnover, efficiency and costs, satisfaction and service indicators. Deliver and pitch your topic in the best possible manner with this iot and digital twin to reduce costs post covid healthcare dashboard showing analytical data elements pdf. Use them to share invaluable insights on occupancy, patient turnover, efficiency and costs, satisfaction and service indicators and impress your audience. This template can be altered and modified as per your expectations. So, grab it now.
Developing Business Analytics Framework Tracking Intelligence Infrastructure Activities Dashboard Brochure PDF
This slide portrays information regarding tracking essential activities in intelligence infrastructure dashboard in terms of IT operations, security, business analytics, internet of things, etc. Deliver an awe inspiring pitch with this creative Developing Business Analytics Framework Tracking Intelligence Infrastructure Activities Dashboard Brochure PDF bundle. Topics like Application Delivery, Business Analytics, Internet Of Things can be discussed with this completely editable template. It is available for immediate download depending on the needs and requirements of the user.
Service Level Agreement KPI Dashboard With Graph And Analytics Icon Inspiration PDF
Persuade your audience using this Service Level Agreement KPI Dashboard With Graph And Analytics Icon Inspiration PDF. This PPT design covers three stages, thus making it a great tool to use. It also caters to a variety of topics including Service Level, Agreement KPI Dashboard, Graph And Analytics, Icon. Download this PPT design now to present a convincing pitch that not only emphasizes the topic but also showcases your presentation skills.
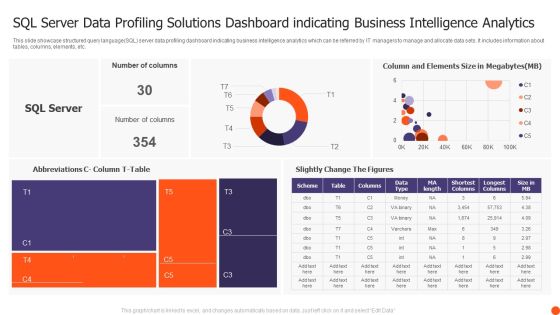
SQL Server Data Profiling Solutions Dashboard Indicating Business Intelligence Analytics Structure PDF
This slide showcase structured query language SQL server data profiling dashboard indicating business intelligence analytics which can be referred by IT managers to manage and allocate data sets. It includes information about tables, columns, elements, etc. Showcasing this set of slides titled SQL Server Data Profiling Solutions Dashboard Indicating Business Intelligence Analytics Structure PDF. The topics addressed in these templates are Number Columns, Slightly Change Figures, SQL Server. All the content presented in this PPT design is completely editable. Download it and make adjustments in color, background, font etc. as per your unique business setting.
Implementing CRM To Optimize Dashboard Depicting Customer Retention Analytics Icons PDF
This slide shows the dashboard that depicts customer retention analytics which includes net promoter score, customer loyalty rate, customer lifetime value, customer and revenue churn, monthly recurring revenue growth, etc. Slidegeeks is one of the best resources for PowerPoint templates. You can download easily and regulate Implementing CRM To Optimize Dashboard Depicting Customer Retention Analytics Icons PDF for your personal presentations from our wonderful collection. A few clicks is all it takes to discover and get the most relevant and appropriate templates. Use our Templates to add a unique zing and appeal to your presentation and meetings. All the slides are easy to edit and you can use them even for advertisement purposes.

CRM Administration To Reduce Churn Rate Dashboard Depicting Customer Retention Analytics Themes PDF
This slide shows the dashboard that depicts customer retention analytics which includes net promoter score, customer loyalty rate, customer lifetime value, customer and revenue churn, monthly recurring revenue growth, etc. Make sure to capture your audiences attention in your business displays with our gratis customizable CRM Administration To Reduce Churn Rate Dashboard Depicting Customer Retention Analytics Themes PDF. These are great for business strategies, office conferences, capital raising or task suggestions. If you desire to acquire more customers for your tech business and ensure they stay satisfied, create your own sales presentation with these plain slides.
Optimizing Marketing Analytics To Enhance Organizational Growth KPI Dashboard For Tracking Inspiration PDF
This slide covers the dashboard for analysing paid search metrics such as ad cost, clicks, impressions, click-through rate, cost per conversion, conversion rate, cost per click, etc. Do you have to make sure that everyone on your team knows about any specific topic I yes, then you should give Optimizing Marketing Analytics To Enhance Organizational Growth KPI Dashboard For Tracking Inspiration PDF a try. Our experts have put a lot of knowledge and effort into creating this impeccable Optimizing Marketing Analytics To Enhance Organizational Growth KPI Dashboard For Tracking Inspiration PDF. You can use this template for your upcoming presentations, as the slides are perfect to represent even the tiniest detail. You can download these templates from the Slidegeeks website and these are easy to edit. So grab these today.
Online Marketing Analytics To Enhance Business Growth Kpi Dashboard For Tracking Paid Ad Campaign Diagrams PDF
This slide covers the dashboard for analyzing paid search metrics such as ad cost, clicks, impressions, click-through rate, cost per conversion, conversion rate, cost per click, etc. Do you have to make sure that everyone on your team knows about any specific topic I yes, then you should give Online Marketing Analytics To Enhance Business Growth Kpi Dashboard For Tracking Paid Ad Campaign Diagrams PDF a try. Our experts have put a lot of knowledge and effort into creating this impeccable Online Marketing Analytics To Enhance Business Growth Kpi Dashboard For Tracking Paid Ad Campaign Diagrams PDF. You can use this template for your upcoming presentations, as the slides are perfect to represent even the tiniest detail. You can download these templates from the Slidegeeks website and these are easy to edit. So grab these today.

Techniques To Decrease Customer Dashboard Depicting Customer Retention Analytics Microsoft PDF
This slide shows the dashboard that depicts customer retention analytics which includes net promoter score, customer loyalty rate, customer lifetime value, customer and revenue churn, monthly recurring revenue growth, etc. Slidegeeks is here to make your presentations a breeze with Techniques To Decrease Customer Dashboard Depicting Customer Retention Analytics Microsoft PDF With our easy-to-use and customizable templates, you can focus on delivering your ideas rather than worrying about formatting. With a variety of designs to choose from, youre sure to find one that suits your needs. And with animations and unique photos, illustrations, and fonts, you can make your presentation pop. So whether youre giving a sales pitch or presenting to the board, make sure to check out Slidegeeks first.
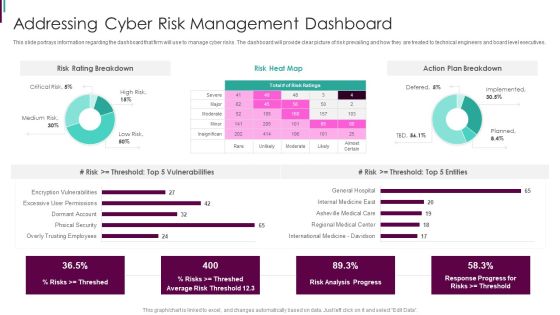
Developing Business Analytics Framework Addressing Cyber Risk Management Dashboard Graphics PDF
This slide portrays information regarding the dashboard that firm will use to manage cyber risks. The dashboard will provide clear picture of risk prevailing and how they are treated to technical engineers and board level executives.Deliver and pitch your topic in the best possible manner with this Developing Business Analytics Framework Addressing Cyber Risk Management Dashboard Graphics PDF Use them to share invaluable insights on Risk Breakdown, Action Breakdown, Vulnerabilities and impress your audience. This template can be altered and modified as per your expectations. So, grab it now.
Optimizing Marketing Analytics To Enhance Organizational Growth KPI Dashboard For Tracking Paid Ad Campaign Template PDF
This slide covers the KPI dashboard for analyzing SEO metrics such as authority score, organic traffic, organic keywords, paid keywords, ref. Domains, site audit, link-building tool, organic traffic, on-page SEO checker, backlink audit, etc. There are so many reasons you need a Optimizing Marketing Analytics To Enhance Organizational Growth KPI Dashboard For Tracking Paid Ad Campaign Template PDF. The first reason is you can not spend time making everything from scratch, Thus, Slidegeeks has made presentation templates for you too. You can easily download these templates from our website easily.
Online Marketing Analytics To Enhance Business Growth Kpi Dashboard For Tracking Email Marketing Mockup PDF
This slide covers the dashboard for analyzing email marketing metrics such as overall open rate, click-through rate, click to open ratio, unsubscribe rate, hard bounce rate, soft rate, monthly open rate, total monthly subscribers, etc. There are so many reasons you need a Online Marketing Analytics To Enhance Business Growth Kpi Dashboard For Tracking Email Marketing Mockup PDF. The first reason is you cannot spend time making everything from scratch, Thus, Slidegeeks has made presentation templates for you too. You can easily download these templates from our website easily.
Marketers Guide To Data Analysis Optimization KPI Dashboard For Tracking SEO Analytics Template PDF
This slide covers the KPI dashboard for analyzing SEO metrics such as authority score, organic traffic, organic keywords, paid keywords, ref. Domains, site audit, link-building tool, organic traffic, on-page SEO checker, backlink audit, etc. This Marketers Guide To Data Analysis Optimization KPI Dashboard For Tracking SEO Analytics Template PDF from Slidegeeks makes it easy to present information on your topic with precision. It provides customization options, so you can make changes to the colors, design, graphics, or any other component to create a unique layout. It is also available for immediate download, so you can begin using it right away. Slidegeeks has done good research to ensure that you have everything you need to make your presentation stand out. Make a name out there for a brilliant performance.

Human Resource Analytics HR Talent Management Key Metrics Dashboard Brochure PDF
This slide represents the KPI dashboard to track and monitor management of talent by the HR department. It includes details related to talent satisfaction, talent turnover rate, fired talents etc. Coming up with a presentation necessitates that the majority of the effort goes into the content and the message you intend to convey. The visuals of a PowerPoint presentation can only be effective if it supplements and supports the story that is being told. Keeping this in mind our experts created Human Resource Analytics HR Talent Management Key Metrics Dashboard Brochure PDF to reduce the time that goes into designing the presentation. This way, you can concentrate on the message while our designers take care of providing you with the right template for the situation.
Marketing Success Metrics KPI Dashboard For Tracking Seo Analytics Background PDF
This slide covers the KPI dashboard for analyzing SEO metrics such as authority score, organic traffic, organic keywords, paid keywords, ref. Domains, site audit, link-building tool, organic traffic, on-page SEO checker, backlink audit, etc. This Marketing Success Metrics KPI Dashboard For Tracking Seo Analytics Background PDF from Slidegeeks makes it easy to present information on your topic with precision. It provides customization options, so you can make changes to the colors, design, graphics, or any other component to create a unique layout. It is also available for immediate download, so you can begin using it right away. Slidegeeks has done good research to ensure that you have everything you need to make your presentation stand out. Make a name out there for a brilliant performance.
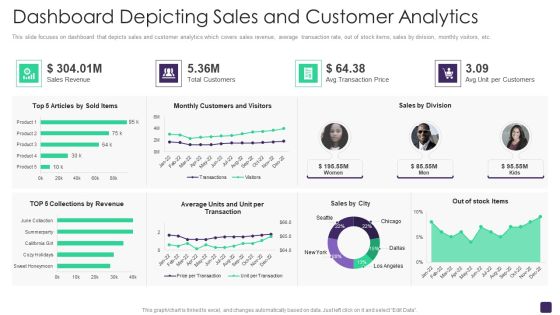
Retail Merchandising Program Dashboard Depicting Sales And Customer Analytics Topics PDF
This slide focuses on dashboard that depicts sales and customer analytics which covers sales revenue, average transaction rate, out of stock items, sales by division, monthly visitors, etc. Deliver an awe inspiring pitch with this creative Retail Merchandising Program Dashboard Depicting Sales And Customer Analytics Topics PDF bundle. Topics like Sales Revenue, Total Customers, Avg Transaction Price, Sales Division can be discussed with this completely editable template. It is available for immediate download depending on the needs and requirements of the user.
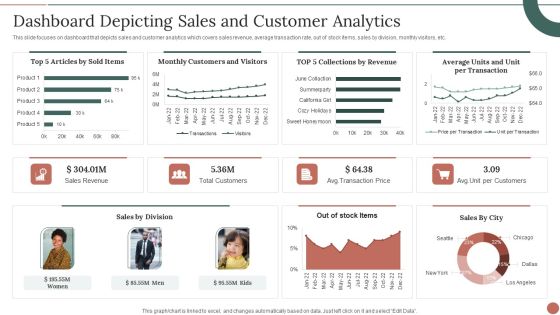
Retail Business Product Planning Procedure Dashboard Depicting Sales And Customer Analytics Themes PDF
This slide focuses on dashboard that depicts sales and customer analytics which covers sales revenue, average transaction rate, out of stock items, sales by division, monthly visitors, etc. Deliver and pitch your topic in the best possible manner with this Retail Business Product Planning Procedure Dashboard Depicting Sales And Customer Analytics Themes PDF. Use them to share invaluable insights on Sales Revenue, Total Customers, Sales By Division and impress your audience. This template can be altered and modified as per your expectations. So, grab it now.

Deploy Merchandise Program To Enhance Sales Dashboard Depicting Sales And Customer Analytics Sample PDF
This slide focuses on dashboard that depicts sales and customer analytics which covers sales revenue, average transaction rate, out of stock items, sales by division, monthly visitors, etc. Make sure to capture your audiences attention in your business displays with our gratis customizable Deploy Merchandise Program To Enhance Sales Dashboard Depicting Sales And Customer Analytics Sample PDF. These are great for business strategies, office conferences, capital raising or task suggestions. If you desire to acquire more customers for your tech business and ensure they stay satisfied, create your own sales presentation with these plain slides.

Business Analytics Application HR Talent Management Key Metrics Dashboard Rules PDF
This slide represents the KPI dashboard to track and monitor management of talent by the HR department. It includes details related to talent satisfaction, talent turnover rate, fired talents etc. This Business Analytics Application HR Talent Management Key Metrics Dashboard Rules PDF is perfect for any presentation, be it in front of clients or colleagues. It is a versatile and stylish solution for organizing your meetings. The Business Analytics Application HR Talent Management Key Metrics Dashboard Rules PDF features a modern design for your presentation meetings. The adjustable and customizable slides provide unlimited possibilities for acing up your presentation. Slidegeeks has done all the homework before launching the product for you. So, dont wait, grab the presentation templates today.

Cognitive Analytics Strategy And Techniques Tracking Customer Data Insights Dashboard Demonstration PDF
This slide provides information regarding customer data insights dashboard in terms of average churn risk, segments, high earner, highly engaged customers, etc. Take your projects to the next level with our ultimate collection of Cognitive Analytics Strategy And Techniques Tracking Customer Data Insights Dashboard Demonstration PDF. Slidegeeks has designed a range of layouts that are perfect for representing task or activity duration, keeping track of all your deadlines at a glance. Tailor these designs to your exact needs and give them a truly corporate look with your own brand colors they will make your projects stand out from the rest.
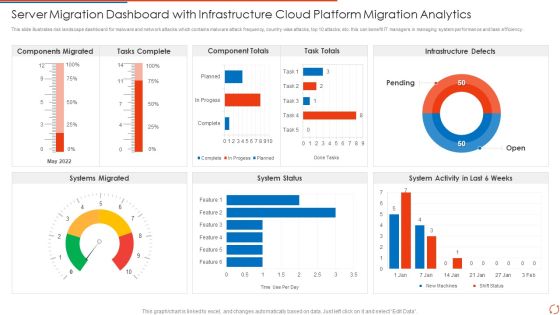
Server Migration Dashboard With Infrastructure Cloud Platform Migration Analytics Elements PDF Portrait PDF
This slide illustrates risk landscape dashboard for malware and network attacks which contains malware attack frequency, country wise attacks, top 10 attacks, etc. this can benefit IT managers in managing system performance and task efficiency Pitch your topic with ease and precision using this Server Migration Dashboard With Infrastructure Cloud Platform Migration Analytics Elements PDF Portrait PDF. This layout presents information on Tasks Complete, Component Totals, Task Totals. It is also available for immediate download and adjustment. So, changes can be made in the color, design, graphics or any other component to create a unique layout.
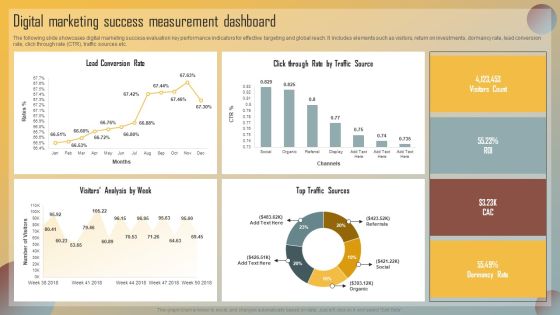
Guide For Marketing Analytics To Improve Decisions Digital Marketing Success Measurement Dashboard Guidelines PDF
The following slide showcases digital marketing success evaluation key performance indicators for effective targeting and global reach. It includes elements such as visitors, return on investments, dormancy rate, lead conversion rate, click through rate CTR, traffic sources etc. Boost your pitch with our creative Guide For Marketing Analytics To Improve Decisions Digital Marketing Success Measurement Dashboard Guidelines PDF. Deliver an awe-inspiring pitch that will mesmerize everyone. Using these presentation templates you will surely catch everyones attention. You can browse the ppts collection on our website. We have researchers who are experts at creating the right content for the templates. So you do not have to invest time in any additional work. Just grab the template now and use them.
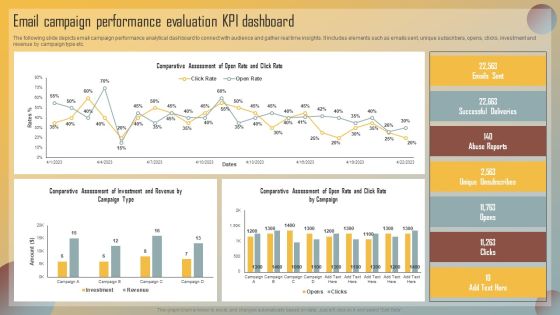
Guide For Marketing Analytics To Improve Decisions Email Campaign Performance Evaluation KPI Dashboard Summary PDF
The following slide depicts email campaign performance analytical dashboard to connect with audience and gather real time insights. It includes elements such as emails sent, unique subscribers, opens, clicks, investment and revenue by campaign type etc. Create an editable Guide For Marketing Analytics To Improve Decisions Email Campaign Performance Evaluation KPI Dashboard Summary PDF that communicates your idea and engages your audience. Whether youre presenting a business or an educational presentation, pre designed presentation templates help save time. Guide For Marketing Analytics To Improve Decisions Email Campaign Performance Evaluation KPI Dashboard Summary PDF is highly customizable and very easy to edit, covering many different styles from creative to business presentations. Slidegeeks has creative team members who have crafted amazing templates. So, go and get them without any delay.

KPI Dashboard To Track Mobile Search Engine Optimization Analytics Performance Introduction PDF
This slide shows the KPI dashboard to track performance of mobile search engine optimization analytics. It covers KPIs such as Google ranking, site check, sessions, etc. Showcasing this set of slides titled KPI Dashboard To Track Mobile Search Engine Optimization Analytics Performance Introduction PDF. The topics addressed in these templates are KPI Dashboard, Search Engine Optimization, Analytics Performance. All the content presented in this PPT design is completely editable. Download it and make adjustments in color, background, font etc. as per your unique business setting.

Cognitive Analytics Strategy And Techniques Tracking Essential Virtual Agents Activities Dashboard Template PDF
This slide provides information regarding virtual agents essential activities dashboard in terms of daily number of new conversation, unique users weekly conversations by channel, etc. Do you know about Slidesgeeks Cognitive Analytics Strategy And Techniques Tracking Essential Virtual Agents Activities Dashboard Template PDF These are perfect for delivering any kind od presentation. Using it, create PowerPoint presentations that communicate your ideas and engage audiences. Save time and effort by using our pre designed presentation templates that are perfect for a wide range of topic. Our vast selection of designs covers a range of styles, from creative to business, and are all highly customizable and easy to edit. Download as a PowerPoint template or use them as Google Slides themes.

Guide For Marketing Analytics To Improve Decisions Social Media Marketing Channel Performance Analysis Dashboard Background PDF
The following slide showcases social media analytical dashboard to deliver best content and drive more website users. It includes elements such as post reach, sessions, organic traffic, cost per lead, page engagement, traffic through ads etc. Do you have an important presentation coming up Are you looking for something that will make your presentation stand out from the rest Look no further than Guide For Marketing Analytics To Improve Decisions Social Media Marketing Channel Performance Analysis Dashboard Background PDF. With our professional designs, you can trust that your presentation will pop and make delivering it a smooth process. And with Slidegeeks, you can trust that your presentation will be unique and memorable. So why wait Grab Guide For Marketing Analytics To Improve Decisions Social Media Marketing Channel Performance Analysis Dashboard Background PDF today and make your presentation stand out from the rest.
Optimizing Marketing Analytics To Enhance Organizational Growth Website Landing Page KPI Tracking Dashboard Graphics PDF
This slide covers a dashboard for analysing the metrics of the website landing page. It includes KPIs such as conversions, conversion rate, sessions, bounce rate, engagement sickness, etc. Do you have an important presentation coming up Are you looking for something that will make your presentation stand out from the rest Look no further than Optimizing Marketing Analytics To Enhance Organizational Growth Website Landing Page KPI Tracking Dashboard Graphics PDF. With our professional designs, you can trust that your presentation will pop and make delivering it a smooth process. And with Slidegeeks, you can trust that your presentation will be unique and memorable. So why wait Grab Optimizing Marketing Analytics To Enhance Organizational Growth Website Landing Page KPI Tracking Dashboard Graphics PDF today and make your presentation stand out from the rest.
Online Marketing Analytics To Enhance Business Growth Website Landing Page KPI Tracking Dashboard Sample PDF
This slide covers a dashboard for analyzing the metrics of the website landing page. It includes KPIs such as conversions, conversion rate, sessions, bounce rate, engagement sickness, etc. If your project calls for a presentation, then Slidegeeks is your go to partner because we have professionally designed, easy to edit templates that are perfect for any presentation. After downloading, you can easily edit Online Marketing Analytics To Enhance Business Growth Website Landing Page KPI Tracking Dashboard Sample PDF and make the changes accordingly. You can rearrange slides or fill them with different images. Check out all the handy templates
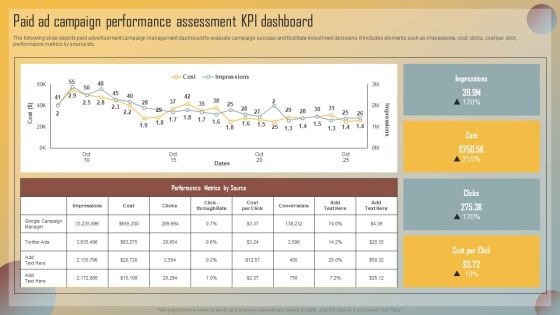
Guide For Marketing Analytics To Improve Decisions Paid Ad Campaign Performance Assessment KPI Dashboard Microsoft PDF
The following slide depicts paid advertisement campaign management dashboard to evaluate campaign success and facilitate investment decisions. It includes elements such as impressions, cost, clicks, cost per click, performance metrics by source etc. There are so many reasons you need a Guide For Marketing Analytics To Improve Decisions Paid Ad Campaign Performance Assessment KPI Dashboard Microsoft PDF. The first reason is you cannot spend time making everything from scratch, Thus, Slidegeeks has made presentation templates for you too. You can easily download these templates from our website easily.
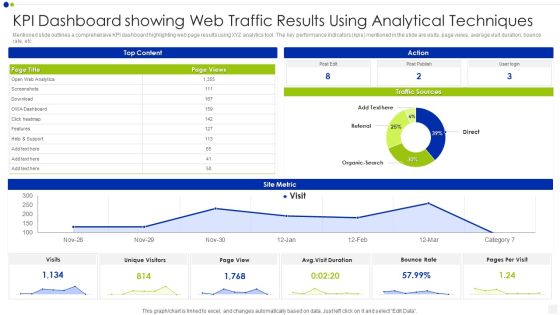
KPI Dashboard Showing Web Traffic Results Using Analytical Techniques Inspiration PDF
Mentioned slide outlines a comprehensive KPI dashboard highlighting web page results using XYZ analytics tool. The key performance indicators kpis mentioned in the slide are visits, page views, average visit duration, bounce rate, etc. Pitch your topic with ease and precision using this kpi dashboard showing web traffic results using analytical techniques inspiration pdf. This layout presents information on bounce rate, traffic sources, analytics. It is also available for immediate download and adjustment. So, changes can be made in the color, design, graphics or any other component to create a unique layout.
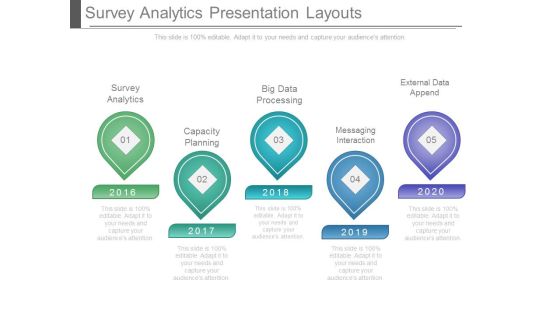
Survey Analytics Presentation Layouts
This is a survey analytics presentation layouts. This is a five stage process. The stages in this process are survey analytics, capacity planning, big data processing, messaging interaction, external data append.

Quarterly Business Analytics Roadmap With Data Analytics Brochure
We present our quarterly business analytics roadmap with data analytics brochure. This PowerPoint layout is easy-to-edit so you can change the font size, font type, color, and shape conveniently. In addition to this, the PowerPoint layout is Google Slides compatible, so you can share it with your audience and give them access to edit it. Therefore, download and save this well-researched quarterly business analytics roadmap with data analytics brochure in different formats like PDF, PNG, and JPG to smoothly execute your business plan.

Augmented Analytics Implementation IT Future Of Augmented Analytics Brochure PDF
This slide represents the future of augmented analytics, and it includes augmented data preparation, conversational augmented analytics, augmented data science, and machine learning. Presenting Augmented Analytics Implementation IT Future Of Augmented Analytics Brochure PDF to provide visual cues and insights. Share and navigate important information on three stages that need your due attention. This template can be used to pitch topics like Augmented Data Preparation, Conversational Augmented Analytics, Augmented Data Science, Machine Learning. In addtion, this PPT design contains high resolution images, graphics, etc, that are easily editable and available for immediate download.

Predictive Analytics Methods Introduction To Predictive Analytics Technology Clipart PDF
This slide represents the predictive analytics introduction that is used for forecasts action, behaviors, and trends using recent and past information. It performs the operations such as data mining, text analytics, statistics, and modeling on structured and unstructured data. Do you have to make sure that everyone on your team knows about any specific topic I yes, then you should give Predictive Analytics Methods Introduction To Predictive Analytics Technology Clipart PDF a try. Our experts have put a lot of knowledge and effort into creating this impeccable Predictive Analytics Methods Introduction To Predictive Analytics Technology Clipart PDF. You can use this template for your upcoming presentations, as the slides are perfect to represent even the tiniest detail. You can download these templates from the Slidegeeks website and these are easy to edit. So grab these today.

Augmented Analytics Implementation IT Introduction Of Augmented Analytics Portrait PDF
This slide represents the overview of augmented analytics that help users to interact with data by making suggestions, insights or query guidance through artificial intelligence and machine learning. Presenting Augmented Analytics Implementation IT Introduction Of Augmented Analytics Portrait PDF to provide visual cues and insights. Share and navigate important information on four stages that need your due attention. This template can be used to pitch topics like Analytics, Converse Data, Analytical Skills. In addtion, this PPT design contains high resolution images, graphics, etc, that are easily editable and available for immediate download.

Predictive Analytics Methods Uses Of Predictive Analytics Underwriting Infographics PDF
This slide represents the application of predictive analytics in underwriting by insurance companies. Predictive analytics help them identify future claims by analyzing policyholders historical data patterns and existing risk collection. Do you have an important presentation coming up Are you looking for something that will make your presentation stand out from the rest Look no further than Predictive Analytics Methods Uses Of Predictive Analytics Underwriting Infographics PDF. With our professional designs, you can trust that your presentation will pop and make delivering it a smooth process. And with Slidegeeks, you can trust that your presentation will be unique and memorable. So why wait Grab Predictive Analytics Methods Uses Of Predictive Analytics Underwriting Infographics PDF today and make your presentation stand out from the rest.

Customer Behavioral Data And Analytics Purchasing Behavior Analytics Brochure PDF
This is a customer behavioral data and analytics purchasing behavior analytics brochure pdf template with various stages. Focus and dispense information on two stages using this creative set, that comes with editable features. It contains large content boxes to add your information on topics like purchasing behavior analytics. You can also showcase facts, figures, and other relevant content using this PPT layout. Grab it now.

3 Months Business Analytics Roadmap With Data Analytics Structure
We present our 3 months business analytics roadmap with data analytics structure. This PowerPoint layout is easy-to-edit so you can change the font size, font type, color, and shape conveniently. In addition to this, the PowerPoint layout is Google Slides compatible, so you can share it with your audience and give them access to edit it. Therefore, download and save this well-researched 3 months business analytics roadmap with data analytics structure in different formats like PDF, PNG, and JPG to smoothly execute your business plan.

5 Year Business Analytics Roadmap With Data Analytics Sample
We present our 5 year business analytics roadmap with data analytics sample. This PowerPoint layout is easy-to-edit so you can change the font size, font type, color, and shape conveniently. In addition to this, the PowerPoint layout is Google Slides compatible, so you can share it with your audience and give them access to edit it. Therefore, download and save this well-researched 5 year business analytics roadmap with data analytics sample in different formats like PDF, PNG, and JPG to smoothly execute your business plan.

6 Months Business Analytics Roadmap With Data Analytics Brochure
We present our 6 months business analytics roadmap with data analytics brochure. This PowerPoint layout is easy-to-edit so you can change the font size, font type, color, and shape conveniently. In addition to this, the PowerPoint layout is Google Slides compatible, so you can share it with your audience and give them access to edit it. Therefore, download and save this well-researched 6 months business analytics roadmap with data analytics brochure in different formats like PDF, PNG, and JPG to smoothly execute your business plan.
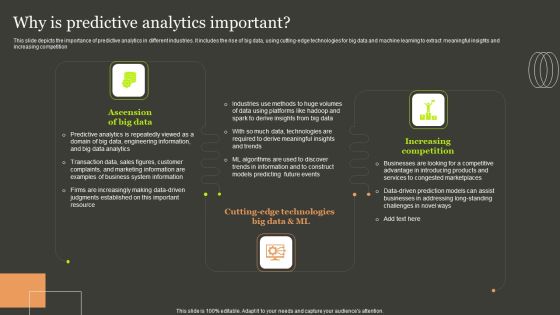
Predictive Analytics Methods Why Is Predictive Analytics Important Ideas PDF
This slide depicts the importance of predictive analytics in different industries. It includes the rise of big data, using cutting-edge technologies for big data and machine learning to extract meaningful insights and increasing competition. Whether you have daily or monthly meetings, a brilliant presentation is necessary. Predictive Analytics Methods Why Is Predictive Analytics Important Ideas PDF can be your best option for delivering a presentation. Represent everything in detail using Predictive Analytics Methods Why Is Predictive Analytics Important Ideas PDF and make yourself stand out in meetings. The template is versatile and follows a structure that will cater to your requirements. All the templates prepared by Slidegeeks are easy to download and edit. Our research experts have taken care of the corporate themes as well. So, give it a try and see the results.
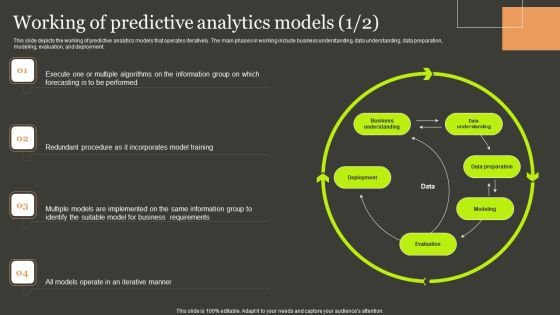
Predictive Analytics Methods Working Of Predictive Analytics Models Summary PDF
This slide depicts the working of predictive analytics models that operates iteratively. The main phases in working include business understanding, data understanding, data preparation, modeling, evaluation, and deployment. Find highly impressive Predictive Analytics Methods Working Of Predictive Analytics Models Summary PDF on Slidegeeks to deliver a meaningful presentation. You can save an ample amount of time using these presentation templates. No need to worry to prepare everything from scratch because Slidegeeks experts have already done a huge research and work for you. You need to download Predictive Analytics Methods Working Of Predictive Analytics Models Summary PDF for your upcoming presentation. All the presentation templates are 100 percent editable and you can change the color and personalize the content accordingly. Download now.
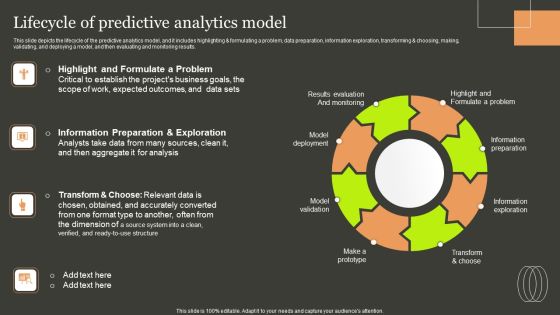
Predictive Analytics Methods Lifecycle Of Predictive Analytics Model Portrait PDF
This slide depicts the lifecycle of the predictive analytics model, and it includes highlighting and formulating a problem, data preparation, information exploration, transforming and choosing, making, validating, and deploying a model, and then evaluating and monitoring results. Crafting an eye catching presentation has never been more straightforward. Let your presentation shine with this tasteful yet straightforward Predictive Analytics Methods Lifecycle Of Predictive Analytics Model Portrait PDF template. It offers a minimalistic and classy look that is great for making a statement. The colors have been employed intelligently to add a bit of playfulness while still remaining professional. Construct the ideal Predictive Analytics Methods Lifecycle Of Predictive Analytics Model Portrait PDF that effortlessly grabs the attention of your audience Begin now and be certain to wow your customers.

Augmented Analytics Implementation IT Workflow Of Augmented Analytics Demonstration PDF
This slide depicts the workflow of augmented analytics, including data preparation and management, automated business intelligence, and augmented DSML. This is a Augmented Analytics Implementation IT Workflow Of Augmented Analytics Demonstration PDF template with various stages. Focus and dispense information on four stages using this creative set, that comes with editable features. It contains large content boxes to add your information on topics like Data Preparation And Management, Automated BI, Augmented Data Science And Machine Learning. You can also showcase facts, figures, and other relevant content using this PPT layout. Grab it now.

Predictive Analytics Methods Introduction To Predictive Analytics Workflow Slides PDF
This slide represents the predictive analytics workflow that is widely used in managing energy loads in electric grids. It includes accessing and exploring information, pre-processing data, developing predictive models, and integrating analytics with systems. Are you in need of a template that can accommodate all of your creative concepts This one is crafted professionally and can be altered to fit any style. Use it with Google Slides or PowerPoint. Include striking photographs, symbols, depictions, and other visuals. Fill, move around, or remove text boxes as desired. Test out color palettes and font mixtures. Edit and save your work, or work with colleagues. Download Predictive Analytics Methods Introduction To Predictive Analytics Workflow Slides PDF and observe how to make your presentation outstanding. Give an impeccable presentation to your group and make your presentation unforgettable.
Half Yearly Business Analytics Roadmap With Data Analytics Icons
Presenting our jaw-dropping half yearly business analytics roadmap with data analytics icons. You can alternate the color, font size, font type, and shapes of this PPT layout according to your strategic process. This PPT presentation is compatible with Google Slides and is available in both standard screen and widescreen aspect ratios. You can also download this well-researched PowerPoint template design in different formats like PDF, JPG, and PNG. So utilize this visually-appealing design by clicking the download button given below.

Customer Behavioral Data And Analytics Website Behavior Analytics Elements PDF
Presenting customer behavioral data and analytics website behavior analytics elements pdf to provide visual cues and insights. Share and navigate important information on four stages that need your due attention. This template can be used to pitch topics like customer acquisition channels, website behavior website visits and sources, website behavior products browsed, customer lifecycle statistics. In addtion, this PPT design contains high resolution images, graphics, etc, that are easily editable and available for immediate download.

Data Analytics Management What Is Big Data Analytics Slides PDF
This slide represents the meaning of big data and the complete data handling process such as data collection, storage, research, analysis, visualization, volume, and network.This is a Data Analytics Management What Is Big Data Analytics Slides PDF template with various stages. Focus and dispense information on one stage using this creative set, that comes with editable features. It contains large content boxes to add your information on topics like Standard Techniques, Difficult Impossible, Intelligence. You can also showcase facts, figures, and other relevant content using this PPT layout. Grab it now.

Predictive Analytics Methods Overview Of Predictive Analytics Framework Introduction PDF
This slide outlines the overview of the predictive analytics framework and its components, including wide area network, openflow, forecasting, software-defined networking controller, predictive models, elastic cluster, data acquisition and application servers. Slidegeeks is here to make your presentations a breeze with Predictive Analytics Methods Overview Of Predictive Analytics Framework Introduction PDF With our easy to use and customizable templates, you can focus on delivering your ideas rather than worrying about formatting. With a variety of designs to choose from, you are sure to find one that suits your needs. And with animations and unique photos, illustrations, and fonts, you can make your presentation pop. So whether you are giving a sales pitch or presenting to the board, make sure to check out Slidegeeks first.

Predictive Analytics Methods Regression Model For Predictive Analytics Template PDF
This slide represents the regression model of predictive analytics that is most commonly used in statistical analysis. This model is used to identify patterns in large amounts of data and works by calculating a formula. Retrieve professionally designed Predictive Analytics Methods Regression Model For Predictive Analytics Template PDF to effectively convey your message and captivate your listeners. Save time by selecting pre made slideshows that are appropriate for various topics, from business to educational purposes. These themes come in many different styles, from creative to corporate, and all of them are easily adjustable and can be edited quickly. Access them as PowerPoint templates or as Google Slides themes. You do not have to go on a hunt for the perfect presentation because Slidegeeks got you covered from everywhere.

Web Analytics Presentation Powerpoint Templates
This is a web analytics presentation powerpoint templates. This is a four stage process. The stages in this process are measure, report, analyze, optimize, web analytics.

Business Process Analytics Ppt Inspiration
This is a business process analytics ppt inspiration. This is a six stage process. The stages in this process are model development, model testing, implementation, explore the data, optimise find the solution, explore the data, analytics process.

Marketing Predictive Analytics Ppt Example
This is a marketing predictive analytics ppt example. This is a six stage process. The stages in this process are marketing data, explore, transform, model, validate, implement.
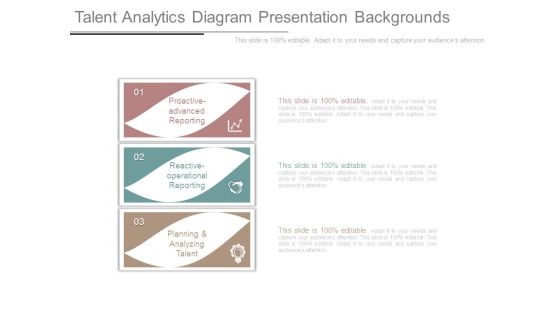
Talent Analytics Diagram Presentation Backgrounds
This is a talent analytics diagram presentation backgrounds. This is a three stage process. The stages in this process are proactive advanced reporting, reactive operational reporting, planning and analyzing talent.
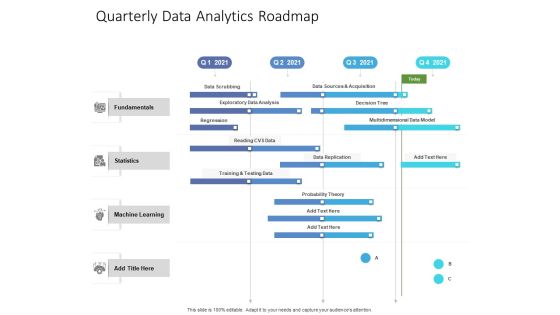
Quarterly Data Analytics Roadmap Pictures
Introducing our quarterly data analytics roadmap pictures. This PPT presentation is Google Slides compatible, therefore, you can share it easily with the collaborators for measuring the progress. Also, the presentation is available in both standard screen and widescreen aspect ratios. So edit the template design by modifying the font size, font type, color, and shapes as per your requirements. As this PPT design is fully editable it can be presented in PDF, JPG and PNG formats.

Augmented Analytics Implementation IT Data Visualization With Augmented Analytics Microsoft PDF
This slide represents the data visualization with an augmented analytics dashboard covering sales, spending per customer, gross profit, unique customers, unique purchase, and gross profit. Deliver an awe inspiring pitch with this creative Augmented Analytics Implementation IT Data Visualization With Augmented Analytics Microsoft PDF bundle. Topics like Category Contribution, Category Year To Year Growth, Top Products, Sales, Gross Profit can be discussed with this completely editable template. It is available for immediate download depending on the needs and requirements of the user.

Web Analytics For Seo Marketing Ppt PowerPoint Presentation Examples
This is a web analytics for seo marketing ppt powerpoint presentation examples. This is a five stage process. The stages in this process are digital analytics, digital dashboard, marketing.
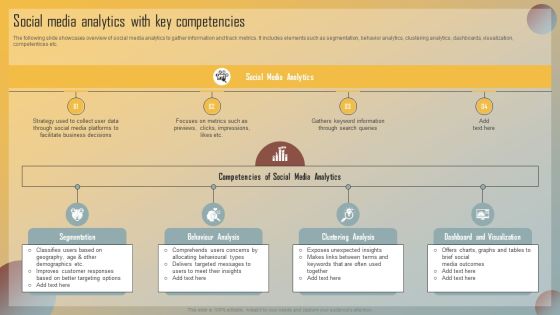
Guide For Marketing Analytics To Improve Decisions Social Media Analytics With Key Competencies Pictures PDF
The following slide showcases overview of social media analytics to gather information and track metrics. It includes elements such as segmentation, behavior analytics, clustering analytics, dashboards, visualization, competentices etc. Slidegeeks is here to make your presentations a breeze with Guide For Marketing Analytics To Improve Decisions Social Media Analytics With Key Competencies Pictures PDF With our easy to use and customizable templates, you can focus on delivering your ideas rather than worrying about formatting. With a variety of designs to choose from, you are sure to find one that suits your needs. And with animations and unique photos, illustrations, and fonts, you can make your presentation pop. So whether you are giving a sales pitch or presenting to the board, make sure to check out Slidegeeks first.

Clock Icon Business Analytics Ppt PowerPoint Presentation Complete Deck
Presenting this set of slides with name clock icon business analytics ppt powerpoint presentation complete deck. The topics discussed in these slides are time, business, analytics, dashboard, location. This is a completely editable PowerPoint presentation and is available for immediate download. Download now and impress your audience.

Software Application Marketing Data Analytics Report Mockup PDF
This slide shows app marketing analytics dashboard to gauge how well the marketing efforts are performing. It includes parameters like non organic content, organic content attribution,reengegement. Showcasing this set of slides titled Software Application Marketing Data Analytics Report Mockup PDF. The topics addressed in these templates are Software Application, Marketing Data, Analytics Report. All the content presented in this PPT design is completely editable. Download it and make adjustments in color, background, font etc. as per your unique business setting.

Advertising On Youtube Platform Youtube Marketing Campaign Analytics Ideas PDF
This slide provides the glimpse of KPI for YouTube marketing campaign which focuses on demographics, location and by age analysis of the video marketing viewers. Deliver an awe inspiring pitch with this creative advertising on youtube platform youtube marketing campaign analytics ideas pdf bundle. Topics like youtube marketing campaign analytics dashboard can be discussed with this completely editable template. It is available for immediate download depending on the needs and requirements of the user.
Predictive Analytics In The Age Of Big Data Predictive Analytics Model Performance Tracking Introduction PDF
This slide represents the predictive analytics model performance tracking dashboard, and it covers the details of total visitors, total buyers, total products added to the cart, filters by date and category, visitors to clients conversion rate, and so on. Slidegeeks has constructed Predictive Analytics In The Age Of Big Data Predictive Analytics Model Performance Tracking Introduction PDF after conducting extensive research and examination. These presentation templates are constantly being generated and modified based on user preferences and critiques from editors. Here, you will find the most attractive templates for a range of purposes while taking into account ratings and remarks from users regarding the content. This is an excellent jumping off point to explore our content and will give new users an insight into our top notch PowerPoint Templates.
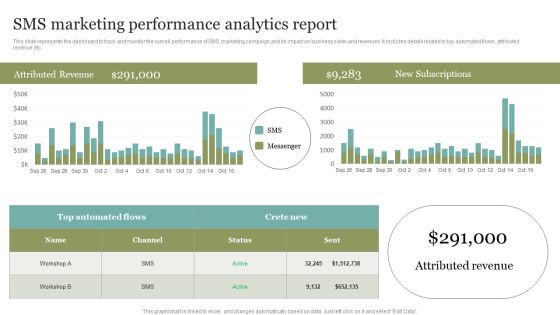
SMS Marketing Performance Analytics Report Summary PDF
This slide represents the dashboard to track and monitor the overall performance of SMS marketing campaign and its impact on business sales and revenues. It includes details related to top automated flows, attributed revenue etc. This SMS Marketing Performance Analytics Report Summary PDF from Slidegeeks makes it easy to present information on your topic with precision. It provides customization options, so you can make changes to the colors, design, graphics, or any other component to create a unique layout. It is also available for immediate download, so you can begin using it right away. Slidegeeks has done good research to ensure that you have everything you need to make your presentation stand out. Make a name out there for a brilliant performance.

Data Service Analytics Diagram Ppt Inspiration
This is a data service analytics diagram ppt inspiration. This is a eight stage process. The stages in this process are traffic demand estimation, policy control analytics, data processing, device analytics, service quality analytics, charging verification, productivity, statistical research.

Analytics Solutions Sample Of Ppt Presentation
This is a analytics solutions sample of ppt presentation. This is a eight stage process. The stages in this process are information sources, analytics solutions, system infrastructure, social network, big data, data discovery, data analysis, reports and dashboards.

Tools To Conduct SEO Analytics Training Ppt
This slide provides an overview of major tools to perform SEO analytics such as Google Analytics, SE Ranking, Sitechecker, Moz Pro, Ahrefs and SEMrush.
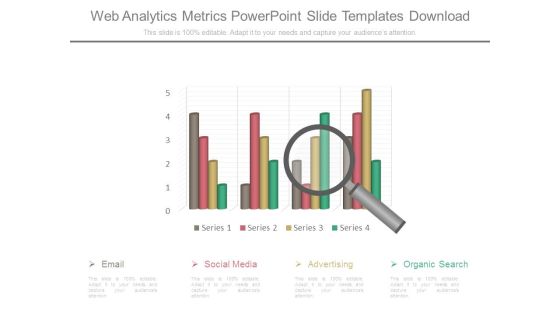
Web Analytics Metrics Powerpoint Slide Templates Download
This is a web analytics metrics powerpoint slide templates download. This is a one stage process. The stages in this process are email, social media, advertising, organic search.
Business Framework Big Data Analytics PowerPoint Presentation
This unique power point diagram slide has been crafted with big data analytics. This data analytics is used to improve predictions and support decision making. Use this image slide for big data analysis related presentations.

Analytics Solutions Diagram Sample Of Ppt Presentation
This is a analytics solutions diagram sample of ppt presentation. This is a four stage process. The stages in this process are analytic applications, analytics, data sources, business intelligence.

Data Modeling And Analytics Example Ppt Presentation
This is a data modeling and analytics example ppt presentation. This is a four stage process. The stages in this process are data modeling, data migration, balance data, explore data, data modeling and analytics.

Advantages Of SEO Analytics Training Ppt
The purpose of this slide is to provide an overview of SEO analytics. It also includes details of major SEO analytics benefits such as tracking online traffic, understanding user behavior, knowing the websites popular pages, and improving website content.

AI Driven Logistics Management Analytics Professional PDF
The purpose of this slide is to showcase supply chain data analytics to optimize the workflow by identifying inefficiencies and driving digital innovation. Certain analytics includes predictive, descriptive, prescriptive, and cognitive. Presenting AI Driven Logistics Management Analytics Professional PDF to dispense important information. This template comprises four stages. It also presents valuable insights into the topics including Predictive Analytics, Prescriptive Analytics, Descriptive Analytics. This is a completely customizable PowerPoint theme that can be put to use immediately. So, download it and address the topic impactfully.
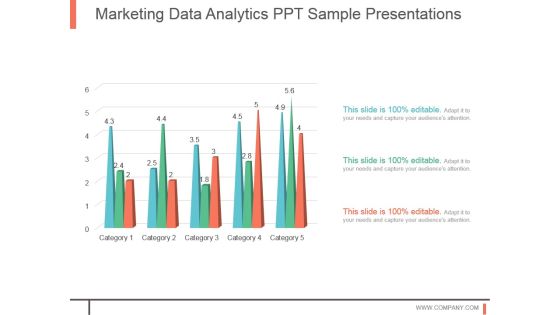
Marketing Data Analytics Ppt Sample Presentations
This is a marketing data analytics ppt sample presentations. This is a five stage process. The stages in this process are business, strategy, marketing, process, linear process.

Data Analytics For Marketing Growth Ppt Slide
This is a data analytics for marketing growth ppt slide. This is a five stage process. The stages in this process are category.
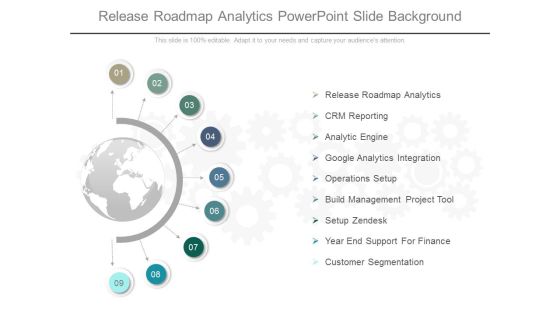
Release Roadmap Analytics Powerpoint Slide Background
This is a release roadmap analytics powerpoint slide background. This is a nine stage process. The stages in this process are release roadmap analytics, crm reporting, analytic engine, google analytics integration, operations setup, build management project tool, setup zendesk, year end support for finance, customer segmentation.

Data Analytics Ppt PowerPoint Presentation Graphics
This is a data analytics ppt powerpoint presentation graphics. This is a five stage process. The stages in this process are data analysis, business, marketing, success, graph.

Data Analytics Ppt PowerPoint Presentation Themes
This is a data analytics ppt powerpoint presentation themes. This is a five stage process. The stages in this process are business, marketing, presentation, data analyst, management.

Centralized Data Analytics Team Structure Clipart PDF
This slide shows the model representing the structure of the centralized data analytics team. It includes key stakeholders such as vice president, centralized data analytics team, and analysts of units A,B and C.Persuade your audience using this Centralized Data Analytics Team Structure Clipart PDF. This PPT design coversone stage, thus making it a great tool to use. It also caters to a variety of topics including Vice President, Data Analytics, Analytics Team. Download this PPT design now to present a convincing pitch that not only emphasizes the topic but also showcases your presentation skills.

Data Analytics Ppt PowerPoint Presentation Guide
This is a data analytics ppt powerpoint presentation guide. This is a five stage process. The stages in this process are data analysis, business, marketing, success, graph.

Data Analytics Process Ppt PowerPoint Presentation Inspiration
This is a data analytics process ppt powerpoint presentation inspiration. This is a four stage process. The stages in this process are decision, insight, data, info.

Oracle Analytics Cloud Application Roles Background PDF
This slide represents the oracle analytics aloud application roles. It includes BI service administrator, BI data model author, BI content writer, BI data load, DV content writer, and DV consumer. Deliver an awe inspiring pitch with this creative oracle analytics cloud application roles background pdf bundle. Topics like administrator, content, communicate, dashboards, visualizations can be discussed with this completely editable template. It is available for immediate download depending on the needs and requirements of the user.

Bar Chart For Data Analytics Ppt Examples
This is a bar chart for data analytics ppt examples. This is a five stage process. The stages in this process are category.

Data Analytics Bar Chart Ppt Sample Presentations
This is a data analytics bar chart ppt sample presentations. This is a five stage process. The stages in this process are category.
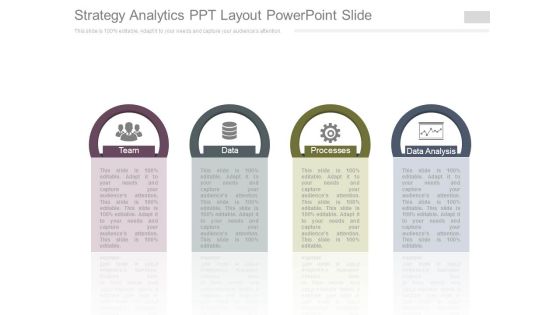
Strategy Analytics Ppt Layout Powerpoint Slide
This is a strategy analytics ppt layout powerpoint slide. This is a four stage process. The stages in this process are team, data, processes, data analysis.

Data Driven Analytics Chart Powerpoint Presentation Templates
This is a data driven analytics chart powerpoint presentation templates. This is a five stage process. The stages in this process are category.

Visual Analytics Ppt Presentation Background Images
This is a visual analytics ppt presentation background images. This is a three stage process. The stages in this process are visualization, interaction, data analysis.

SEO Analytics Benefits And Tools Training Ppt
These slides provide information on the advantages of SEO analytics and list the multiple tools to use to perform the same.

Advanced Analytics Techniques Template Powerpoint Slides
This is a advanced analytics techniques template powerpoint slides. This is a six stage process. The stages in this process are reporting, strategy, collection, knowledge, information, data.

Advanced Predictive Analytics And Machine Learning Concept
This is a advanced predictive analytics and machine learning concept. This is a nine stage process. The stages in this process are demographics, orders, products, visits channels, social media sentiment, customer data, orzota predictive analytics, customer knowledge, improve conversion, targeted marketing, better customer satisfaction, increased sales.
Predictive Healthcare Data Analytics Icon Summary PDF
Presenting Predictive Healthcare Data Analytics Icon Summary PDF to dispense important information. This template comprises Three stages. It also presents valuable insights into the topics including Predictive Healthcare, Data Analytics Icon. This is a completely customizable PowerPoint theme that can be put to use immediately. So, download it and address the topic impactfully
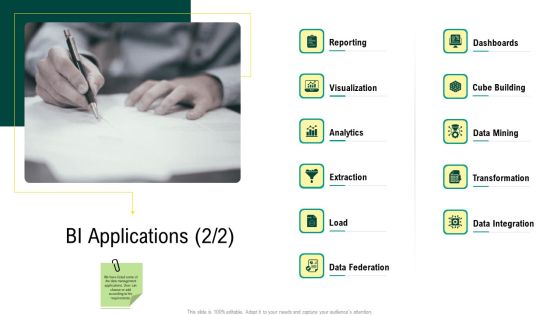
Expert Systems BI Applications Analytics Sample PDF
Presenting expert systems bi applications analytics sample pdf to provide visual cues and insights. Share and navigate important information on elven stages that need your due attention. This template can be used to pitch topics like reporting, visualization, analytics, extraction, data mining, cube building, transformation. In addtion, this PPT design contains high-resolution images, graphics, etc, that are easily editable and available for immediate download.
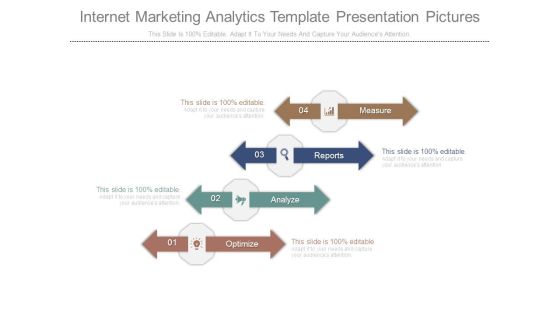
Internet Marketing Analytics Template Presentation Pictures
This is a internet marketing analytics template presentation pictures. This is a four stage process. The stages in this process are measure, reports, analyze, optimize.

Sales Analytics Ppt Layout Presentation Images
This is a sales analytics ppt layout presentation images. This is a five stage process. The stages in this process are sales reporting, sales portals, engine, reporter, pathfinder.
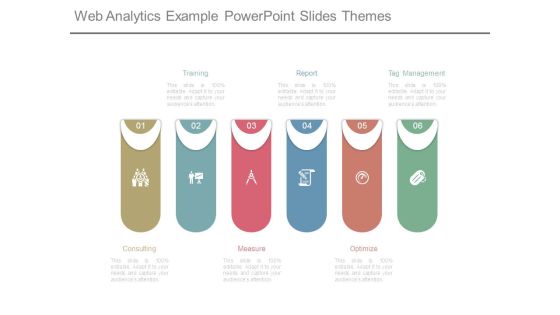
Web Analytics Example Powerpoint Slides Themes
This is a web analytics example powerpoint slides themes. This is a six stage process. The stages in this process are consulting, training, measure, report, optimize, tag management.

Expert Systems Advanced Analytics Methods Mockup PDF
Deliver an awe inspiring pitch with this creative expert systems advanced analytics methods mockup pdf bundle. Topics like arithmetic counters, machine learning and data mining, social network analytics, regression analysis can be discussed with this completely editable template. It is available for immediate download depending on the needs and requirements of the user.
Expert Systems Advanced Analytics Techniques Icons PDF
Presenting expert systems advanced analytics techniques icons pdf to provide visual cues and insights. Share and navigate important information on three stages that need your due attention. This template can be used to pitch topics like business intelligence, clickstream, analytics, data mining, planning. In addtion, this PPT design contains high-resolution images, graphics, etc, that are easily editable and available for immediate download.
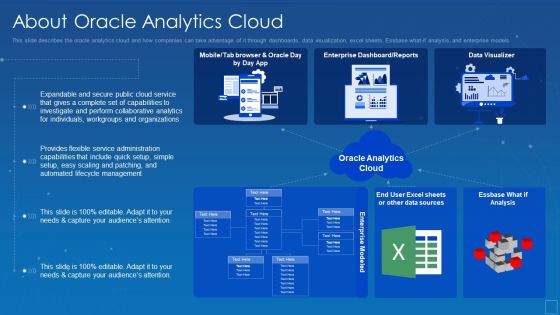
Oracle Cloud Data Analytics Administration IT About Oracle Analytics Cloud Clipart PDF
This slide describes the oracle analytics cloud and how companies can take advantage of it through dashboards, data visualization, excel sheets, Essbase what if analysis, and enterprise models. Deliver and pitch your topic in the best possible manner with this oracle cloud data analytics administration it about oracle analytics cloud clipart pdf. Use them to share invaluable insights on management, lifecycle, capabilities, service, flexible and impress your audience. This template can be altered and modified as per your expectations. So, grab it now.
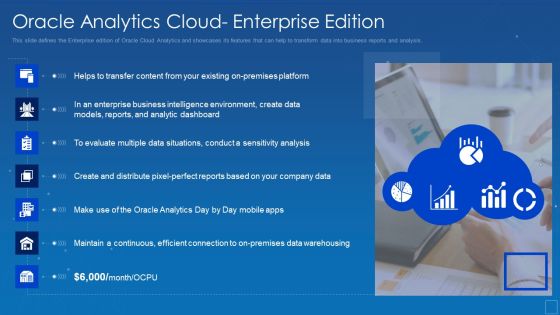
Oracle Analytics Cloud Enterprise Edition Download PDF
This slide defines the Enterprise edition of Oracle Cloud Analytics and showcases its features that can help to transform data into business reports and analysis. This is a oracle analytics cloud enterprise edition download pdf template with various stages. Focus and dispense information on six stages using this creative set, that comes with editable features. It contains large content boxes to add your information on topics like content, on premises, platform, environment, intelligence, dashboard. You can also showcase facts, figures, and other relevant content using this PPT layout. Grab it now.

Big Healthcare Data Analytics Workflow Infographics PDF
This slide showcase the process for big data mining in healthcare. It includes elements such as types of different data, types of analytics and outcomes improved. Showcasing this set of slides titled Big Healthcare Data Analytics Workflow Infographics PDF. The topics addressed in these templates are Data Detection, Electronic Health Record, Clinical Data. All the content presented in this PPT design is completely editable. Download it and make adjustments in color, background, font etc. as per your unique business setting.

Web Analytics Diagram Ppt Slides Themes
This is a web analytics diagram ppt slides themes. This is a three stage process. The stages in this process are build, analyse, measure, test alternatives, optimise, collect data, define goals, report, implement.
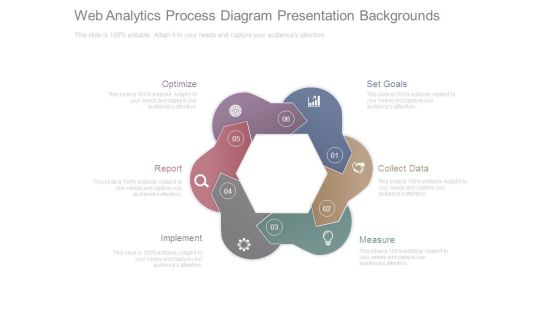
Web Analytics Process Diagram Presentation Backgrounds
This is a web analytics process diagram presentation backgrounds. This is a six stage process. The stages in this process are optimize, report, implement, measure, collect data, set goals.
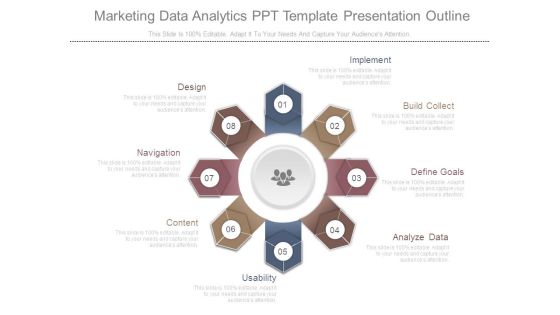
Marketing Data Analytics Ppt Template Presentation Outline
This is a marketing data analytics ppt template presentation outline. This is a eight stage process. The stages in this process are design, navigation, content, usability, analyze data, define goals, build collect, implement.

Sample Of Visual Analytics Diagram Powerpoint Guide
This is a sample of visual analytics diagram powerpoint guide. This is a four stage process. The stages in this process are data analysis, business problem, find structure, data view.

Data Analytics In Portfolio Management Powerpoint Templates
This is a data analytics in portfolio management powerpoint templates. This is a five stage process. The stages in this process are decision management, valuation, risk management, project finance, investment portfolio.

Web Analytics Process Diagram Powerpoint Images
This is a web analytics process diagram powerpoint images. This is a six stage process. The stages in this process are build kpis, define goals, implement, test alternatives, analyze data, collect data.

User Big Data Input Analytics Designs PDF
Showcasing this set of slides titled user big data input analytics designs pdf. The topics addressed in these templates are analytical data store, data packet processing, stream processing. All the content presented in this PPT design is completely editable. Download it and make adjustments in color, background, font etc. as per your unique business setting.

Half Yearly Data Analytics Implementation Roadmap Demonstration
We present our half yearly data analytics implementation roadmap demonstration. This PowerPoint layout is easy-to-edit so you can change the font size, font type, color, and shape conveniently. In addition to this, the PowerPoint layout is Google Slides compatible, so you can share it with your audience and give them access to edit it. Therefore, download and save this well-researched half yearly data analytics implementation roadmap demonstration in different formats like PDF, PNG, and JPG to smoothly execute your business plan.

Data Analytics Healthcare Best Technologies Template PDF
This slide showcases the most used technologies for healthcare data analytics. It includes technologies such as AI tools, cloud computing platforms, blockchain networks and machine learning tools. Presenting Data Analytics Healthcare Best Technologies Template PDF to dispense important information. This template comprises Five stages. It also presents valuable insights into the topics including Artificial Intelligence Tools, Cloud Computing Platforms, Blockchain Network. This is a completely customizable PowerPoint theme that can be put to use immediately. So, download it and address the topic impactfully.

Components Of Real Time Analytics Graphics PDF
The slide showcases elements of real time data analytics. It covers feed, sources, tools and outputs. Presenting Components Of Real Time Analytics Graphics PDF to dispense important information. This template comprises four stages. It also presents valuable insights into the topics including Feed, Sources, Tools . This is a completely customizable PowerPoint theme that can be put to use immediately. So, download it and address the topic impactfully.

Online Marketing Analytics Performance Report Microsoft PDF
This slide shows the digital marketing analytics performance report such as social media, blog and public relation performance with website health.Pitch your topic with ease and precision using this Online Marketing Analytics Performance Report Microsoft PDF This layout presents information on Blog Performance, Media Performance, Effective Engagement It is also available for immediate download and adjustment. So, changes can be made in the color, design, graphics or any other component to create a unique layout.
 Home
Home