Analytics Dashboard
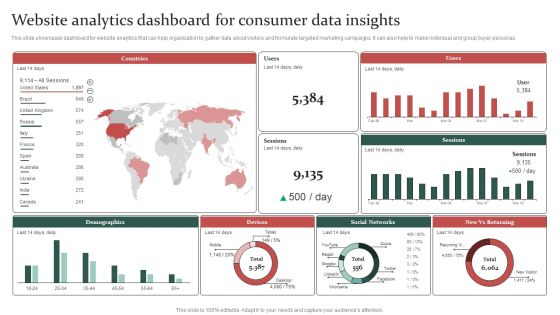
Gathering Customer Website Analytics Dashboard For Consumer Data Insights Formats PDF
This slide showcases dashboard for website analytics that can help organization to gather data about visitors and formulate targeted marketing campaigns. It can also help to make individual and group buyer personas. Present like a pro with Gathering Customer Website Analytics Dashboard For Consumer Data Insights Formats PDF Create beautiful presentations together with your team, using our easy-to-use presentation slides. Share your ideas in real-time and make changes on the fly by downloading our templates. So whether youre in the office, on the go, or in a remote location, you can stay in sync with your team and present your ideas with confidence. With Slidegeeks presentation got a whole lot easier. Grab these presentations today.

Developing Promotional Strategic Plan For Online Marketing Website Analytics Dashboard For Consumer Summary PDF
This slide showcases dashboard for website analytics that can help organization to gather data about visitors and formulate targeted marketing campaigns. It can also help to make individual and group buyer personas. Are you in need of a template that can accommodate all of your creative concepts This one is crafted professionally and can be altered to fit any style. Use it with Google Slides or PowerPoint. Include striking photographs, symbols, depictions, and other visuals. Fill, move around, or remove text boxes as desired. Test out color palettes and font mixtures. Edit and save your work, or work with colleagues. Download Developing Promotional Strategic Plan For Online Marketing Website Analytics Dashboard For Consumer Summary PDF and observe how to make your presentation outstanding. Give an impeccable presentation to your group and make your presentation unforgettable.
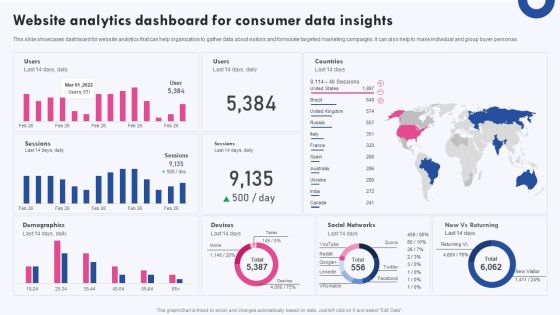
Targeted Marketing Campaigns To Improve Buyers Experience Website Analytics Dashboard For Consumer Infographics PDF
This slide showcases dashboard for website analytics that can help organization to gather data about visitors and formulate targeted marketing campaigns. It can also help to make individual and group buyer personas This modern and well arranged Targeted Marketing Campaigns To Improve Buyers Experience Website Analytics Dashboard For Consumer Infographics PDF provides lots of creative possibilities. It is very simple to customize and edit with the Powerpoint Software. Just drag and drop your pictures into the shapes. All facets of this template can be edited with Powerpoint no extra software is necessary. Add your own material, put your images in the places assigned for them, adjust the colors, and then you can show your slides to the world, with an animated slide included.
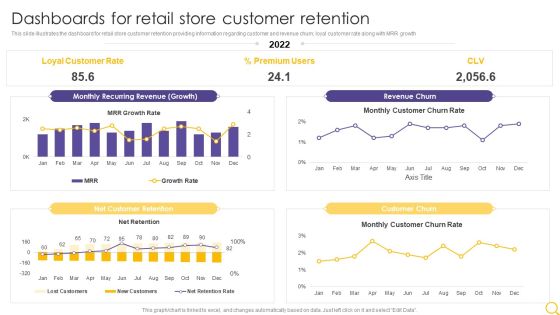
Retail Outlet Operational Efficiency Analytics Dashboards For Retail Store Customer Retention Topics PDF
This slide illustrates the dashboard for retail store customer retention providing information regarding customer and revenue churn, loyal customer rate along with MRR growth. Deliver and pitch your topic in the best possible manner with this Retail Outlet Operational Efficiency Analytics Dashboards For Retail Store Customer Retention Topics PDF. Use them to share invaluable insights on Loyal Customer Rate, Percent Premium Users, Revenue Churn and impress your audience. This template can be altered and modified as per your expectations. So, grab it now.

Retail Outlet Operational Efficiency Analytics Dashboards For Retail Store Customer Service Professional PDF
This slide includes dashboards for retail store customer service providing details of NPS, CSAT score. It also covers details of shoppers response towards product quality and price. Deliver an awe inspiring pitch with this creative Retail Outlet Operational Efficiency Analytics Dashboards For Retail Store Customer Service Professional PDF bundle. Topics like Product Quality, Customer Satisfaction, Customer Effort Score can be discussed with this completely editable template. It is available for immediate download depending on the needs and requirements of the user.

Retail Outlet Operational Efficiency Analytics Dashboards For Retail Store Customer Conversion Brochure PDF
This slide illustrates the dashboard for retail store customer conversion providing information regarding dwell time, engaged, cross and bounced shoppers, windows conversion etc. This is a Retail Outlet Operational Efficiency Analytics Dashboards For Retail Store Customer Conversion Brochure PDF template with various stages. Focus and dispense information on one stages using this creative set, that comes with editable features. It contains large content boxes to add your information on topics like Dwell Time, Customer Loyalty, Engaged Shoppers, Bounced Shoppers. You can also showcase facts, figures, and other relevant content using this PPT layout. Grab it now.

Customer Behavioral Data And Analytics Marketing Dashboard Template Professional PDF
Presenting customer behavioral data and analytics marketing dashboard template professional pdf to provide visual cues and insights. Share and navigate important information on three stages that need your due attention. This template can be used to pitch topics like marketing dashboard template. In addtion, this PPT design contains high resolution images, graphics, etc, that are easily editable and available for immediate download.

Marketing Analytics Reporting Dashboard Ppt PowerPoint Presentation Summary Slides
Presenting this set of slides with name marketing analytics reporting dashboard ppt powerpoint presentation summary slides. This is a one stage process. The stage in this process is marketing analytics reporting dashboard. This is a completely editable PowerPoint presentation and is available for immediate download. Download now and impress your audience.

Business Management Analytics Procedure Dashboard Icon Inspiration PDF
Presenting Business Management Analytics Procedure Dashboard Icon Inspiration PDF to dispense important information. This template comprises four stages. It also presents valuable insights into the topics including Business Management Analytics, Procedure Dashboard Icon. This is a completely customizable PowerPoint theme that can be put to use immediately. So, download it and address the topic impactfully.

Product Manufacturing Data Analytics Kpis Dashboard Guidelines PDF
This slide represents the data analytics dashboard for production manufacturing and management. It includes details related to KPIs such as rework quantity, labor cost, performance, overall equipment effectiveness etc. Showcasing this set of slides titled Product Manufacturing Data Analytics Kpis Dashboard Guidelines PDF. The topics addressed in these templates are Quantity, Rework Quantity, Manufacturing Cost, Labor Cot. All the content presented in this PPT design is completely editable. Download it and make adjustments in color, background, font etc. as per your unique business setting.
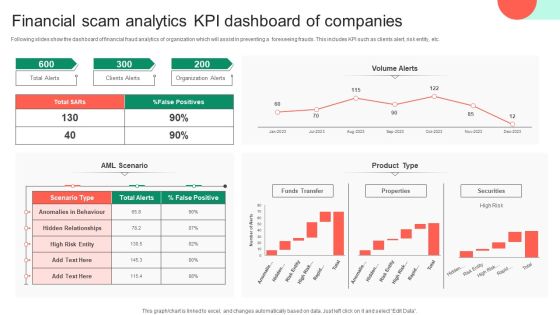
Financial Scam Analytics KPI Dashboard Of Companies Clipart PDF
Following slides show the dashboard of financial fraud analytics of organization which will assist in preventing a foreseeing frauds. This includes KPI such as clients alert, risk entity, etc. Pitch your topic with ease and precision using this Financial Scam Analytics KPI Dashboard Of Companies Clipart PDF. This layout presents information on Financial Scam Analytics, Kpi Dashboard Of Companies. It is also available for immediate download and adjustment. So, changes can be made in the color, design, graphics or any other component to create a unique layout.

Analytics Icon Dashboard Speedometer Ppt PowerPoint Presentation Complete Deck
Presenting this set of slides with name analytics icon dashboard speedometer ppt powerpoint presentation complete deck. The topics discussed in these slides are dashboard, speedometer, key performance, business, automobile. This is a completely editable PowerPoint presentation and is available for immediate download. Download now and impress your audience.

Business Analytics Solution Dashboard Ppt PowerPoint Presentation File Clipart PDF
Presenting this set of slides with name business analytics solution dashboard ppt powerpoint presentation file clipart pdf. The topics discussed in these slides are aesthetic, navigation, searchability. This is a completely editable PowerPoint presentation and is available for immediate download. Download now and impress your audience.

Analytics Procedure Dashboard With Start Trend And Summary Infographics PDF
This slide showcases a dashboard of analytics process to guide organizations upstream root cause and plan actions to avoid issues in future. It covers essential KPIs such as total and active process, average duration, participants, active tasks, errors, trend and summary. Showcasing this set of slides titled Analytics Procedure Dashboard With Start Trend And Summary Infographics PDF. The topics addressed in these templates are Procedure Status, Average Duration, Active Tasks. All the content presented in this PPT design is completely editable. Download it and make adjustments in color, background, font etc. as per your unique business setting.

Data Analytics Management Dashboard For Big Data Management Background PDF
This slide represents the dashboards for big data deployment by covering details of visitors and return visitors, subscribers, top 3 articles by readers, avg duration, and pages per visit. Deliver and pitch your topic in the best possible manner with this Data Analytics Management Dashboard For Big Data Management Background PDF. Use them to share invaluable insights on Article Readers, Categories Readers, Duration Pages and impress your audience. This template can be altered and modified as per your expectations. So, grab it now.

People Centric Work Cuture Analytics Kpi Dashboard Brochure PDF
The following slide presents KPI dashboard to analyse employee task and their contributions. It includes elements such as absenteeism rate, overtime hours, learning and development cost etc. Showcasing this set of slides titled People Centric Work Cuture Analytics Kpi Dashboard Brochure PDF. The topics addressed in these templates are Development Cost, Overall Labor Effectiveness, Absenteeism. All the content presented in this PPT design is completely editable. Download it and make adjustments in color, background, font etc. as per your unique business setting.

Healthcare Management Facilities Data On Analytics Platform Dashboard Slides PDF
This slide provides glimpse about facts and figures related to patients information databases on a digital healthcare management platform. It includes patients, inpatients, outpatients, etc. Showcasing this set of slides titled Healthcare Management Facilities Data On Analytics Platform Dashboard Slides PDF. The topics addressed in these templates are Patients By Department, Patients, Inpatients. All the content presented in this PPT design is completely editable. Download it and make adjustments in color, background, font etc. as per your unique business setting.
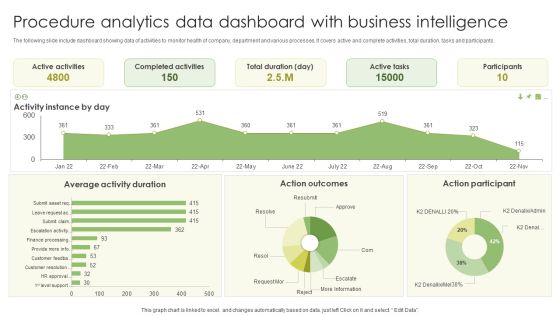
Procedure Analytics Data Dashboard With Business Intelligence Slides PDF
The following slide include dashboard showing data of activities to monitor health of company, department and various processes. It covers active and complete activities, total duration, tasks and participants. Pitch your topic with ease and precision using this Procedure Analytics Data Dashboard With Business Intelligence Slides PDF. This layout presents information on Active Activities, Completed Activities, Active Tasks . It is also available for immediate download and adjustment. So, changes can be made in the color, design, graphics or any other component to create a unique layout.

Marketing Success Metrics Social Media Analytics KPI Dashboard Elements PDF
This slide covers a dashboard for tracking social media kpis such as face engagements, total likes, followers, audience growth, youtube subscribers, views, instagram reach and , likes, linkedin impressions, etc. Find a pre-designed and impeccable Marketing Success Metrics Social Media Analytics KPI Dashboard Elements PDF. The templates can ace your presentation without additional effort. You can download these easy-to-edit presentation templates to make your presentation stand out from others. So, what are you waiting for Download the template from Slidegeeks today and give a unique touch to your presentation.
Vendor Performance KPI Analytical Dashboard Icon For Data Management Background PDF
Persuade your audience using this Vendor Performance KPI Analytical Dashboard Icon For Data Management Background PDF. This PPT design covers three stages, thus making it a great tool to use. It also caters to a variety of topics including Vendor Performance, KPI Analytical Dashboard, Icon Data Management. Download this PPT design now to present a convincing pitch that not only emphasizes the topic but also showcases your presentation skills.

Creating Successful Strategies To Enhance Customer Experience Customer Engagement Analytical Dashboard Slides PDF
This slide shows customer engagement analytical dashboard that covers total sales, total transaction, email received, links clicked, unique customer sales, sales comparison, customers name, product list, etc.Deliver an awe inspiring pitch with this creative Creating Successful Strategies To Enhance Customer Experience Customer Engagement Analytical Dashboard Slides PDF bundle. Topics like Sales Comparison, Engagement Performance, Customer Sales can be discussed with this completely editable template. It is available for immediate download depending on the needs and requirements of the user.
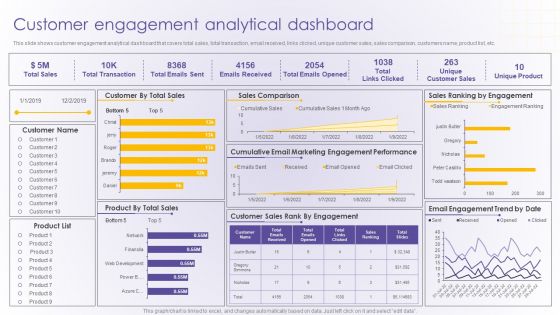
Customer Engagement Analytical Dashboard Developing Online Consumer Engagement Program Professional PDF
This slide shows customer engagement analytical dashboard that covers total sales, total transaction, email received, links clicked, unique customer sales, sales comparison, customers name, product list, etc.Deliver and pitch your topic in the best possible manner with this Customer Engagement Analytical Dashboard Developing Online Consumer Engagement Program Professional PDF. Use them to share invaluable insights on Cumulative Email, Marketing Engagement, Performance and impress your audience. This template can be altered and modified as per your expectations. So, grab it now.
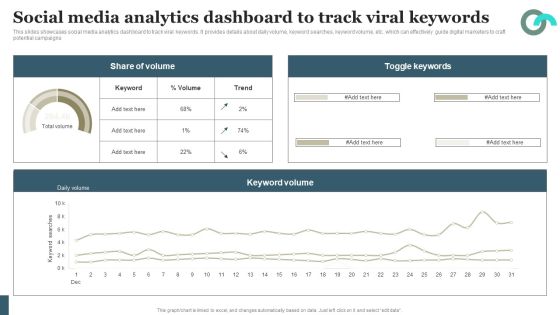
Viral Marketing Techniques To Increase Annual Business Sales Social Media Analytics Dashboard To Track Viral Demonstration PDF
This slides showcases social media analytics dashboard to track viral keywords. It provides details about daily volume, keyword searches, keyword volume, etc. which can effectively guide digital marketers to craft potential campaigns Slidegeeks is one of the best resources for PowerPoint templates. You can download easily and regulate Viral Marketing Techniques To Increase Annual Business Sales Social Media Analytics Dashboard To Track Viral Demonstration PDF for your personal presentations from our wonderful collection. A few clicks is all it takes to discover and get the most relevant and appropriate templates. Use our Templates to add a unique zing and appeal to your presentation and meetings. All the slides are easy to edit and you can use them even for advertisement purposes.
Gym Health And Fitness Market Industry Report Analytics Dashboard For Gym Health And Fitness Clubs Ppt Icon Slideshow PDF
Presenting this set of slides with name gym health and fitness market industry report analytics dashboard for gym health and fitness clubs ppt icon slideshow pdf. This is a seven stage process. The stages in this process are attended special events, facebook fans, web hits, enrollment for gym, social media friends, twitter followers, emails collected on website. This is a completely editable PowerPoint presentation and is available for immediate download. Download now and impress your audience.
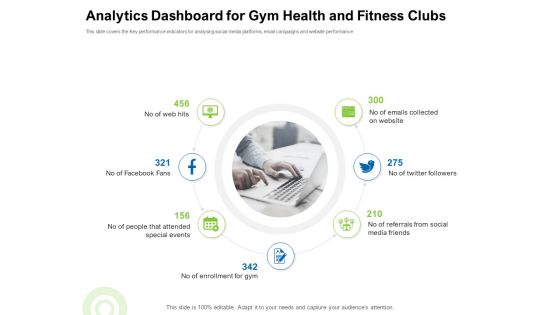
Strategies To Enter Physical Fitness Club Business Analytics Dashboard For Gym Health And Fitness Clubs Brochure PDF
This slide covers the Key performance indicators for analysing social media platforms, email campaigns and website performance This is a strategies to enter physical fitness club business analytics dashboard for gym health and fitness clubs brochure pdf template with various stages. Focus and dispense information on seven stages using this creative set, that comes with editable features. It contains large content boxes to add your information on topics like web, facebook, twitter, followers, friends. You can also showcase facts, figures, and other relevant content using this PPT layout. Grab it now.

Customizable Dashboard Enhanced Analytics Powerpoint Slides
This is a customizable dashboard enhanced analytics powerpoint slides. This is a six stage process. The stages in this process are customizable dashboard, reports, real time updates, natural query, data warehouse, enhanced analytics.
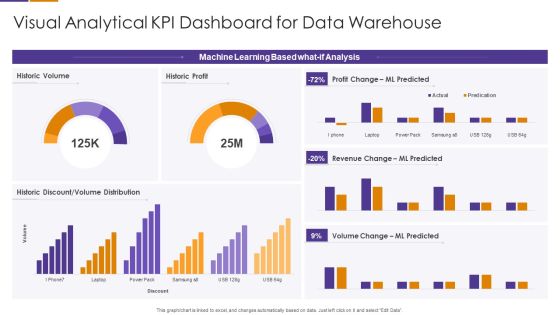
Visual Analytical KPI Dashboard For Data Warehouse Template PDF
Pitch your topic with ease and precision using this Visual Analytical KPI Dashboard For Data Warehouse Template PDF This layout presents information on Machine Learning Based, Volume Change, Revenue Change It is also available for immediate download and adjustment. So, changes can be made in the color, design, graphics or any other component to create a unique layout.
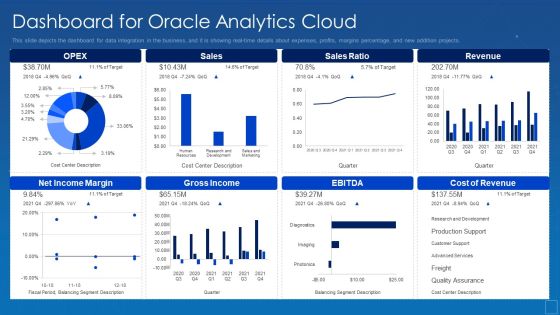
Oracle Cloud Data Analytics Administration IT Dashboard For Oracle Analytics Cloud Sample PDF
This slide depicts the dashboard for data integration in the business, and it is showing real-time details about expenses, profits, margins percentage, and new addition projects. Deliver an awe inspiring pitch with this creative oracle cloud data analytics administration it dashboard for oracle analytics cloud sample pdf bundle. Topics like dashboard for oracle analytics cloud can be discussed with this completely editable template. It is available for immediate download depending on the needs and requirements of the user.
Product Launch Time Analytics And Monitoring Dashboard Icon Inspiration PDF
Presenting Product Launch Time Analytics And Monitoring Dashboard Icon Inspiration PDF to dispense important information. This template comprises three stages. It also presents valuable insights into the topics including Product Launch Time, Analytics, And Monitoring, Dashboard Icon. This is a completely customizable PowerPoint theme that can be put to use immediately. So, download it and address the topic impactfully.
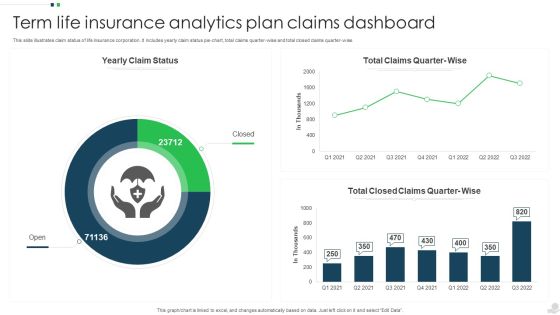
Term Life Insurance Analytics Plan Claims Dashboard Structure PDF
This slide illustrates claim status of life insurance corporation. It includes yearly claim status pie chart, total claims quarter-wise and total closed claims quarter wise. Pitch your topic with ease and precision using this Term Life Insurance Analytics Plan Claims Dashboard Structure PDF. This layout presents information on Insurance Analytics, Plan Claims Dashboard. It is also available for immediate download and adjustment. So, changes can be made in the color, design, graphics or any other component to create a unique layout.
Motor Insurance Analytics Statistics And Dashboard Icon Template PDF
Persuade your audience using this Motor Insurance Analytics Statistics And Dashboard Icon Template PDF. This PPT design covers three stages, thus making it a great tool to use. It also caters to a variety of topics including Motor Insurance Analytics, Statistics And Dashboard Icon. Download this PPT design now to present a convincing pitch that not only emphasizes the topic but also showcases your presentation skills.

Analyzing And Deploying HR Analytics Software Kpi Dashboard Information PDF
This slide shows the dashboard representing data related to human resource operations of the enterprise. It includes key metrics such as vacant positions, YTD personal expenses etc. There are so many reasons you need a Analyzing And Deploying HR Analytics Software Kpi Dashboard Information PDF. The first reason is you cant spend time making everything from scratch, Thus, Slidegeeks has made presentation templates for you too. You can easily download these templates from our website easily.
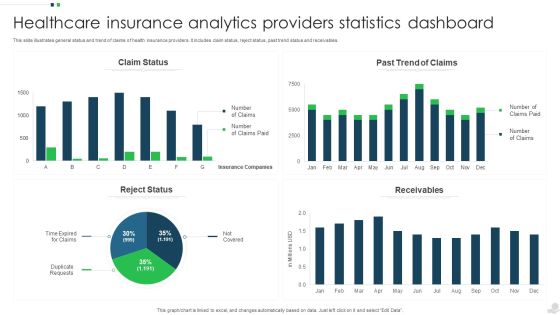
Healthcare Insurance Analytics Providers Statistics Dashboard Mockup PDF
This slide illustrates general status and trend of claims of health insurance providers. It includes claim status, reject status, past trend status and receivables. Showcasing this set of slides titled Healthcare Insurance Analytics Providers Statistics Dashboard Mockup PDF. The topics addressed in these templates are Claim Status, Past Trend Claims, Receivables. All the content presented in this PPT design is completely editable. Download it and make adjustments in color, background, font etc. as per your unique business setting.

Client Analytics Relationship Management Dashboard With Conversion Funnel Demonstration PDF
The following slide depicts the key performing areas in lead management. It includes traffic, potential customers, category wise closing percentages, financial insights etc. Pitch your topic with ease and precision using this Client Analytics Relationship Management Dashboard With Conversion Funnel Demonstration PDF. This layout presents information on Potential Customers, Social Media Followers, Social Media Subscribers. It is also available for immediate download and adjustment. So, changes can be made in the color, design, graphics or any other component to create a unique layout.

Dashboard Analytics Of Real Time Website Traffic Data Information PDF
The slide showcases a real time dashboard used to analyse, track, and report on the website traffic data in real time with the help of interactive data visualizations. It covers latest data sources, latest devices, views per minute, views per second, latest locations and latest website visitors. Showcasing this set of slides titled Dashboard Analytics Of Real Time Website Traffic Data Information PDF. The topics addressed in these templates are Latest Data Sources, Latest Devices, Views Per Second. All the content presented in this PPT design is completely editable. Download it and make adjustments in color, background, font etc. as per your unique business setting.

Integrating Web Analytics Campaign Strategy Dashboard Information PDF
This slide depicts integrating digital marketing dashboard used by organizations to track online campaigns. It includes tracking traffic sources, visitors type, bounce rate and top rated conversion channel, campaigns and pages. Showcasing this set of slides titled Integrating Web Analytics Campaign Strategy Dashboard Information PDF. The topics addressed in these templates are Channels By Conversion, Campaigns By Conversion, Pages By Conversion. All the content presented in this PPT design is completely editable. Download it and make adjustments in color, background, font etc. as per your unique business setting.
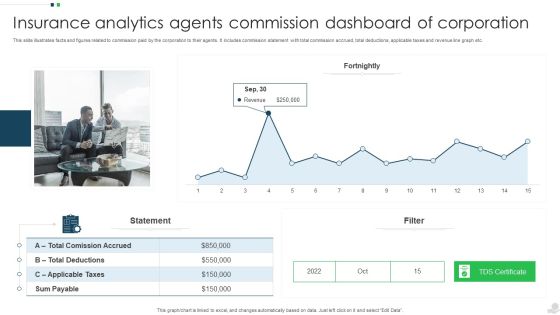
Insurance Analytics Agents Commission Dashboard Of Corporation Introduction PDF
This slide illustrates facts and figures related to commission paid by the corporation to their agents. It includes commission statement with total commission accrued, total deductions, applicable taxes and revenue line graph etc. Pitch your topic with ease and precision using this Insurance Analytics Agents Commission Dashboard Of Corporation Introduction PDF. This layout presents information on Applicable Taxes, Sum Payable, Revenue. It is also available for immediate download and adjustment. So, changes can be made in the color, design, graphics or any other component to create a unique layout.

Dashboard Of Recruitment Analytics Monitoring Brochure PDF
The slide depicts the dashboard of recruitment analytics monitoring depicting candidate by source, candidate workflow, candidate status, new application, application source vs hired and reasons for decline.Showcasing this set of slides titled Dashboard Of Recruitment Analytics Monitoring Brochure PDF The topics addressed in these templates are Candidate Workflow, Reasons Candidate, Candidate Status All the content presented in this PPT design is completely editable. Download it and make adjustments in color, background, font etc. as per your unique business setting.

Salary Dashboard With Custom Analytics Rules PDF
The following slide highlights the payroll dashboard with custom analytics illustrating key headings which includes analytics and reports, custom analytics, current payroll, last payroll, task to do, actions required and employee. Showcasing this set of slides titled Salary Dashboard With Custom Analytics Rules PDF. The topics addressed in these templates are Custom Analytics, Current Payroll, Characterize Employee Profiles. All the content presented in this PPT design is completely editable. Download it and make adjustments in color, background, font etc. as per your unique business setting.

Optimizing Marketing Analytics To Enhance Organizational Growth Social Media Analytics KPI Dashboard Graphics PDF
This slide covers a dashboard for tracking social media KPIs such as face engagements, total likes, followers, audience growth, YouTube subscribers, views, Instagram reach and , likes, LinkedIn impressions, etc. From laying roadmaps to briefing everything in detail, our templates are perfect for you. You can set the stage with your presentation slides. All you have to do is download these easy to edit and customizable templates. Optimizing Marketing Analytics To Enhance Organizational Growth Social Media Analytics KPI Dashboard Graphics PDF will help you deliver an outstanding performance that everyone would remember and praise you for. Do download this presentation today.

Online Marketing Analytics To Enhance Business Growth Social Media Analytics KPI Dashboard Brochure PDF
This slide covers a dashboard for tracking social media KPIs such as face engagements, total likes, followers, audience growth, YouTube subscribers, views, Instagram reach and , likes, LinkedIn impressions, etc. Slidegeeks is here to make your presentations a breeze with Online Marketing Analytics To Enhance Business Growth Social Media Analytics KPI Dashboard Brochure PDF With our easy to use and customizable templates, you can focus on delivering your ideas rather than worrying about formatting. With a variety of designs to choose from, you are sure to find one that suits your needs. And with animations and unique photos, illustrations, and fonts, you can make your presentation pop. So whether you are giving a sales pitch or presenting to the board, make sure to check out Slidegeeks first.

Sales Analytics Leaderboard Dashboard Ppt PowerPoint Presentation Infographic Template Templates PDF
Presenting this set of slides with name sales analytics leaderboard dashboard ppt powerpoint presentation infographic template templates pdf. The topics discussed in these slides are top performers, deal size, sales analytics, leaderboard dashboard. This is a completely editable PowerPoint presentation and is available for immediate download. Download now and impress your audience.

Dashboard Depicting Customer Retention Analytics Background PDF
This slide shows the dashboard that depicts customer retention analytics which includes net promoter score, customer loyalty rate, customer lifetime value, customer and revenue churn, monthly recurring revenue growth, etc. Make sure to capture your audiences attention in your business displays with our gratis customizable Dashboard Depicting Customer Retention Analytics Background PDF. These are great for business strategies, office conferences, capital raising or task suggestions. If you desire to acquire more customers for your tech business and ensure they stay satisfied, create your own sales presentation with these plain slides.
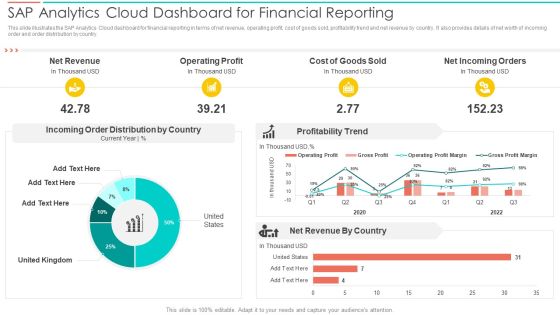
SAC Planning And Implementation SAP Analytics Cloud Dashboard For Financial Reporting Introduction PDF
This slide illustrates the SAP Analytics Cloud dashboard for financial reporting in terms of net revenue, operating profit, cost of goods sold, profitability trend and net revenue by country. It also provides details of net worth of incoming order and order distribution by country. Deliver an awe inspiring pitch with this creative SAC Planning And Implementation SAP Analytics Cloud Dashboard For Financial Reporting Introduction PDF bundle. Topics like Net Revenue, Operating Profit, Cost Goods Sold can be discussed with this completely editable template. It is available for immediate download depending on the needs and requirements of the user.
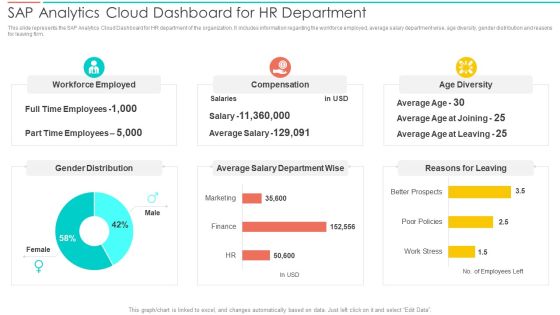
SAC Planning And Implementation SAP Analytics Cloud Dashboard For Hr Department Inspiration PDF
This slide represents the SAP Analytics Cloud Dashboard for HR department of the organization. It includes information regarding the workforce employed, average salary department wise, age diversity, gender distribution and reasons for leaving firm. Deliver and pitch your topic in the best possible manner with this SAC Planning And Implementation SAP Analytics Cloud Dashboard For Hr Department Inspiration PDF. Use them to share invaluable insights on Workforce Employed, Compensation, Age Diversity and impress your audience. This template can be altered and modified as per your expectations. So, grab it now.
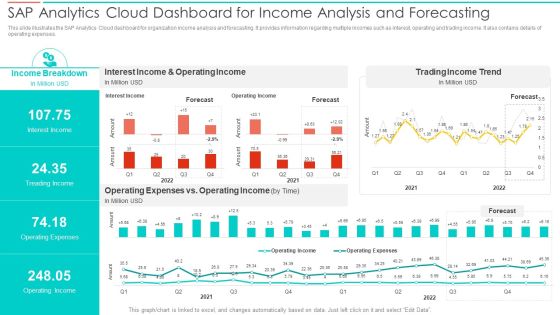
SAC Planning And Implementation SAP Analytics Cloud Dashboard For Income Analysis Summary PDF
This slide illustrates the SAP Analytics Cloud dashboard for organization income analysis and forecasting. It provides information regarding multiple incomes such as interest, operating and trading income. It also contains details of operating expenses. Deliver an awe inspiring pitch with this creative SAC Planning And Implementation SAP Analytics Cloud Dashboard For Income Analysis Summary PDF bundle. Topics like Income Breakdown, Interest Income, Operating Income, Trading Income Trend can be discussed with this completely editable template. It is available for immediate download depending on the needs and requirements of the user.
SAC Planning And Implementation SAP Analytics Cloud Dashboard For Product Sales Analysis Icons PDF
This slide illustrates the SAP Analytics Cloud dashboard to monitor product sales performance. It provides information regarding the gross margin and net revenue earned, product performance state wise and year wise. Deliver and pitch your topic in the best possible manner with this SAC Planning And Implementation SAP Analytics Cloud Dashboard For Product Sales Analysis Icons PDF. Use them to share invaluable insights on Gross Margin, Earned Quarter Wise, Gross Margin, Net Revenue and impress your audience. This template can be altered and modified as per your expectations. So, grab it now.
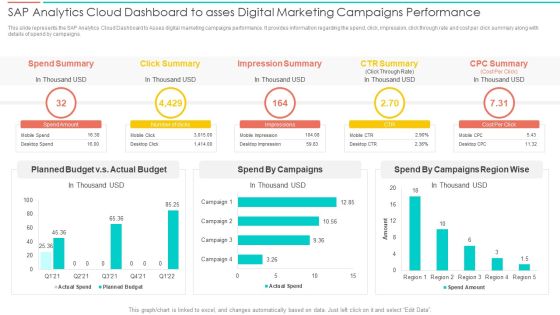
SAC Planning And Implementation SAP Analytics Cloud Dashboard To Asses Digital Marketing Pictures PDF
This slide represents the SAP Analytics Cloud Dashboard to Asses digital marketing campaigns performance. It provides information regarding the spend, click, impression, click through rate and cost per click summary along with details of spend by campaigns. Deliver an awe inspiring pitch with this creative SAC Planning And Implementation SAP Analytics Cloud Dashboard To Asses Digital Marketing Pictures PDF bundle. Topics like Spend Summary, Click Summary, Impression Summary, CTR Summary can be discussed with this completely editable template. It is available for immediate download depending on the needs and requirements of the user.

Sap Analytics Cloud Dashboard For Income Analysis And Forecasting Formats PDF
This slide illustrates the SAP Analytics Cloud dashboard for organization income analysis and forecasting. It provides information regarding multiple incomes such as interest, operating and trading income. It also contains details of operating expenses. The best PPT templates are a great way to save time, energy, and resources. Slidegeeks have 100 percent editable powerpoint slides making them incredibly versatile. With these quality presentation templates, you can create a captivating and memorable presentation by combining visually appealing slides and effectively communicating your message. Download Sap Analytics Cloud Dashboard To Asses Digital Marketing Campaigns Performance Ideas PDF from Slidegeeks and deliver a wonderful presentation.

Sap Analytics Cloud Dashboard To Asses Digital Marketing Campaigns Performance Ideas PDF
This slide represents the SAP Analytics Cloud Dashboard to Asses digital marketing campaigns performance. It provides information regarding the spend, click, impression, click through rate and cost per click summary along with details of spend by campaigns. The best PPT templates are a great way to save time, energy, and resources. Slidegeeks have 100 percent editable powerpoint slides making them incredibly versatile. With these quality presentation templates, you can create a captivating and memorable presentation by combining visually appealing slides and effectively communicating your message. Download Sap Analytics Cloud Dashboard To Asses Digital Marketing Campaigns Performance Ideas PDF from Slidegeeks and deliver a wonderful presentation.
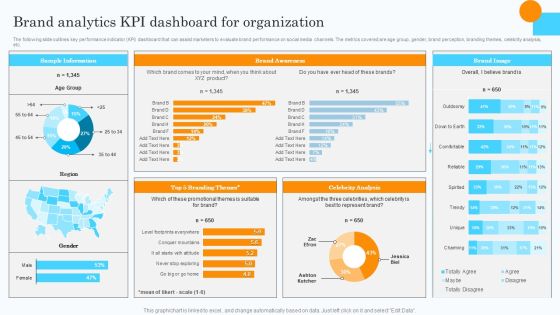
Market Research Assessment Of Target Market Requirements Brand Analytics Kpi Dashboard For Organization Clipart PDF
The following slide outlines key performance indicator KPI dashboard that can assist marketers to evaluate brand performance on social media channels. The metrics covered are age group, gender, brand perception, branding themes, celebrity analysis, etc. Do you have an important presentation coming up Are you looking for something that will make your presentation stand out from the rest Look no further than Market Research Assessment Of Target Market Requirements Brand Analytics Kpi Dashboard For Organization Clipart PDF. With our professional designs, you can trust that your presentation will pop and make delivering it a smooth process. And with Slidegeeks, you can trust that your presentation will be unique and memorable. So why wait Grab Market Research Assessment Of Target Market Requirements Brand Analytics Kpi Dashboard For Organization Clipart PDF today and make your presentation stand out from the rest.

BI Technique For Data Informed Decisions Sap Analytics Cloud Dashboard For Financial Reporting Portrait PDF
This slide illustrates the SAP Analytics Cloud dashboard for financial reporting in terms of net revenue, operating profit, cost of goods sold, profitability trend and net revenue by country. It also provides details of net worth of incoming order and order distribution by country. Coming up with a presentation necessitates that the majority of the effort goes into the content and the message you intend to convey. The visuals of a PowerPoint presentation can only be effective if it supplements and supports the story that is being told. Keeping this in mind our experts created BI Technique For Data Informed Decisions Sap Analytics Cloud Dashboard For Financial Reporting Portrait PDF to reduce the time that goes into designing the presentation. This way, you can concentrate on the message while our designers take care of providing you with the right template for the situation.

BI Technique For Data Informed Decisions Sap Analytics Cloud Dashboard For HR Department Background PDF
This slide represents the SAP Analytics Cloud Dashboard for HR department of the organization. It includes information regarding the workforce employed, average salary department wise, age diversity, gender distribution and reasons for leaving firm. This modern and well-arranged BI Technique For Data Informed Decisions Sap Analytics Cloud Dashboard For HR Department Background PDF provides lots of creative possibilities. It is very simple to customize and edit with the Powerpoint Software. Just drag and drop your pictures into the shapes. All facets of this template can be edited with Powerpoint no extra software is necessary. Add your own material, put your images in the places assigned for them, adjust the colors, and then you can show your slides to the world, with an animated slide included.
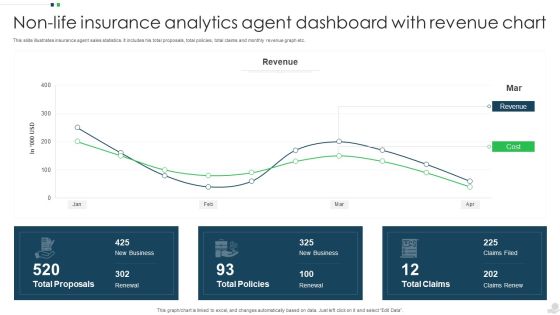
Non Life Insurance Analytics Agent Dashboard With Revenue Chart Infographics PDF
This slide illustrates insurance agent sales statistics. It includes his total proposals, total policies, total claims and monthly revenue graph etc. Showcasing this set of slides titled Non Life Insurance Analytics Agent Dashboard With Revenue Chart Infographics PDF. The topics addressed in these templates are Revenue, Cost, Total Proposals. All the content presented in this PPT design is completely editable. Download it and make adjustments in color, background, font etc. as per your unique business setting.

Data Analytics IT Dashboard For Data Science Implementation Ppt Portfolio Pictures PDF
This slide depicts the dashboard for data integration in the business, and it is showing real-time details about expenses, profits, margins percentage, and new addition projects. Deliver and pitch your topic in the best possible manner with this data analytics it dashboard for data science implementation ppt portfolio pictures pdf. Use them to share invaluable insights on data and analytics, margin percentage, profits, expenses, new additions projects and impress your audience. This template can be altered and modified as per your expectations. So, grab it now.

Marketers Guide To Data Analysis Optimization Social Media Analytics KPI Dashboard Clipart PDF
This slide covers a dashboard for tracking social media KPIs such as face engagements, total likes, followers, audience growth, YouTube subscribers, views, Instagram reach and , likes, LinkedIn impressions, etc. Find a pre designed and impeccable Marketers Guide To Data Analysis Optimization Social Media Analytics KPI Dashboard Clipart PDF. The templates can ace your presentation without additional effort. You can download these easy to edit presentation templates to make your presentation stand out from others. So, what are you waiting for Download the template from Slidegeeks today and give a unique touch to your presentation.

Analyzing And Deploying HR Analytics Diversity Dashboard Of Enterprise Inspiration PDF
This slide shows the key performance metrics dashboard showing data related to HR operations of an organization. It shows key metrics such as gender diversity by business unit, headcount by seniority and age banding etc. Want to ace your presentation in front of a live audience Our Analyzing And Deploying HR Analytics Diversity Dashboard Of Enterprise Inspiration PDF can help you do that by engaging all the users towards you. Slidegeeks experts have put their efforts and expertise into creating these impeccable powerpoint presentations so that you can communicate your ideas clearly. Moreover, all the templates are customizable, and easy-to-edit and downloadable. Use these for both personal and commercial use.

Market Research To Determine Business Opportunities Brand Analytics KPI Dashboard For Organization Inspiration PDF
The following slide outlines key performance indicator KPI dashboard that can assist marketers to evaluate brand performance on social media channels. The metrics covered are age group, gender, brand perception, branding themes, celebrity analysis, etc. There are so many reasons you need a Market Research To Determine Business Opportunities Brand Analytics KPI Dashboard For Organization Inspiration PDF. The first reason is you cannot spend time making everything from scratch, Thus, Slidegeeks has made presentation templates for you too. You can easily download these templates from our website easily.

Comprehensive Market Research Guide Brand Analytics Kpi Dashboard For Organization Brochure PDF
The following slide outlines key performance indicator KPI dashboard that can assist marketers to evaluate brand performance on social media channels. The metrics covered are age group, gender, brand perception, branding themes, celebrity analysis, etc. From laying roadmaps to briefing everything in detail, our templates are perfect for you. You can set the stage with your presentation slides. All you have to do is download these easy-to-edit and customizable templates. Comprehensive Market Research Guide Brand Analytics Kpi Dashboard For Organization Brochure PDF will help you deliver an outstanding performance that everyone would remember and praise you for. Do download this presentation today.

Brand Analytics KPI Dashboard For Organization Ppt PowerPoint Presentation Diagram PDF
The following slide outlines key performance indicator KPI dashboard that can assist marketers to evaluate brand performance on social media channels. The metrics covered are age group, gender, brand perception, branding themes, celebrity analysis, etc. Take your projects to the next level with our ultimate collection of Brand Analytics KPI Dashboard For Organization Ppt PowerPoint Presentation Diagram PDF. Slidegeeks has designed a range of layouts that are perfect for representing task or activity duration, keeping track of all your deadlines at a glance. Tailor these designs to your exact needs and give them a truly corporate look with your own brand colors they will make your projects stand out from the rest.

Creating Positioning Techniques For Market Research Brand Analytics Kpi Dashboard For Organization Slides PDF
The following slide outlines key performance indicator KPI dashboard that can assist marketers to evaluate brand performance on social media channels. The metrics covered are age group, gender, brand perception, branding themes, celebrity analysis, etc. Boost your pitch with our creative Creating Positioning Techniques For Market Research Brand Analytics Kpi Dashboard For Organization Slides PDF. Deliver an awe-inspiring pitch that will mesmerize everyone. Using these presentation templates you will surely catch everyones attention. You can browse the ppts collection on our website. We have researchers who are experts at creating the right content for the templates. So you do not have to invest time in any additional work. Just grab the template now and use them.
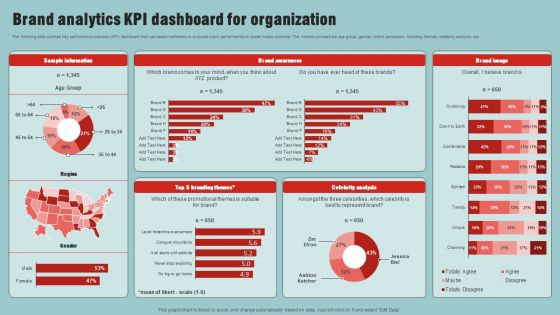
Market Analysis Overview And Different Categories Brand Analytics Kpi Dashboard For Organization Rules PDF
The following slide outlines key performance indicator KPI dashboard that can assist marketers to evaluate brand performance on social media channels. The metrics covered are age group, gender, brand perception, branding themes, celebrity analysis, etc. Present like a pro with Market Analysis Overview And Different Categories Brand Analytics Kpi Dashboard For Organization Rules PDF Create beautiful presentations together with your team, using our easy to use presentation slides. Share your ideas in real time and make changes on the fly by downloading our templates. So whether you are in the office, on the go, or in a remote location, you can stay in sync with your team and present your ideas with confidence. With Slidegeeks presentation got a whole lot easier. Grab these presentations today.

Steps To Effectively Conduct Market Research Brand Analytics KPI Dashboard For Organization Template PDF
The following slide outlines key performance indicator KPI dashboard that can assist marketers to evaluate brand performance on social media channels. The metrics covered are age group, gender, brand perception, branding themes, celebrity analysis, etc. Present like a pro with Steps To Effectively Conduct Market Research Brand Analytics KPI Dashboard For Organization Template PDF Create beautiful presentations together with your team, using our easy to use presentation slides. Share your ideas in real time and make changes on the fly by downloading our templates. So whether you are in the office, on the go, or in a remote location, you can stay in sync with your team and present your ideas with confidence. With Slidegeeks presentation got a whole lot easier. Grab these presentations today.

Brand Analytics Kpi Dashboard For Organization Ppt Portfolio Graphics Design PDF
The following slide outlines key performance indicator KPI dashboard that can assist marketers to evaluate brand performance on social media channels. The metrics covered are age group, gender, brand perception, branding themes, celebrity analysis, etc. Boost your pitch with our creative Brand Analytics Kpi Dashboard For Organization Ppt Portfolio Graphics Design PDF. Deliver an awe inspiring pitch that will mesmerize everyone. Using these presentation templates you will surely catch everyones attention. You can browse the ppts collection on our website. We have researchers who are experts at creating the right content for the templates. So you do not have to invest time in any additional work. Just grab the template now and use them.

BI Technique For Data Informed Decisions Sap Analytics Cloud Dashboard For Product Sales Analysis Sample PDF
This slide illustrates the SAP Analytics Cloud dashboard to monitor product sales performance. It provides information regarding the gross margin and net revenue earned, product performance state wise and year wise. Welcome to our selection of the Budget Plan For BI Technique For Data Informed Decisions Clipart PDF. These are designed to help you showcase your creativity and bring your sphere to life. Planning and Innovation are essential for any business that is just starting out. This collection contains the designs that you need for your everyday presentations. All of our PowerPoints are 100 percent editable, so you can customize them to suit your needs. This multi purpose template can be used in various situations. Grab these presentation templates today.

Retail Outlet Operational Efficiency Analytics Sales Dashboards For Retail Store Inspiration PDF
This slide illustrates the dashboard retail store sales forecasting providing information regarding sales per employee, price unit every transaction, total number of customers and average value of customer transaction. Deliver and pitch your topic in the best possible manner with this Retail Outlet Operational Efficiency Analytics Sales Dashboards For Retail Store Inspiration PDF. Use them to share invaluable insights on Gross Sales, Total No Customers, Value Customer and impress your audience. This template can be altered and modified as per your expectations. So, grab it now.

Types Dashboard Web Analytics Ppt PowerPoint Presentation Summary Layout Cpb
Presenting this set of slides with name types dashboard web analytics ppt powerpoint presentation summary layout cpb. This is an editable Powerpoint five stages graphic that deals with topics like types dashboard web analytics to help convey your message better graphically. This product is a premium product available for immediate download and is 100 percent editable in Powerpoint. Download this now and use it in your presentations to impress your audience.

Procurement Data Analytics And Business Intelligence Dashboard Pictures PDF
This slide showcases BI dashboard to help company in real time tracking of procurement KPIs. It includes information such as defect rate, supplier availability, lead time, etc. Pitch your topic with ease and precision using this Procurement Data Analytics And Business Intelligence Dashboard Pictures PDF. This layout presents information on Procurement Data Analytics, Business Intelligence Dashboard. It is also available for immediate download and adjustment. So, changes can be made in the color, design, graphics or any other component to create a unique layout.

Insurance Analytics Corporation Clients Claims Dashboard Summary PDF
This slide illustrates clients claim status statistics of a insurance corporation. It includes total claims, monthly claims, claims amount by type, percentage of claims, denied and received claims line graph. Showcasing this set of slides titled Insurance Analytics Corporation Clients Claims Dashboard Summary PDF. The topics addressed in these templates are Insurance Analytics Corporation, Clients Claims Dashboard. All the content presented in this PPT design is completely editable. Download it and make adjustments in color, background, font etc. as per your unique business setting.

Insurance Analytics Corporation Sales Insights Dashboard Structure PDF
This slide illustrates facts and figures in relation to sales and overall policy status. It includes total policies and premiums in current and previous year, quarterly premium revenue and monthly policy status. Pitch your topic with ease and precision using this Insurance Analytics Corporation Sales Insights Dashboard Structure PDF. This layout presents information on Quarterly Premium Revenue, Sales Insights Dashboard, Insurance Analytics Corporation. It is also available for immediate download and adjustment. So, changes can be made in the color, design, graphics or any other component to create a unique layout.
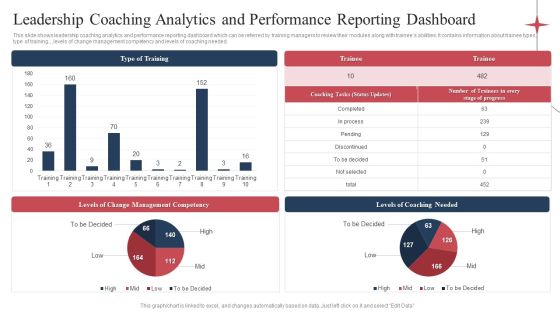
Leadership Coaching Analytics And Performance Reporting Dashboard Demonstration PDF
This slide shows leadership coaching analytics and performance reporting dashboard which can be referred by training managers to review their modules along with trainees abilities. It contains information about trainee types, type of training., ,levels of change management competency and levels of coaching needed. Pitch your topic with ease and precision using this Leadership Coaching Analytics And Performance Reporting Dashboard Demonstration PDF. This layout presents information on Levels Coaching Needed, Levels Change Management, Type Training. It is also available for immediate download and adjustment. So, changes can be made in the color, design, graphics or any other component to create a unique layout.
Projection Model Predictive Analytics Model Performance Tracking Dashboard Microsoft PDF
This slide represents the predictive analytics model performance tracking dashboard, and it covers the details of total visitors, total buyers, total products added to the cart, filters by date and category, visitors to clients conversion rate, and so on. Find a pre-designed and impeccable Projection Model Predictive Analytics Model Performance Tracking Dashboard Microsoft PDF. The templates can ace your presentation without additional effort. You can download these easy-to-edit presentation templates to make your presentation stand out from others. So, what are you waiting for Download the template from Slidegeeks today and give a unique touch to your presentation.

Procurement Analytics Tools And Strategies Dashboard Procurement Analysis Inspiration PDF
This slide covers the procurement analysis dashboard including KPIs including total invoices, discount savings, etc. Deliver and pitch your topic in the best possible manner with this Procurement Analytics Tools And Strategies Dashboard Procurement Analysis Inspiration PDF. Use them to share invaluable insights on Total Invoice, Discount Savings, Invoice Discount and impress your audience. This template can be altered and modified as per your expectations. So, grab it now.
Facebook Analytics Pixel Marketing Plan Dashboard Professional PDF
This slide exhibits dashboard which offers free point of view for optimization and in-depth analysis of visitors. This template helps in tracking social media and campaigns performance. It involves information related to revenue, age factor, etc. Showcasing this set of slides titled Facebook Analytics Pixel Marketing Plan Dashboard Professional PDF Graphics. The topics addressed in these templates are People Metrics, Lifetime Value, Purchases Repeated. All the content presented in this PPT design is completely editable. Download it and make adjustments in color, background, font etc. as per your unique business setting.
Online Marketing Analytics To Enhance Business Growth Kpi Dashboard For Tracking SEO Analytics Themes PDF
This slide covers the KPI dashboard for analyzing SEO metrics such as authority score, organic traffic, organic keywords, paid keywords, ref. Domains, site audit, link-building tool, organic traffic, on-page SEO checker, backlink audit, etc. Get a simple yet stunning designed Online Marketing Analytics To Enhance Business Growth Kpi Dashboard For Tracking SEO Analytics Themes PDF. It is the best one to establish the tone in your meetings. It is an excellent way to make your presentations highly effective. So, download this PPT today from Slidegeeks and see the positive impacts. Our easy to edit Online Marketing Analytics To Enhance Business Growth Kpi Dashboard For Tracking SEO Analytics Themes PDF can be your go to option for all upcoming conferences and meetings. So, what are you waiting for Grab this template today.

Dashboards Analytical Methods Ppt PowerPoint Presentation Summary Icon Cpb Pdf
Presenting this set of slides with name dashboards analytical methods ppt powerpoint presentation summary icon cpb pdf. This is an editable Powerpoint five stages graphic that deals with topics like dashboards analytical methods to help convey your message better graphically. This product is a premium product available for immediate download and is 100 percent editable in Powerpoint. Download this now and use it in your presentations to impress your audience.
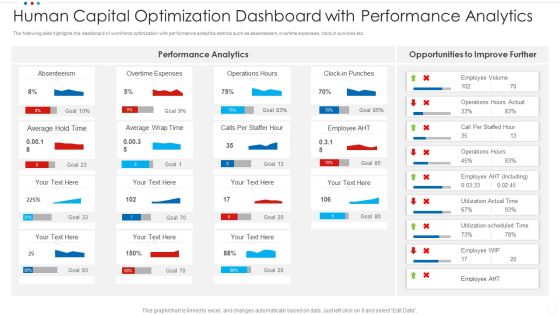
Human Capital Optimization Dashboard With Performance Analytics Infographics PDF
The following slide highlights the dashboard of workforce optimization with performance analytics metrics such as absenteeism, overtime expenses, clock in punches etc. Showcasing this set of slides titled human capital optimization dashboard with performance analytics infographics pdf. The topics addressed in these templates are average, overtime expenses, absenteeism. All the content presented in this PPT design is completely editable. Download it and make adjustments in color, background, font etc. as per your unique business setting.

Cloud Data Transformation Dashboard For Application Analytics Information PDF
This slide shows data migration best practices dashboard for application analytics. It includes information about software as a service applications, app workload analysis, migration details, document, business unit. Pitch your topic with ease and precision using this Cloud Data Transformation Dashboard For Application Analytics Information PDF. This layout presents information on Software Service Applications, App Workload Analysis, Migration Details. It is also available for immediate download and adjustment. So, changes can be made in the color, design, graphics or any other component to create a unique layout.
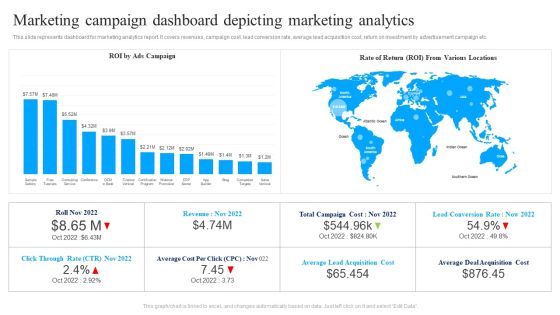
Marketing Campaign Dashboard Depicting Marketing Analytics Ppt Summary Infographics PDF
This slide represents dashboard for marketing analytics report. It covers revenues, campaign cost, lead conversion rate, average lead acquisition cost, return on investment by advertisement campaign etc. Pitch your topic with ease and precision using this Marketing Campaign Dashboard Depicting Marketing Analytics Ppt Summary Infographics PDF. This layout presents information on ROI Ads Campaign, Rate Of Return, Various Locations. It is also available for immediate download and adjustment. So, changes can be made in the color, design, graphics or any other component to create a unique layout.

Dashboard For Data Analytics Implementation Ppt Model Files PDF
This slide depicts the dashboard for data integration in the business, and it is showing real time details about expenses, profits, margins percentage, and new addition projects. Deliver and pitch your topic in the best possible manner with this dashboard for data analytics implementation ppt model files pdf. Use them to share invaluable insights on expenses, profits, analytics, data and impress your audience. This template can be altered and modified as per your expectations. So, grab it now.
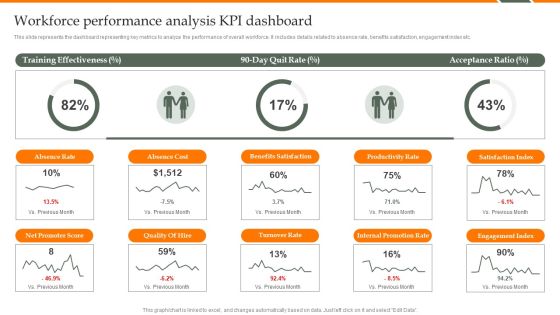
Human Resource Analytics Workforce Performance Analysis KPI Dashboard Structure PDF
This slide represents the dashboard representing key metrics to analyze the performance of overall workforce. It includes details related to absence rate, benefits satisfaction, engagement index etc. Find a pre-designed and impeccable Human Resource Analytics Workforce Performance Analysis KPI Dashboard Structure PDF. The templates can ace your presentation without additional effort. You can download these easy-to-edit presentation templates to make your presentation stand out from others. So, what are you waiting for Download the template from Slidegeeks today and give a unique touch to your presentation.

Investment Project KPI Dashboard For Construction Analytics Background PDF
This slide illustrates construction dashboard for improving capital project outcomes. It also include KPIs such as projects completion, schedule performance index, consumer price index, project status, cost breakdown, etc. Pitch your topic with ease and precision using this Investment Project KPI Dashboard For Construction Analytics Background PDF. This layout presents information on Cost Breakdown, Completion, Progress. It is also available for immediate download and adjustment. So, changes can be made in the color, design, graphics or any other component to create a unique layout.
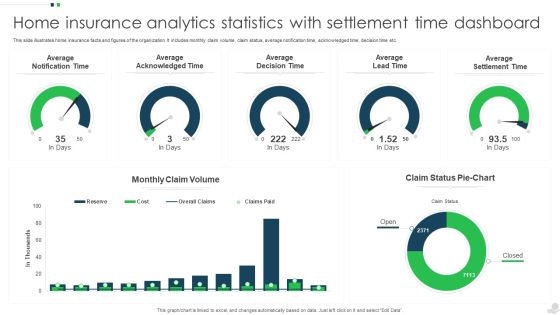
Home Insurance Analytics Statistics With Settlement Time Dashboard Ideas PDF
This slide illustrates home insurance facts and figures of the organization. It includes monthly claim volume, claim status, average notification time, acknowledged time, decision time etc. Pitch your topic with ease and precision using this Home Insurance Analytics Statistics With Settlement Time Dashboard Ideas PDF. This layout presents information on Average Acknowledged Time, Average Decision Time, Average Lead Time. It is also available for immediate download and adjustment. So, changes can be made in the color, design, graphics or any other component to create a unique layout.
Insurance Analytics Enrollment Around The World Dashboard Icons PDF
This slide illustrates total insurance enrollment of all insurance corporations. It includes monthly enrollment charts, enrollments in 2021, enrollment by scheme, enrollment levels, worldwide enrollments, enrollment age wise etc. Showcasing this set of slides titled Insurance Analytics Enrollment Around The World Dashboard Icons PDF. The topics addressed in these templates are Enrollments Levels, Enrollments Worldwide, Enrollments Age Wise. All the content presented in this PPT design is completely editable. Download it and make adjustments in color, background, font etc. as per your unique business setting.
Food Processing Industry Latest Insights Trends And Analytics KPI Dashboard For Tracking Supply Chain Costs Demonstration PDF
This slide represents the KPI dashboard to track the multiple cost associated with supply chain in food manufacturing industry. It includes information regarding cash to cash cycle in days, carry cost of inventory along with details of net sales. There are so many reasons you need a Food Processing Industry Latest Insights Trends And Analytics KPI Dashboard For Tracking Supply Chain Costs Demonstration PDF. The first reason is you can not spend time making everything from scratch, Thus, Slidegeeks has made presentation templates for you too. You can easily download these templates from our website easily.
Web Analytics And Trends Dashboard Vector Icon Ppt PowerPoint Presentation Gallery Graphic Images PDF
Presenting web analytics and trends dashboard vector icon ppt powerpoint presentation gallery graphic images pdf to dispense important information. This template comprises one stages. It also presents valuable insights into the topics including web analytics and trends dashboard vector icon. This is a completely customizable PowerPoint theme that can be put to use immediately. So, download it and address the topic impactfully.
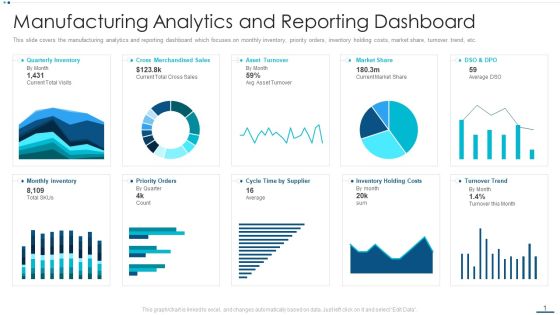
Strategic B2B Marketing Plan Manufacturing Analytics And Reporting Dashboard Rules PDF
This slide covers the manufacturing analytics and reporting dashboard which focuses on monthly inventory, priority orders, inventory holding costs, market share, turnover trend, etc.Deliver and pitch your topic in the best possible manner with this strategic b2b marketing plan manufacturing analytics and reporting dashboard rules pdf Use them to share invaluable insights on quarterly inventory, monthly inventory, cross merchandised sales and impress your audience. This template can be altered and modified as per your expectations. So, grab it now.
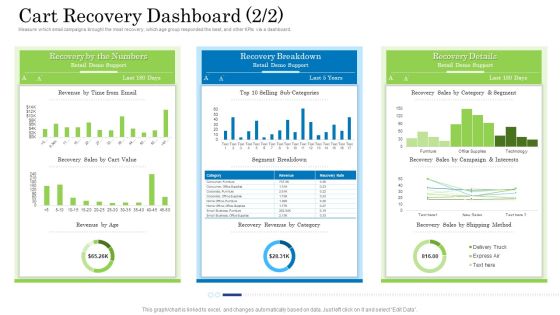
Customer Behavioral Data And Analytics Cart Recovery Dashboard Value Inspiration PDF
Measure which email campaigns brought the most recovery, which age group responded the best, and other KPIs via a dashboard. Deliver and pitch your topic in the best possible manner with this customer behavioral data and analytics cart recovery dashboard value inspiration pdf. Use them to share invaluable insights on cart recovery dashboard and impress your audience. This template can be altered and modified as per your expectations. So, grab it now.

Customer Behavioral Data And Analytics Email Engagement Dashboard Email Structure PDF
Email engagement dashboards can also capture the engagement rate depending on the device used and time spent on the emails. Deliver and pitch your topic in the best possible manner with this customer behavioral data and analytics email engagement dashboard email structure pdf. Use them to share invaluable insights on email engagement dashboard and impress your audience. This template can be altered and modified as per your expectations. So, grab it now.

Customer Behavioral Data And Analytics Cart Recovery Dashboard Revenue Background PDF
Measure which email campaigns brought the most recovery, which age group responded the best, and other KPIs via a dashboard. Deliver an awe inspiring pitch with this creative customer behavioral data and analytics cart recovery dashboard revenue background pdf bundle. Topics like recovery revenue, recovery rate, revenue per email can be discussed with this completely editable template. It is available for immediate download depending on the needs and requirements of the user.
Food Processing Industry Latest Insights Trends And Analytics Performance Monitoring Dashboard For Consumer Goods Icons PDF
This slide showcase the performance monitoring dashboard for consumer goods providing information regarding the overview of food and beverages sales, top selling products and on shelf availability. Get a simple yet stunning designed Food Processing Industry Latest Insights Trends And Analytics Performance Monitoring Dashboard For Consumer Goods Icons PDF. It is the best one to establish the tone in your meetings. It is an excellent way to make your presentations highly effective. So, download this PPT today from Slidegeeks and see the positive impacts. Our easy to edit Food Processing Industry Latest Insights Trends And Analytics Performance Monitoring Dashboard For Consumer Goods Icons PDF can be your go to option for all upcoming conferences and meetings. So, what are you waiting for Grab this template today.

1 Big Data Technology Icons Analytics Storage Replication Dashboard Magnify Ppt Slide
This image slide displays technology icons. This image slide has been crafted with graphic of big data technology icons like analytic storage, replication, dashboard and magnifying glass. This image slide may be used to express views on technology, internet and communication. This image slide will enhance the quality of your presentations.

Customer Behavioral Data And Analytics Email Engagement Dashboard Rate Designs PDF
Email engagement metrics help you understand which email campaigns saw the highest open rate and click-through rate. It also gives you an idea of how different age groups interact with your emails helping you customize the content accordingly. Deliver an awe inspiring pitch with this creative customer behavioral data and analytics email engagement dashboard rate designs pdf bundle. Topics like email engagement dashboard can be discussed with this completely editable template. It is available for immediate download depending on the needs and requirements of the user.
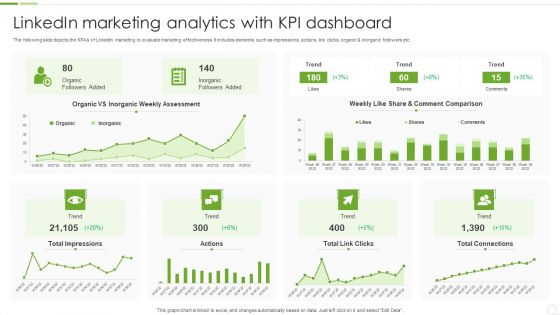
Linkedin Marketing Analytics With KPI Dashboard Ppt PowerPoint Presentation File Inspiration PDF
The following slide depicts the KPAs of LinkedIn marketing to evaluate marketing effectiveness. It includes elements such as impressions, actions, link clicks, organic and inorganic followers etc. Showcasing this set of slides titled Linkedin Marketing Analytics With KPI Dashboard Ppt PowerPoint Presentation File Inspiration PDF. The topics addressed in these templates are Total Impressions, Total Connections, Inorganic Followers Added. All the content presented in this PPT design is completely editable. Download it and make adjustments in color, background, font etc. as per your unique business setting.
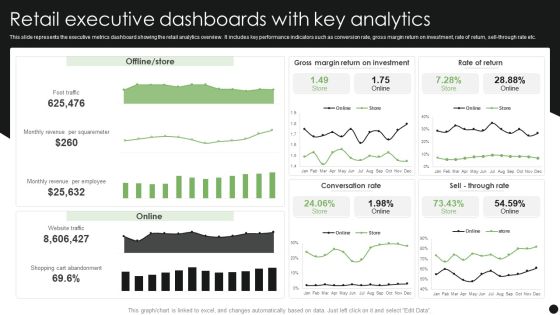
Retail Executive Dashboards With Key Analytics Guidelines PDF
Pitch your topic with ease and precision using this Retail Executive Dashboards With Key Analytics Guidelines PDF. This layout presents information on Retail Executive Dashboards, Key Analytics. It is also available for immediate download and adjustment. So, changes can be made in the color, design, graphics or any other component to create a unique layout.

HR Analytical Workforce Administration Kpi Dashboard Introduction PDF
The below slide provides an insights to various KPAs of HR analytics. It includes elements such as extra time worked, leave hours, job order wise workforce expenses, expected versus actual hours etc. Showcasing this set of slides titled HR Analytical Workforce Administration Kpi Dashboard Introduction PDF. The topics addressed in these templates are Workforce Expenses, Administration KPI Dashboard. All the content presented in this PPT design is completely editable. Download it and make adjustments in color, background, font etc. as per your unique business setting.

Data Requirements Dashboard For Social Media Analytics Professional PDF
This slide outlines data requirement dashboard for social media analysis which covers components such as total watch time, total amount of views, unique views, audience retention etc. Showcasing this set of slides titled data requirements dashboard for social media analytics professional pdf. The topics addressed in these templates are data requirements dashboard for social media analytics. All the content presented in this PPT design is completely editable. Download it and make adjustments in color, background, font etc. as per your unique business setting.
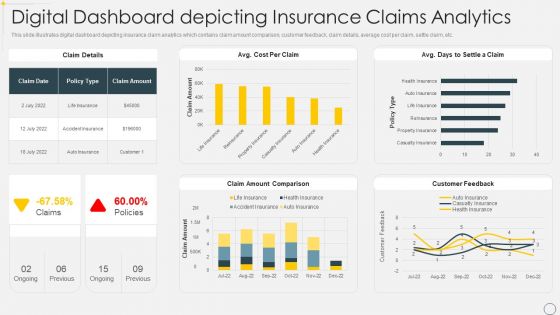
Digital Dashboard Depicting Insurance Claims Analytics Pictures PDF
This slide illustrates digital dashboard depicting insurance claim analytics which contains claim amount comparison, customer feedback, claim details, average cost per claim, settle claim, etc. Showcasing this set of slides titled Digital Dashboard Depicting Insurance Claims Analytics Pictures PDF. The topics addressed in these templates are Policy, Cost, Comparison. All the content presented in this PPT design is completely editable. Download it and make adjustments in color, background, font etc. as per your unique business setting.

KPI Dashboard For Monitoring Recruitment Analytics Professional PDF
The slide depicts the dashboard of recruitment analytics monitoring depicting candidate by source, candidate workflow, candidate status, new application, application source vs hired and reasons for decline. Do you have to make sure that everyone on your team knows about any specific topic I yes, then you should give KPI Dashboard For Monitoring Recruitment Analytics Professional PDF a try. Our experts have put a lot of knowledge and effort into creating this impeccable KPI Dashboard For Monitoring Recruitment Analytics Professional PDF. You can use this template for your upcoming presentations, as the slides are perfect to represent even the tiniest detail. You can download these templates from the Slidegeeks website and these are easy to edit. So grab these today.
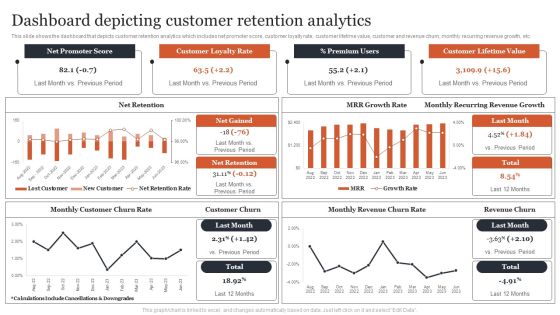
Managing Customer Attrition Dashboard Depicting Customer Retention Analytics Formats PDF
This slide shows the dashboard that depicts customer retention analytics which includes net promoter score, customer loyalty rate, customer lifetime value, customer and revenue churn, monthly recurring revenue growth, etc. Get a simple yet stunning designed Managing Customer Attrition Dashboard Depicting Customer Retention Analytics Formats PDF. It is the best one to establish the tone in your meetings. It is an excellent way to make your presentations highly effective. So, download this PPT today from Slidegeeks and see the positive impacts. Our easy-to-edit Managing Customer Attrition Dashboard Depicting Customer Retention Analytics Formats PDF can be your go-to option for all upcoming conferences and meetings. So, what are you waiting for Grab this template today.

Business Analytics Application Workforce Performance Analysis KPI Dashboard Template PDF
This slide represents the dashboard representing key metrics to analyze the performance of overall workforce. It includes details related to absence rate, benefits satisfaction, engagement index etc. Take your projects to the next level with our ultimate collection of Business Analytics Application Workforce Performance Analysis KPI Dashboard Template PDF. Slidegeeks has designed a range of layouts that are perfect for representing task or activity duration, keeping track of all your deadlines at a glance. Tailor these designs to your exact needs and give them a truly corporate look with your own brand colors theyll make your projects stand out from the rest.

KPI Dashboard For Marketing Website Analytics Summary PDF
The following slide exhibits detailed view of companys revenue-related website metrics. It helps in determining initiatives and areas for organisational improvement. It includes information about visitors, gross volume, etc. Pitch your topic with ease and precision using this KPI Dashboard For Marketing Website Analytics Summary PDF. This layout presents information on Visitors, Leads, Qualified Leads, Customers, Gross Volume, Successful Payment. It is also available for immediate download and adjustment. So, changes can be made in the color, design, graphics or any other component to create a unique layout.
Predictive Analytics Methods Predictive Analytics Model Performance Tracking Dashboard Structure PDF
This slide represents the predictive analytics model performance tracking dashboard, and it covers the details of total visitors, total buyers, total products added to the cart, filters by date and category, visitors to clients conversion rate, and so on. Want to ace your presentation in front of a live audience Our Predictive Analytics Methods Predictive Analytics Model Performance Tracking Dashboard Structure PDF can help you do that by engaging all the users towards you. Slidegeeks experts have put their efforts and expertise into creating these impeccable powerpoint presentations so that you can communicate your ideas clearly. Moreover, all the templates are customizable, and easy to edit and downloadable. Use these for both personal and commercial use.

Retail Outlet Operational Efficiency Analytics Social Media Dashboards For Retail Store Slides PDF
This slide showcase dashboard for retail store social media channels performance in terms of reach, new fans, engagement, shares, likes, comments etc. Deliver and pitch your topic in the best possible manner with this Retail Outlet Operational Efficiency Analytics Social Media Dashboards For Retail Store Slides PDF. Use them to share invaluable insights on Social Media Channels, Performance Snapshot, Total Followers and impress your audience. This template can be altered and modified as per your expectations. So, grab it now.
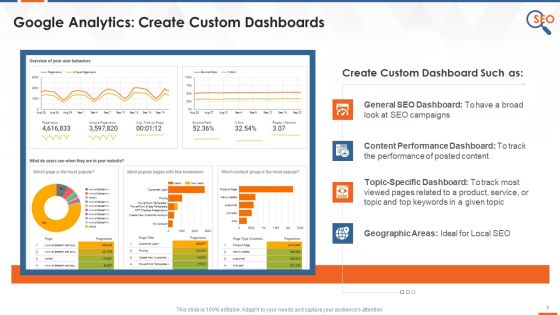
Google Analytics SEO Tool To Create Custom Dashboards Training Ppt
This slide showcases how the Google Analytics tool can be used to create custom dashboards such as content performance dashboard, topic-specific dashboard, etc.

Dashboard For Big Healthcare Data Analytics Graphics PDF
This slide showcase the dashboard for big data analytics in healthcare. It includes elements such as bed occupancy rate, patient turnover rate, efficiency and costs, missed and cancelled appointment rate. Showcasing this set of slides titled Dashboard For Big Healthcare Data Analytics Graphics PDF. The topics addressed in these templates are Satisfaction Service Indicators, Occupancy, Forecasted Patient Turnover. All the content presented in this PPT design is completely editable. Download it and make adjustments in color, background, font etc. as per your unique business setting.

Dashboard Depicting Sales And Customer Analytics Infographics PDF
This slide focuses on dashboard that depicts sales and customer analytics which covers sales revenue, average transaction rate, out of stock items, sales by division, monthly visitors, etc. If you are looking for a format to display your unique thoughts, then the professionally designed Dashboard Depicting Sales And Customer Analytics Infographics PDF is the one for you. You can use it as a Google Slides template or a PowerPoint template. Incorporate impressive visuals, symbols, images, and other charts. Modify or reorganize the text boxes as you desire. Experiment with shade schemes and font pairings. Alter, share or cooperate with other people on your work. Download Dashboard Depicting Sales And Customer Analytics Infographics PDF and find out how to give a successful presentation. Present a perfect display to your team and make your presentation unforgettable.

Dashboard Depicting Sales And Customer Analytics Professional PDF
This slide focuses on dashboard that depicts sales and customer analytics which covers sales revenue, average transaction rate, out of stock items, sales by division, monthly visitors, etc. Make sure to capture your audiences attention in your business displays with our gratis customizable Dashboard Depicting Sales And Customer Analytics Professional PDF. These are great for business strategies, office conferences, capital raising or task suggestions. If you desire to acquire more customers for your tech business and ensure they stay satisfied, create your own sales presentation with these plain slides.

Dashboarding Showcasing Employee Information Analytics With Employee Productivity Slides PDF
This slide represents dashboarding showcasing workforce data analysis and assessment to monitor employee engagement. It provides information regarding average productivity, no. of departments, total employees and activity stats. Pitch your topic with ease and precision using this Dashboarding Showcasing Employee Information Analytics With Employee Productivity Slides PDF. This layout presents information on Reimbursement, Productive, Workforce Productivity Stats. It is also available for immediate download and adjustment. So, changes can be made in the color, design, graphics or any other component to create a unique layout.

Predictive Data Model Predictive Analytics Model Performance Tracking Dashboard Themes PDF
This slide represents the predictive analytics model performance tracking dashboard, and it covers the details of total visitors, total buyers, total products added to the cart, filters by date and category, visitors to clients conversion rate, and so on. Find a pre-designed and impeccable Predictive Data Model Predictive Analytics Model Performance Tracking Dashboard Themes PDF. The templates can ace your presentation without additional effort. You can download these easy-to-edit presentation templates to make your presentation stand out from others. So, what are you waiting for Download the template from Slidegeeks today and give a unique touch to your presentation.

Analyzing And Deploying Human Resource Analytics Key Performance Metrics Dashboard Themes PDF
This slide shows dashboard of the human resource analytics software. It includes details related to open positions, conversion ratio, offer accepted, cost of hiring by grade etc. Do you have to make sure that everyone on your team knows about any specific topic I yes, then you should give Analyzing And Deploying Human Resource Analytics Key Performance Metrics Dashboard Themes PDF a try. Our experts have put a lot of knowledge and effort into creating this impeccable Analyzing And Deploying Human Resource Analytics Key Performance Metrics Dashboard Themes PDF. You can use this template for your upcoming presentations, as the slides are perfect to represent even the tiniest detail. You can download these templates from the Slidegeeks website and these are easy to edit. So grab these today.

Marketing Performance Dashboard With Analytics Campaign Ppt Infographics Background Images PDF
This slide represents dashboard for campaign performance analytics report. It covers total clicks, CTR, impressions , view-through conversions , total conversion, lead generation, activity per click etc to track campaign progress. Showcasing this set of slides titled Marketing Performance Dashboard With Analytics Campaign Ppt Infographics Background Images PDF. The topics addressed in these templates are Total Clicks, Total Impressions, Total Conversions, Activity Per Click. All the content presented in this PPT design is completely editable. Download it and make adjustments in color, background, font etc. as per your unique business setting.
Predictive Analytics Model Performance Tracking Dashboard Forward Looking Analysis IT Introduction PDF
This slide represents the predictive analytics model performance tracking dashboard, and it covers the details of total visitors, total buyers, total products added to the cart, filters by date and category, visitors to clients conversion rate, and so on.The Predictive Analytics Model Performance Tracking Dashboard Forward Looking Analysis IT Introduction PDF is a compilation of the most recent design trends as a series of slides. It is suitable for any subject or industry presentation, containing attractive visuals and photo spots for businesses to clearly express their messages. This template contains a variety of slides for the user to input data, such as structures to contrast two elements, bullet points, and slides for written information. Slidegeeks is prepared to create an impression.
Statistical Data Dashboard Icon Depicting Analytical Figures Sample PDF
Persuade your audience using this statistical data dashboard icon depicting analytical figures sample pdf. This PPT design covers four stages, thus making it a great tool to use. It also caters to a variety of topics including statistical data dashboard icon depicting analytical figures. Download this PPT design now to present a convincing pitch that not only emphasizes the topic but also showcases your presentation skills.

Dashboard For Monthly Recruitment Metrics And Analytics Themes PDF
The slide depicts the dashboard for monthly recruitment metrics and analytics depicting monthly recruitment, recruitment by department and source, candidate feedback and offer acceptance rate.Showcasing this set of slides titled Dashboard For Monthly Recruitment Metrics And Analytics Themes PDF The topics addressed in these templates are Recruitment Department, Recruitment Source, Interview Activity All the content presented in this PPT design is completely editable. Download it and make adjustments in color, background, font etc. as per your unique business setting.
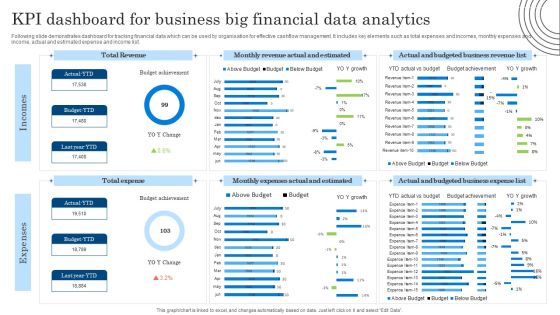
KPI Dashboard For Business Big Financial Data Analytics Diagrams PDF
Following slide demonstrates dashboard for tracking financial data which can be used by organisation for effective cashflow management. It includes key elements such as total expenses and incomes, monthly expenses and income, actual and estimated expense and income list. Showcasing this set of slides titled KPI Dashboard For Business Big Financial Data Analytics Diagrams PDF. The topics addressed in these templates are KPI Dashboard, Business Big Financial, Data Analytics. All the content presented in this PPT design is completely editable. Download it and make adjustments in color, background, font etc. as per your unique business setting.

Dashboard Showing Website Analytics And Performance Ppt PowerPoint Presentation Portfolio Inspiration PDF
Persuade your audience using this dashboard showing website analytics and performance ppt powerpoint presentation portfolio inspiration pdf. This PPT design covers four stages, thus making it a great tool to use. It also caters to a variety of topics including dashboard showing website analytics and performance. Download this PPT design now to present a convincing pitch that not only emphasizes the topic but also showcases your presentation skills.
Service Level Agreement KPI Dashboard Icon With Analytics And Interfaces Download PDF
Presenting Service Level Agreement KPI Dashboard Icon With Analytics And Interfaces Download PDF to dispense important information. This template comprises three stages. It also presents valuable insights into the topics including Service Level Agreement, KPI Dashboard Icon, Analytics And Interfaces. This is a completely customizable PowerPoint theme that can be put to use immediately. So, download it and address the topic impactfully.

Dashboard Showing Business Analytics Vector Icon Ppt PowerPoint Presentation Model Templates PDF
Presenting dashboard showing business analytics vector icon ppt powerpoint presentation model templates pdf to dispense important information. This template comprises three stages. It also presents valuable insights into the topics including dashboard showing business analytics vector icon. This is a completely customizable PowerPoint theme that can be put to use immediately. So, download it and address the topic impactfully.
Interactive Dashboard For Website Analytics Vector Icon Ppt PowerPoint Presentation Icon Background Images PDF
Showcasing this set of slides titled interactive dashboard for website analytics vector icon ppt powerpoint presentation icon background images pdf. The topics addressed in these templates are interactive dashboard for website analytics vector icon. All the content presented in this PPT design is completely editable. Download it and make adjustments in color, background, font etc. as per your unique business setting.
 Home
Home