Agenda Infographic

Business Case Document With Name Function And Date Ppt PowerPoint Presentation Infographics Pictures
This is a business case document with name function and date ppt powerpoint presentation infographics pictures. This is a four stage process. The stages in this process are project management, project charter, program charter.

Six Factors In Project Success Ppt PowerPoint Presentation Infographics Designs Download
This is a six factors in project success ppt powerpoint presentation infographics designs download. This is a six stage process. The stages in this process are project management, project charter, program charter.

Corporate Event Planning Management Brand Event Management Timeline Goals Ppt Infographics Background PDF
Presenting this set of slides with name corporate event planning management brand event management timeline goals ppt infographics background pdf. The topics discussed in these slides are define event goals, source venue options, compose sponsorship strategy, finalize speaker reach out list, optimize seo ranking. This is a completely editable PowerPoint presentation and is available for immediate download. Download now and impress your audience.

Construction Project Planning And Management Report Ppt PowerPoint Presentation Infographics Topics PDF
Pitch your topic with ease and precision using this construction project planning and management report ppt powerpoint presentation infographics topics pdf. This layout presents information on project, architect, project manager, required documentation, equipment list, building permits. It is also available for immediate download and adjustment. So, changes can be made in the color, design, graphics or any other component to create a unique layout.

Category Plan Management Chart With Geographical Scope Ppt Infographics Designs Download PDF
Showcasing this set of slides titled category plan management chart with geographical scope ppt infographics designs download pdf. The topics addressed in these templates are opportunities, investment, impact on operations. All the content presented in this PPT design is completely editable. Download it and make adjustments in color, background, font etc. as per your unique business setting.

Developing Content Strategy Timeframe And Investment Table Of Content Creation Ppt Infographics Gridlines PDF
Deliver and pitch your topic in the best possible manner with this developing content strategy timeframe and investment table of content creation ppt infographics gridlines pdf. Use them to share invaluable insights on phase, description, time span, amount and impress your audience. This template can be altered and modified as per your expectations. So, grab it now.

Graph Pattern For Network Analysis Ppt PowerPoint Presentation Infographics Graphics Template
This is a graph pattern for network analysis ppt powerpoint presentation infographics graphics template. This is a two stage process. The stages in this process are graph theory, chart theory, business.

Interconnected Graph With World Map In Background Ppt PowerPoint Presentation Infographics Slide
This is a interconnected graph with world map in background ppt powerpoint presentation infographics slide. This is a three stage process. The stages in this process are graph theory, chart theory, business.

Managing CFO Services Actual Vs Expected Bookkeeping Records Ppt Infographics Example PDF
Presenting this set of slides with name managing cfo services actual vs expected bookkeeping records ppt infographics example pdf. The topics discussed in these slides are cash paid out, cash receipt. This is a completely editable PowerPoint presentation and is available for immediate download. Download now and impress your audience.

Drawing Of Gear With Text Holders Ppt PowerPoint Presentation Infographics Brochure
This is a drawing of gear with text holders ppt powerpoint presentation infographics brochure. This is a one stage process. The stages in this process are drawing, sketch, outline.

Drawing Of Red Yellow And Green Arrows Ppt PowerPoint Presentation Infographics Design Ideas
This is a wing of red yellow and green arrows ppt powerpoint presentation infographics design ideas. This is a one stage process. The stages in this process are hand drawn arrow, hand outlined arrow, hand designed.
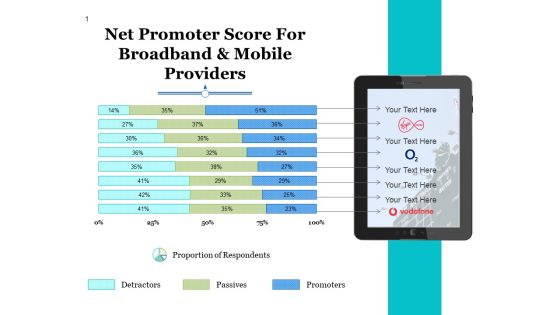
Net Promoter Score For Broadband And Mobile Providers Ppt PowerPoint Presentation Infographics Outfit
This is a net promoter score for broadband and mobile providers ppt powerpoint presentation infographics outfit. This is a three stage process. The stages in this process are net promoter score, broadband, mobile providers, detractor, passives.
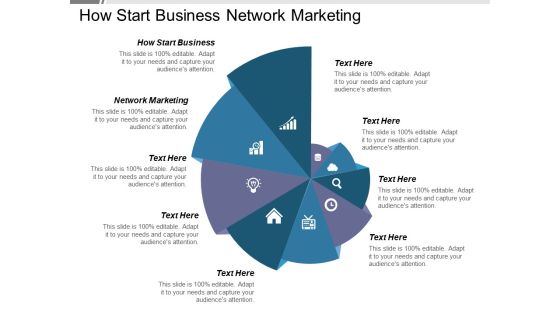
How Start Business Network Marketing Ppt PowerPoint Presentation Infographics Example File
This is a how start business network marketing ppt powerpoint presentation infographics example file. This is a nine stage process. The stages in this process are how start business, network marketing.

Key Performance Indicators In Supply Chain Order Accuracy And Cycle Time Ppt PowerPoint Presentation Infographics Slideshow
This is a key performance indicators in supply chain order accuracy and cycle time ppt powerpoint presentation infographics slideshow. This is a two stage process. The stages in this process are logistics performance, logistics dashboard, logistics kpis.
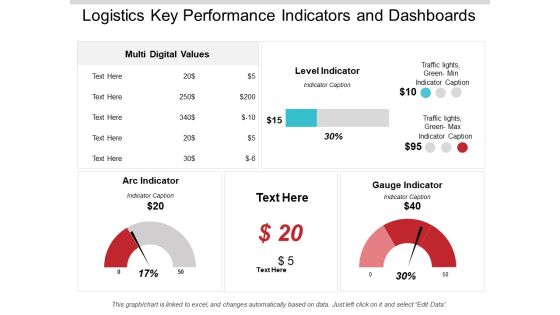
Logistics Key Performance Indicators And Dashboards Ppt PowerPoint Presentation Infographics Background Image
This is a logistics key performance indicators and dashboards ppt powerpoint presentation infographics background image. This is a three stage process. The stages in this process are logistics performance, logistics dashboard, logistics kpis.

Online Market Intelligence Social Media Analytics Ppt PowerPoint Presentation Infographics Themes
This is a online market intelligence social media analytics ppt powerpoint presentation infographics themes. This is a five stage process. The stages in this process are digital analytics, digital dashboard, marketing.

Waterfall Graph Showing Net Sales And Gross Profit Ppt PowerPoint Presentation Infographics Format
This is a waterfall graph showing net sales and gross profit ppt powerpoint presentation infographics format. This is a three stage process. The stages in this process are profit and loss, balance sheet, income statement, benefit and loss.

B2B Lead Generation Plan B2b Buyer Nurturing Content Program For Active Engagement Infographics PDF
This slide provides information regarding B2B buyer nurturing content program for active engagement through key content nurturing activities through webinar, email etc. on monthly basis. Deliver an awe inspiring pitch with this creative b2b lead generation plan b2b buyer nurturing content program for active engagement infographics pdf bundle. Topics like b2b buyer nurturing content program for active engagement can be discussed with this completely editable template. It is available for immediate download depending on the needs and requirements of the user.
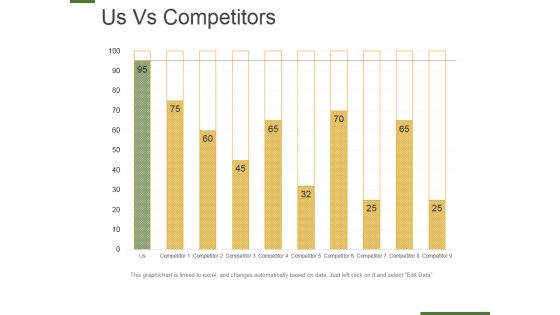
Us Vs Competitors Template 1 Ppt PowerPoint Presentation Infographics Example Introduction
This is a us vs competitors template 1 ppt powerpoint presentation infographics example introduction. This is a ten stage process. The stages in this planning, management, strategy, marketing, business.
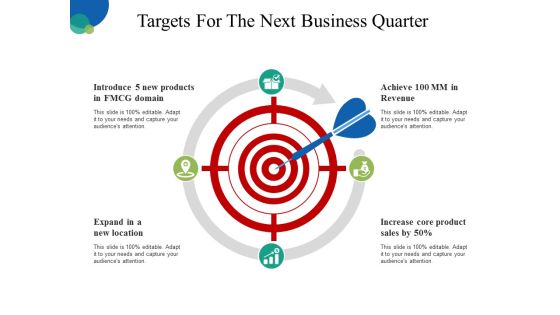
Targets For The Next Business Quarter Ppt PowerPoint Presentation Infographics Inspiration
This is a targets for the next business quarter ppt powerpoint presentation infographics inspiration . This is a four stage process. The stages in this process are business, planning, marketing, strategy, our goal.

Opportunity And Challenges Challenges Opportunities Compettion Ppt PowerPoint Presentation Infographics Shapes
This is a opportunity and challenges challenges opportunities compettion ppt powerpoint presentation infographics shapes. This is a two stage process. The stages in this process are opportunities, challenges, business, planning, marketing.

Four Steps To Find Business Opportunities Ppt PowerPoint Presentation Infographics Background
This is a four steps to find business opportunities ppt powerpoint presentation infographics background. This is a four stage process. The stages in this process are 4 step approach, 4 step process, 4 step plan.
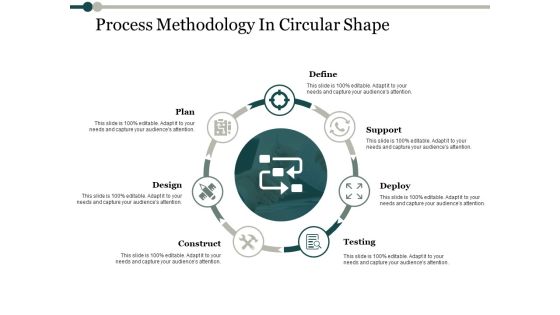
Process Methodology In Circular Shape Process Analysis Ppt PowerPoint Presentation Infographics Show
This is a process methodology in circular shape process analysis ppt powerpoint presentation infographics show. This is a seven stage process. The stages in this process are plan, support, deploy, testing, construct.

assign a buddy mentor for every newcomer ppt powerpoint presentation infographics gallery
This is a assign a buddy mentor for every newcomer ppt powerpoint presentation infographics gallery. This is a four stage process. The stages in this process are marketing, business, management, planning, strategy.

Economic Cost Efficiency Optimize The Resources Ppt PowerPoint Presentation Infographics Model
This is a economic cost efficiency optimize the resources ppt powerpoint presentation infographics model. This is a five stage process. The stages in this process are cost planning, cost efficiency, cost organization.

Brand Positioning In The Market Ppt PowerPoint Presentation Infographics Background Image
This is a brand positioning in the market ppt powerpoint presentation infographics background image. This is a four stage process. The stages in this process are marketing plan, market positioning, brand positioning.

Risk Impact And Probability Analysis Performance Ppt Powerpoint Presentation Infographics Deck
This is a risk impact and probability analysis performance ppt powerpoint presentation infographics deck. This is a five stage process. The stages in this process are business, management, planning, strategy, marketing.

Supplier Performance Management Scorecard Business Ppt Powerpoint Presentation Infographics Slide Portrait
This is a supplier performance management scorecard business ppt powerpoint presentation infographics slide portrait. This is a five stage process. The stages in this process are business, management, planning, strategy, marketing.
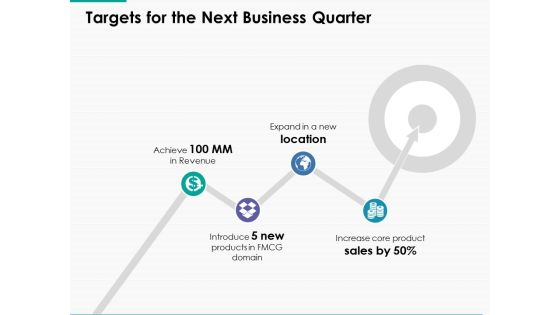
Targets For The Next Business Quarter Ppt Powerpoint Presentation Infographics Templates
This is a targets for the next business quarter ppt powerpoint presentation infographics templates. This is a four stage process. The stages in this process are business, management, planning, strategy, marketing.
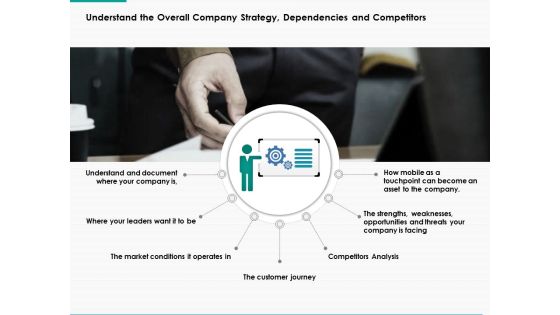
Understand The Overall Company Strategy Dependencies And Competitors Ppt Powerpoint Presentation Infographics Example File
This is a understand the overall company strategy dependencies and competitors ppt powerpoint presentation infographics example file. This is a seven stage process. The stages in this process are business, management, planning, strategy, marketing.

Tools And Techniques Of Inventory Management Ppt Powerpoint Presentation Infographics Show
This is a tools and techniques of inventory management ppt powerpoint presentation infographics show. This is a four stage process. The stages in this process are business, management, planning, strategy, marketing.

Our Team Communication Ppt Powerpoint Presentation Inspiration Infographics Ppt Powerpoint Presentation Introduction
This is a our team communication ppt powerpoint presentation inspiration infographics ppt powerpoint presentation introduction. This is a three stage process. The stages in this process are our team, communication, management, planning, business.
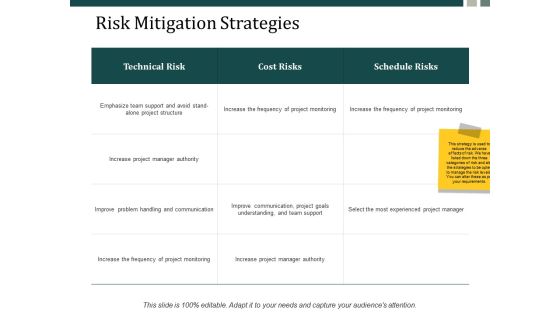
Risk Mitigation Strategies Ppt Powerpoint Presentation Inspiration Images Ppt Powerpoint Presentation Infographics Layout Ideas
This is a risk mitigation strategies ppt powerpoint presentation inspiration images ppt powerpoint presentation infographics layout ideas. This is a three stage process. The stages in this process are business, management, planning, strategy, marketing.

Different Media Platforms For Marketing Ppt PowerPoint Presentation Infographics Background Designs
This is a different media platforms for marketing ppt powerpoint presentation infographics background designs. This is a eight stage process. The stages in this process are strategic, planning, business, management, marketing.
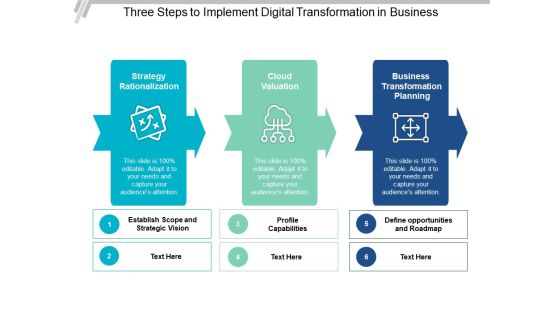
Three Steps To Implement Digital Transformation In Business Ppt PowerPoint Presentation Infographics Shapes
This is a three steps to implement digital transformation in business ppt powerpoint presentation infographics shapes. This is a six stage process. The stages in this process are cloud strategy, cloud planning, cloud management.

Bulb Or Idea Technology Marketing Ppt Powerpoint Presentation Infographics Example Topics
This is a bulb or idea technology marketing ppt powerpoint presentation infographics example topics. This is a four stage process. The stages in this process are bulb, idea, technology, marketing, planning.
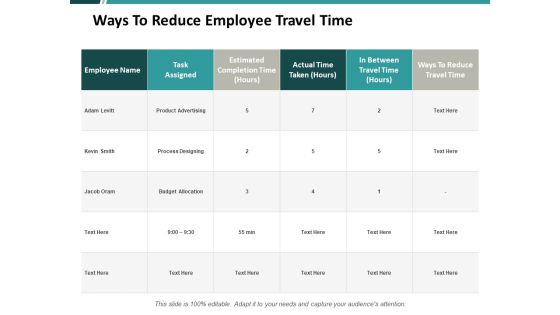
Ways To Reduce Employee Travel Time Ppt PowerPoint Presentation Infographics Ideas
This is a ways to reduce employee travel time ppt powerpoint presentation infographics ideas. This is a three stage process. The stages in this process are compare, marketing, business, management, planning.
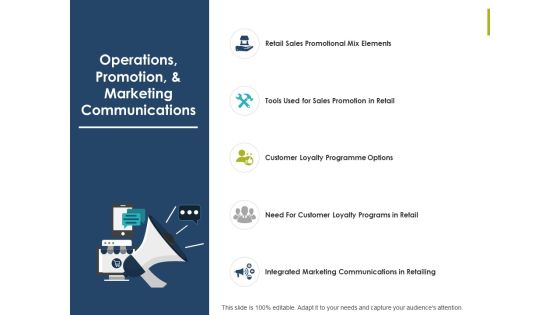
Operations Promotion And Marketing Communications Ppt PowerPoint Presentation Infographics Graphics Template
This is a operations promotion and marketing communications ppt powerpoint presentation infographics graphics template. This is a five stage process. The stages in this process are marketing, business, management, planning, strategy.

Tools Used For Sales Promotion In Retail Ppt PowerPoint Presentation Infographics Slide
This is a tools used for sales promotion in retail ppt powerpoint presentation infographics slide. This is a three stage process. The stages in this process are marketing, business, management, planning, strategy.

Assessment And Market Position Of Competitors Product Product Range Ppt PowerPoint Presentation Infographics Backgrounds
This is a assessment and market position of competitors product product range ppt powerpoint presentation infographics backgrounds. This is a seven stage process. The stages in this process are compare, marketing, business, management, planning.
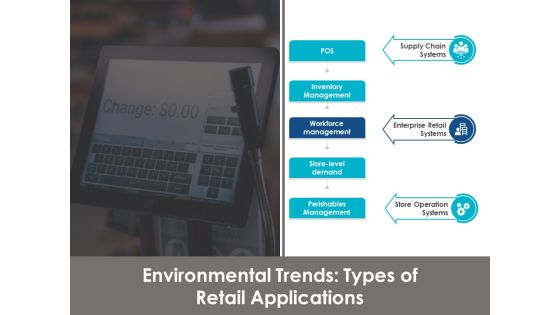
Environmental Trends Types Of Retail Applications Ppt Powerpoint Presentation Infographics Graphics
This is a environmental trends types of retail applications ppt powerpoint presentation infographics graphics. This is a eight stage process. The stages in this process are technology, management, planning, strategy.
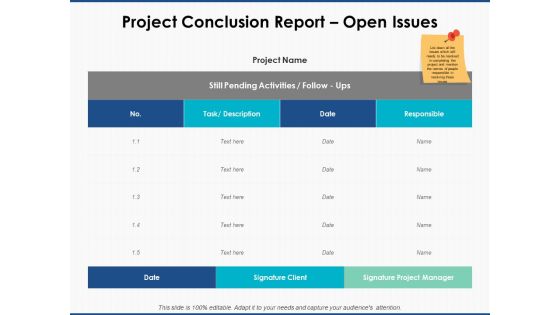
Project Conclusion Report Open Issues Ppt PowerPoint Presentation Infographics Graphics Example
This is a project conclusion report open issues ppt powerpoint presentation infographics graphics example. This is a four stage process. The stages in this process are compare, marketing, business, management, planning.
Performance Evaluation In Energy Sector Icons Slide Ppt PowerPoint Presentation Infographics Slide Portrait
This is a performance evaluation in energy sector icons slide ppt powerpoint presentation infographics slide portrait. The topics discussed in this diagram are management, planning, business, marketing. This is a completely editable PowerPoint presentation, and is available for immediate download.

Assessing The Current Hr Capacity Ppt PowerPoint Presentation Infographics Designs Download
This is a assessing the current hr capacity ppt powerpoint presentation infographics designs download. This is a six stage process. The stages in this process are compare, marketing, business, management, planning.
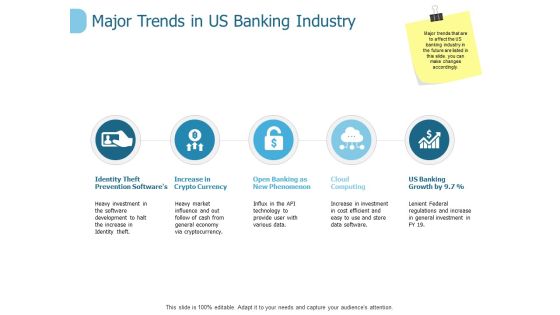
Major Trends In Us Banking Industry Ppt PowerPoint Presentation Infographics Graphic Tips
This is a major trends in us banking industry ppt powerpoint presentation infographics graphic tips. This is a five stage process. The stages in this process are process, business, management, planning, strategy.
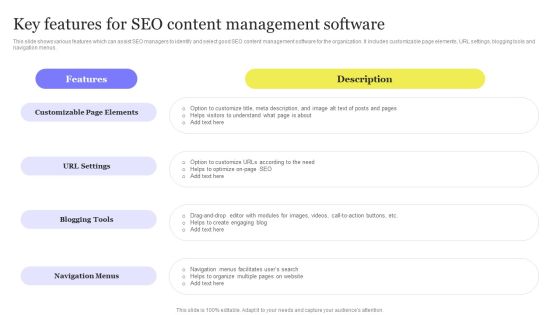
Enhancing Digital Visibility Using SEO Content Strategy Key Features For SEO Content Management Software Infographics PDF
This slide shows various features which can assist SEO managers to identify and select good SEO content management software for the organization. It includes customizable page elements, URL settings, blogging tools and navigation menus. Crafting an eye catching presentation has never been more straightforward. Let your presentation shine with this tasteful yet straightforward Enhancing Digital Visibility Using SEO Content Strategy Key Features For SEO Content Management Software Infographics PDF template. It offers a minimalistic and classy look that is great for making a statement. The colors have been employed intelligently to add a bit of playfulness while still remaining professional. Construct the ideal Enhancing Digital Visibility Using SEO Content Strategy Key Features For SEO Content Management Software Infographics PDF that effortlessly grabs the attention of your audience. Begin now and be certain to wow your customers.
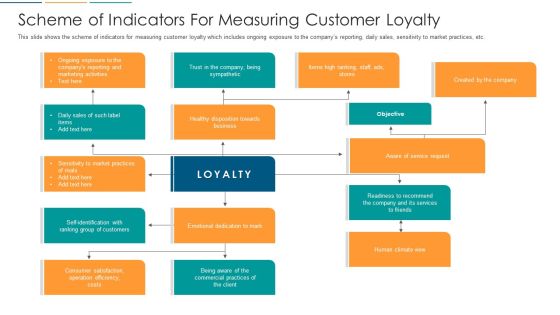
Scheme Of Indicators For Measuring Customer Loyalty Ppt Infographics Graphics Pictures PDF
This slide shows the scheme of indicators for measuring customer loyalty which includes ongoing exposure to the companys reporting, daily sales, sensitivity to market practices, etc. Deliver and pitch your topic in the best possible manner with this scheme of indicators for measuring customer loyalty ppt infographics graphics pictures pdf. Use them to share invaluable insights on scheme of indicators for measuring customer loyalty and impress your audience. This template can be altered and modified as per your expectations. So, grab it now.

Testing Of Application Programming Interface Software Testing With Postman Tool Icon Infographics PDF
Showcasing this set of slides titled Testing Of Application Programming Interface Software Testing With Postman Tool Icon Infographics PDF. The topics addressed in these templates are Testing Application, Interface Software, Postman Tool. All the content presented in this PPT design is completely editable. Download it and make adjustments in color, background, font etc. as per your unique business setting.

Consumer Retargeting Techniques Scheduling Retargeting Ads With The Reach And Frequency Of Buying Type Infographics PDF
This slide covers strategies for scheduling retargeting ads. It includes scheduling ads based on a particular time of the day and specific dates. It also includes scheduling examples such as promoting breakfast foods in the morning, driving awareness of a new brand leading up to its debut, etc. Deliver and pitch your topic in the best possible manner with this Consumer Retargeting Techniques Scheduling Retargeting Ads With The Reach And Frequency Of Buying Type Infographics PDF. Use them to share invaluable insights on Drive Awareness, Upcoming Premiere, Brand Leading and impress your audience. This template can be altered and modified as per your expectations. So, grab it now.

Illustrative Data Structure Five Years Roadmap For Business Intelligence Programs Infographics
We present our illustrative data structure five years roadmap for business intelligence programs infographics. This PowerPoint layout is easy-to-edit so you can change the font size, font type, color, and shape conveniently. In addition to this, the PowerPoint layout is Google Slides compatible, so you can share it with your audience and give them access to edit it. Therefore, download and save this well-researched illustrative data structure five years roadmap for business intelligence programs infographics in different formats like PDF, PNG, and JPG to smoothly execute your business plan.

Content Marketing Performance Template 1 Ppt PowerPoint Presentation Infographics Graphics Example
This is a content marketing performance template 1 ppt powerpoint presentation infographics graphics example. This is a eight stage process. The stages in this process are brand awareness, engagement, sales, lead generation, customer retention lead nurturing, upsell.

Table Of Contents For Manufacturing And Operation Quality Improvement Practices Tools And Templates Results Infographics PDF
Deliver and pitch your topic in the best possible manner with this table of contents for manufacturing and operation quality improvement practices tools and templates results infographics pdf. Use them to share invaluable insights on objectives and key results, six sigma, theory of constraints, zero defects, value stream mapping and impress your audience. This template can be altered and modified as per your expectations. So, grab it now.

Cost Efficiency Of Different Transportation Modes Stand Out Digital Supply Chain Tactics Infographics PDF
Whether you have daily or monthly meetings, a brilliant presentation is necessary. Cost Efficiency Of Different Transportation Modes Stand Out Digital Supply Chain Tactics Infographics PDF can be your best option for delivering a presentation. Represent everything in detail using Cost Efficiency Of Different Transportation Modes Stand Out Digital Supply Chain Tactics Infographics PDF and make yourself stand out in meetings. The template is versatile and follows a structure that will cater to your requirements. All the templates prepared by Slidegeeks are easy to download and edit. Our research experts have taken care of the corporate themes as well. So, give it a try and see the results.

Activity Schedule Map For Successfully Implementing Pre Launch Activities Marketing Infographics PDF
This slide signifies the activity schedule map for implementing pre launch activities marketing. It covers information about activity like use of landing page, develop Press kit, promote backlinks and host events. Showcasing this set of slides titled Activity Schedule Map For Successfully Implementing Pre Launch Activities Marketing Infographics PDF The topics addressed in these templates are Develop And Promote Backlinks, Promote Brand, Influencer Marketing Strategy. All the content presented in this PPT design is completely editable. Download it and make adjustments in color, background, font etc. as per your unique business setting.

SPI Methodology Project Improvement Milestone Schedule Ppt PowerPoint Presentation File Infographics PDF
This slide provides the glimpse about the project improvement milestone schedule which focuses on various process areas such as project kick off, initial assessment, process areas implementation, progress assessment, formal project assessment and project closeout. Deliver and pitch your topic in the best possible manner with this spi methodology project improvement milestone schedule ppt powerpoint presentation file infographics pdf. Use them to share invaluable insights on process areas, implementation and support, project assessment, progress assessment and impress your audience. This template can be altered and modified as per your expectations. So, grab it now.
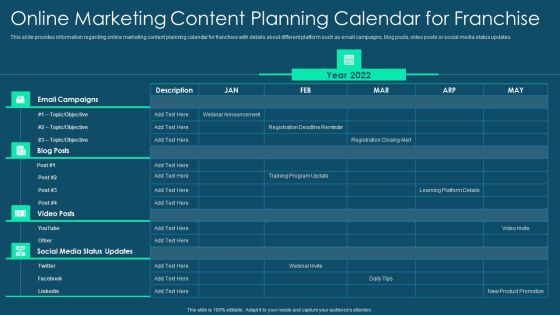
Franchise Promotion And Advertising Playbook Online Marketing Content Planning Calendar For Franchise Infographics PDF
This slide provides information regarding online marketing content planning calendar for franchise with details about different platform such as email campaigns, blog posts, video posts or social media status updates. Deliver an awe inspiring pitch with this creative franchise promotion and advertising playbook online marketing content planning calendar for franchise infographics pdf bundle. Topics like online marketing content planning calendar for franchise can be discussed with this completely editable template. It is available for immediate download depending on the needs and requirements of the user.
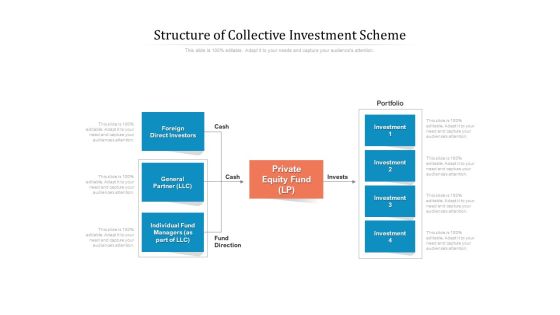
Structure Of Collective Investment Scheme Ppt PowerPoint Presentation Infographics Template PDF
Presenting this set of slides with name structure of collective investment scheme ppt powerpoint presentation infographics template pdf. This is a four stage process. The stages in this process are foreign, direct investors, general partner llc, individual fund managers as part of llc, investment, portfolio, private equity fund lp. This is a completely editable PowerPoint presentation and is available for immediate download. Download now and impress your audience.
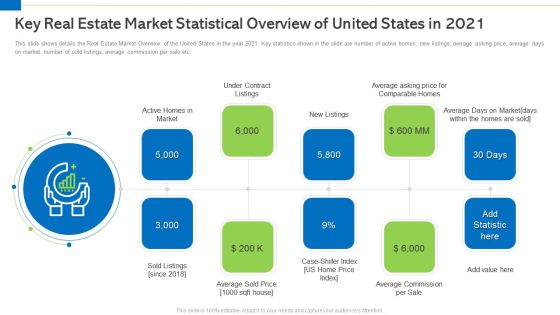
Key Real Estate Market Statistical Overview Of United States In 2021 Infographics PDF
This is a key real estate market statistical overview of united states in 2021 infographics pdf template with various stages. Focus and dispense information on eight stages using this creative set, that comes with editable features. It contains large content boxes to add your information on topics like active homes in market, under contract listings, sold listings, average sold price, average commission per sale. You can also showcase facts, figures, and other relevant content using this PPT layout. Grab it now.
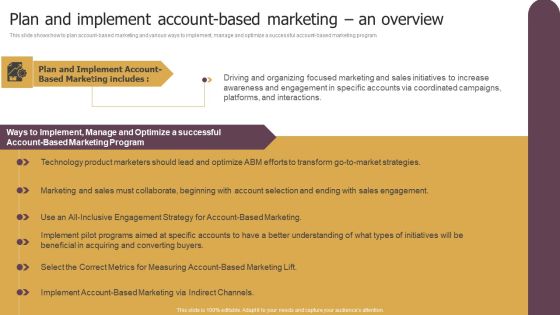
Plan And Implement Accountbased Marketing An Overview Ppt File Infographics PDF
This slide shows how to plan account-based marketing and various ways to implement, manage and optimize a successful account-based marketing program. This Plan And Implement Accountbased Marketing An Overview Ppt File Infographics PDF is perfect for any presentation, be it in front of clients or colleagues. It is a versatile and stylish solution for organizing your meetings. The Plan And Implement Accountbased Marketing An Overview Ppt File Infographics PDF features a modern design for your presentation meetings. The adjustable and customizable slides provide unlimited possibilities for acing up your presentation. Slidegeeks has done all the homework before launching the product for you. So, do not wait, grab the presentation templates today
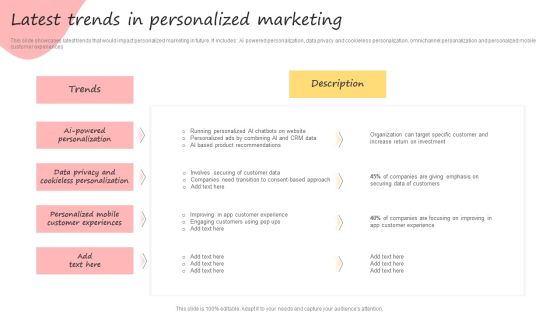
Developing Promotional Strategic Plan For Online Marketing Latest Trends In Personalized Marketing Infographics PDF
Here you can discover an assortment of the finest PowerPoint and Google Slides templates. With these templates, you can create presentations for a variety of purposes while simultaneously providing your audience with an eye-catching visual experience. Download Developing Promotional Strategic Plan For Online Marketing Latest Trends In Personalized Marketing Infographics PDF to deliver an impeccable presentation. These templates will make your job of preparing presentations much quicker, yet still, maintain a high level of quality. Slidegeeks has experienced researchers who prepare these templates and write high-quality content for you. Later on, you can personalize the content by editing the Developing Promotional Strategic Plan For Online Marketing Latest Trends In Personalized Marketing Infographics PDF.

 Home
Home