Agenda Infographic

Customer Care Strategic Plan Ppt PowerPoint Presentation Infographics Format Ideas Cpb
This is a customer care strategic plan ppt powerpoint presentation infographics format ideas cpb. This is a seven stage process. The stages in this process are customer care strategic plan.

Communication Plan Monitoring Analytics And Reporting Ppt PowerPoint Presentation Infographics Layouts
This is a communication plan monitoring analytics and reporting ppt powerpoint presentation infographics layouts. This is a five stage process. The stages in this process are communication strategy, communication planning, communication management.

Planning And Prioritizing Your Own Workload Ppt PowerPoint Presentation Infographics Show
This is a planning and prioritizing your own workload ppt powerpoint presentation infographics show. This is a three stage process. The stages in this process are post it, marketing, business, management, planning.

7 Corporate Wellness Plan Employees Ppt Powerpoint Presentation Infographics Designs Download Cpb
This is a 7 corporate wellness plan employees ppt powerpoint presentation infographics designs download cpb. This is a six stage process. The stages in this process are 7 corporate wellness plan employees.

Sales Management Plan Implement Build Launch Measure Ppt Powerpoint Presentation Infographics Demonstration
This is a sales management plan implement build launch measure ppt powerpoint presentation infographics demonstration. This is a six stage process. The stages in this process are enablement plan, enablement strategy, enablement idea.

Bulb On White Board With Pens For Product Launch Planning Ppt PowerPoint Presentation Infographics Outfit
This is a bulb on white board with pens for product launch planning ppt powerpoint presentation infographics outfit. This is a four stage process. The stages in this process are launch plan, launch strategy, launch ideas.

Framework For Project Management Planning To Completion Ppt PowerPoint Presentation Infographics Model
This is a framework for project management planning to completion ppt powerpoint presentation infographics model. This is a four stage process. The stages in this process are 4 phases, process, planning.
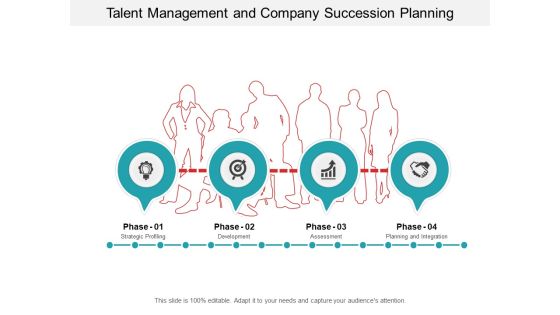
Talent Management And Company Succession Planning Ppt PowerPoint Presentation Infographics Mockup
This is a talent management and company succession planning ppt powerpoint presentation infographics mockup. This is a four stage process. The stages in this process are 4 phases, process, planning.

Designing And Managing Services Planning Ppt PowerPoint Presentation Infographics File Formats
This is a designing and managing services planning ppt powerpoint presentation infographics file formats. This is a five stage process. The stages in this process are marketing, business, management, planning, strategy.
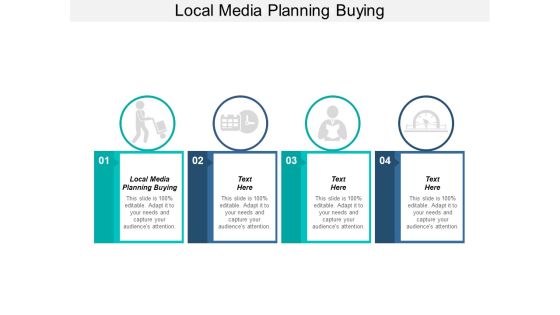
Local Media Planning Buying Ppt PowerPoint Presentation Infographics Design Templates Cpb
This is a local media planning buying ppt powerpoint presentation infographics design templates cpb. This is a four stage process. The stages in this process are local media planning buying.

Succession Planning Backup Summary Simple Format Ppt PowerPoint Presentation Infographics Design Ideas
This is a succession planning backup summary simple format ppt powerpoint presentation infographics design ideas. The topics discussed in this diagram are marketing, business, management, planning, strategy This is a completely editable PowerPoint presentation and is available for immediate download.

Hierarchical Organizational Chart With Names And Departments Ppt PowerPoint Presentation Infographics Background
This is a hierarchical organizational chart with names and departments ppt powerpoint presentation infographics background. This is a three stage process. The stages in this process are flow chart, org chart, hierarchy chart.

Transform Management Instruction Schedule Budget Plan For Structural Change Management Infographics PDF
This slide represents the budget prepared to predict cash flows and allocate required resources for implementing structural changes in the organization. It includes activities such as staff M and A advisor fees, deal related cost etc. Crafting an eye catching presentation has never been more straightforward. Let your presentation shine with this tasteful yet straightforward Transform Management Instruction Schedule Budget Plan For Structural Change Management Infographics PDF template. It offers a minimalistic and classy look that is great for making a statement. The colors have been employed intelligently to add a bit of playfulness while still remaining professional. Construct the ideal Transform Management Instruction Schedule Budget Plan For Structural Change Management Infographics PDF that effortlessly grabs the attention of your audience. Begin now and be certain to wow your customers.

Ocean Water Supervision Characteristics Of Media Used In Water Quality Monitoring Programme Infographics PDF
Deliver an awe inspiring pitch with this creative ocean water supervision characteristics of media used in water quality monitoring programme infographics pdf bundle. Topics like analysis, ecological, surveys, continuous, trained can be discussed with this completely editable template. It is available for immediate download depending on the needs and requirements of the user.

Variables Used In Water Quality Monitoring Programme For Stormwater Management Infographics PDF
Deliver an awe-inspiring pitch with this creative variables used in water quality monitoring programme for stormwater management infographics pdf. bundle. Topics like headwater lakes baseline and trend, groundwaters trend only, global river flux stations can be discussed with this completely editable template. It is available for immediate download depending on the needs and requirements of the user.
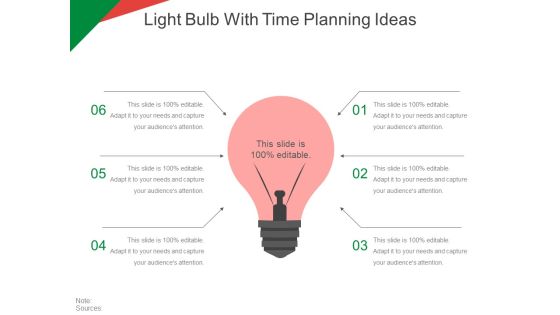
Light Bulb With Time Planning Ideas Ppt PowerPoint Presentation Infographics Graphics Template
This is a light bulb with time planning ideas ppt powerpoint presentation infographics graphics template. This is a six stage process. The stages in this process are business, marketing, strategy, success, management.
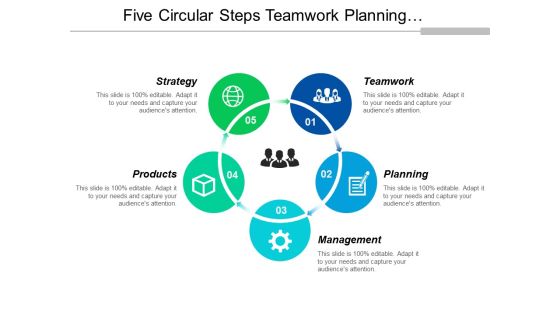
Five Circular Steps Teamwork Planning And Management Ppt PowerPoint Presentation Infographics Layout Ideas
This is a five circular steps teamwork planning and management ppt powerpoint presentation infographics layout ideas. This is a five stage process. The stages in this process are 5 stages circular arrows, 5 steps circle arrows, 5 stages cycle arrows.
Four Stages Business Process Planning And Controlling Ppt PowerPoint Presentation Infographics Icons
This is a four stages business process planning and controlling ppt powerpoint presentation infographics icons. This is a four stage process. The stages in this process are product lifecycle, management cycle, project cycle.

Business Transformation Plan Impact Analysis And Review Ppt PowerPoint Presentation Infographics Display
This is a business transformation plan impact analysis and review ppt powerpoint presentation infographics display. This is a five stage process. The stages in this process are change management, business process, change control.

Four Gears For Planning And Implementing Change Ppt PowerPoint Presentation Infographics Master Slide
This is a four gears for planning and implementing change ppt powerpoint presentation infographics master slide. This is a four stage process. The stages in this process are change management, business process, change control.
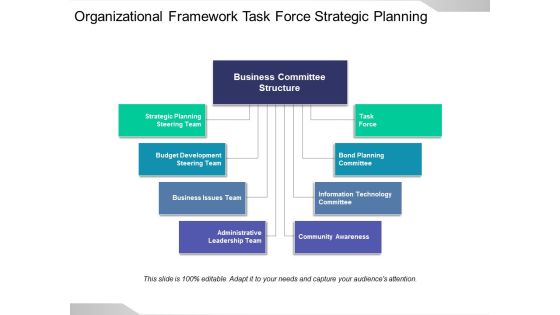
Organizational Framework Task Force Strategic Planning Ppt PowerPoint Presentation Infographics Format Ideas
This is a organizational framework task force strategic planning ppt powerpoint presentation infographics format ideas. This is a eight stage process. The stages in this process are project governance, governance structure, project structure.
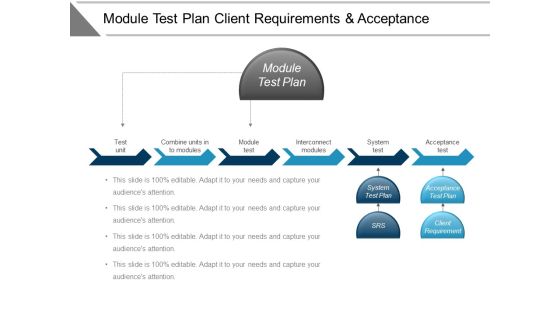
Module Test Plan Client Requirements And Acceptance Ppt PowerPoint Presentation Infographics Structure
This is a module test plan client requirements and acceptance ppt powerpoint presentation infographics structure. This is a three stage process. The stages in this process are quality assurance, quality analysis, qa, testing process, bugs analysis.

New Product Planning Development Maintenance And Support Ppt PowerPoint Presentation Infographics Background Designs
This is a new product planning development maintenance and support ppt powerpoint presentation infographics background designs. This is a four stage process. The stages in this process are product improvement, product enhancement, product upgradation.

Operational Highlights Yearly Operating Plan Ppt PowerPoint Presentation Infographics Background Designs
This is a operational highlights yearly operating plan ppt powerpoint presentation infographics background designs. This is a four stage process. The stages in this process are business, management, strategy, analysis, icons.
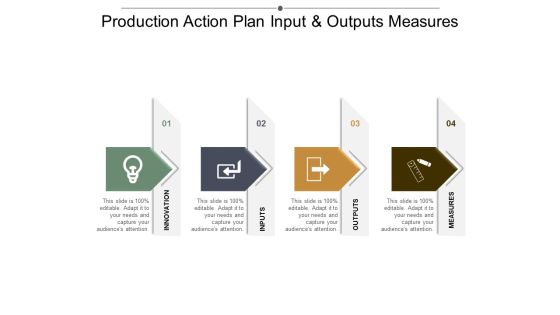
Production Action Plan Input And Outputs Measures Ppt Powerpoint Presentation Infographics Grid
This is a production action plan input and outputs measures ppt powerpoint presentation infographics grid. This is a four stage process. The stages in this process are pdca cycle for business process improvement ppt powerpoint presentation slides pictures.
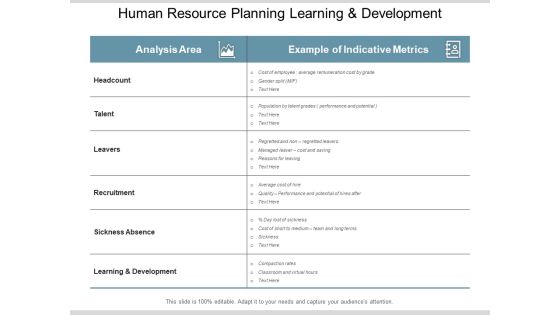
Human Resource Planning Learning And Development Ppt PowerPoint Presentation Infographics Slides
This is a human resource planning learning and development ppt powerpoint presentation infographics slides. This is a two stage process. The stages in this process are hr metrics, hr initiatives, human resource metrics.
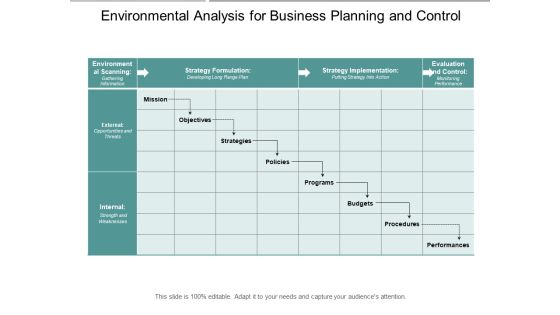
Environmental Analysis For Business Planning And Control Ppt PowerPoint Presentation Infographics Slide Portrait
This is a environmental analysis for business planning and control ppt powerpoint presentation infographics slide portrait. This is a three stage process. The stages in this process are environmental scan, environmental study, environmental examine.
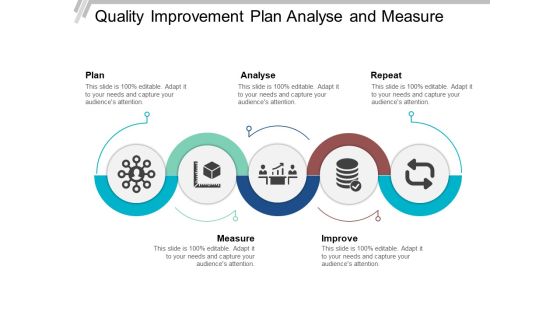
Quality Improvement Plan Analyse And Measure Ppt PowerPoint Presentation Infographics Picture
This is a quality improvement plan analyse and measure ppt powerpoint presentation infographics picture. This is a five stage process. The stages in this process are quality roadmap, quality timeline, quality linear process.
Project Management And Resource Planning Steps With Icons Ppt Powerpoint Presentation Infographics Microsoft
This is a project management and resource planning steps with icons ppt powerpoint presentation infographics microsoft. This is a four stage process. The stages in this process are resource management, wealth management, capital management.

Enterprise Resource Planning Solutions For Procurement Ppt PowerPoint Presentation Infographics Professional
This is a enterprise resource planning solutions for procurement ppt powerpoint presentation infographics professional. This is a three stage process. The stages in this process are software development, business process automation, robotic process automation.
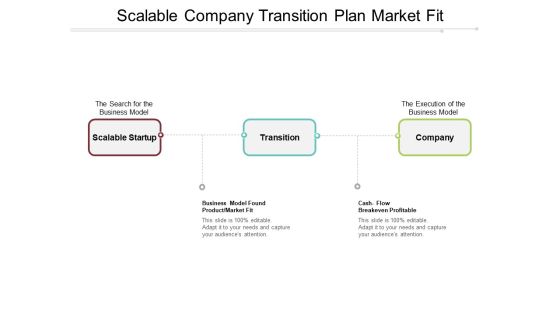
Scalable Company Transition Plan Market Fit Ppt PowerPoint Presentation Infographics Background Images
This is a scalable company transition plan market fit ppt powerpoint presentation infographics background images. This is a three stage process. The stages in this process are scalability of business model, capacity of business model, ability of business model.
Seven Stages Stage Cyclic Process With Business Planning Icons Ppt Powerpoint Presentation Infographics Microsoft
This is a seven stages stage cyclic process with business planning icons ppt powerpoint presentation infographics microsoft. This is a seven stage process. The stages in this process are cycle diagram, circular process, cyclical process.
Six Stages Project Planning Cycle With Icons Ppt Powerpoint Presentation Infographics Objects
This is a six stages project planning cycle with icons ppt powerpoint presentation infographics objects. This is a six stage process. The stages in this process are cycle diagram, circular process, cyclical process.

Sprint Planning In Agile Project Management Ppt PowerPoint Presentation Infographics Sample
This is a sprint planning in agile project management ppt powerpoint presentation infographics sample. This is a six stage process. The stages in this process are agile cycle, sprint cycle, scrum cycle.

90 Days Strategic Plan Timeline With Icons Ppt PowerPoint Presentation Infographics Templates
This is a 90 days strategic plan timeline with icons ppt powerpoint presentation infographics templates. This is a four stage process. The stages in this process are 90 day timeline, timeline, roadmap.

Thank You Sample Ppt Business Plan Ppt PowerPoint Presentation Infographics Slides
This is a thank you sample ppt business plan ppt powerpoint presentation infographics slides. This is a one stage process. The stages in this process are thank you, word, greeting.
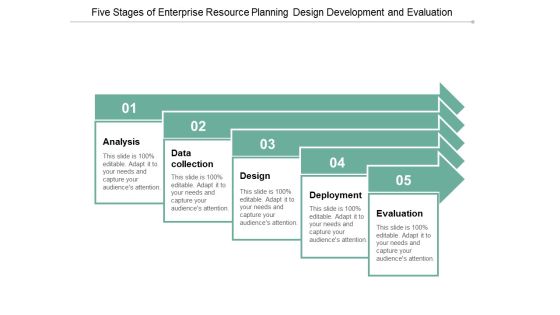
Five Stages Of Enterprise Resource Planning Design Development And Evaluation Ppt Powerpoint Presentation Infographics Summary
This is a five stages of enterprise resource planning design development and evaluation ppt powerpoint presentation infographics summary. This is a five stage process. The stages in this process are arrow steps, arrow stages, arrow phases.

Business Compliance And Operations Planning Strategy Performance Ppt Powerpoint Presentation Infographics Portrait
This is a business compliance and operations planning strategy performance ppt powerpoint presentation infographics portrait. This is a four stage process. The stages in this process are governance model, governance flow, governance structures.
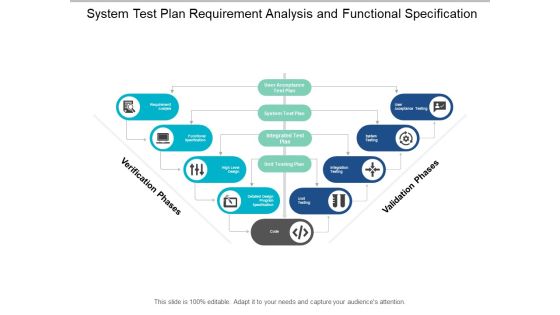
System Test Plan Requirement Analysis And Functional Specification Ppt PowerPoint Presentation Infographics Deck
This is a system test plan requirement analysis and functional specification ppt powerpoint presentation infographics deck. This is a nine stage process. The stages in this process are waterfall model, business, management.
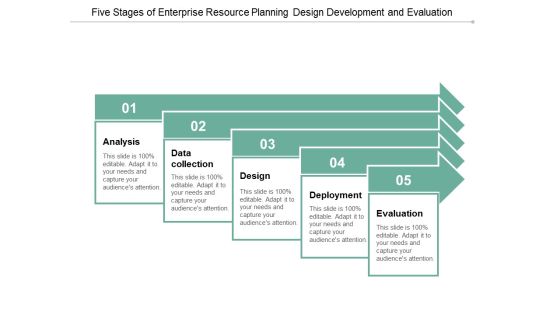
Five Stages Of Enterprise Resource Planning Design Development And Evaluation Ppt Powerpoint Presentation Infographics Templates
This is a five stages of enterprise resource planning design development and evaluation ppt powerpoint presentation infographics templates. This is a five stage process. The stages in this process are arrow steps, arrow stages, arrow phases.

Thank You Strategic Human Resource Planning Ppt PowerPoint Presentation Infographics Graphics Pictures
This is a thank you strategic human resource planning ppt powerpoint presentation infographics graphics pictures. This is a one stage process. The stages in this process are thank you.

7 Piece Pie Chart Offers And Delivery Ppt PowerPoint Presentation Infographics Samples
This is a 7 piece pie chart offers and delivery ppt powerpoint presentation infographics samples. This is a seven stage process. The stages in this process are 6 piece pie chart, 6 segment pie chart, 6 parts pie chart.

8 Segments Pie Chart For Data Representation Ppt PowerPoint Presentation Infographics Design Templates
This is a 8 segments pie chart for data representation ppt powerpoint presentation infographics design templates. This is a eight stage process. The stages in this process are 6 piece pie chart, 6 segment pie chart, 6 parts pie chart.

Eight Steps Infographics Diagram Of IT Modernization Roadmap Ppt PowerPoint Presentation File Slide Portrait PDF
Persuade your audience using this eight steps infographics diagram of it modernization roadmap ppt powerpoint presentation file slide portrait pdf. This PPT design covers eight stages, thus making it a great tool to use. It also caters to a variety of topics including eight steps infographics diagram of it modernization roadmap. Download this PPT design now to present a convincing pitch that not only emphasizes the topic but also showcases your presentation skills.

6 Stage Procedure Flow Infographics For Network Effect Strategy Ppt PowerPoint Presentation File Graphics Download PDF
Presenting 6 stage procedure flow infographics for network effect strategy ppt powerpoint presentation file graphics download pdf to dispense important information. This template comprises six stages. It also presents valuable insights into the topics including 6 stage procedure flow infographics for network effect strategy. This is a completely customizable PowerPoint theme that can be put to use immediately. So, download it and address the topic impactfully.

Icons Slide Guide For Guide For Implementing Market Intelligence In Business Infographics PDF
Help your business to create an attention-grabbing presentation using our Icons Slide Guide For Guide For Implementing Market Intelligence In Business Infographics PDF set of slides. The slide contains innovative icons that can be flexibly edited. Choose this Icons Slide Guide For Guide For Implementing Market Intelligence In Business Infographics PDF template to create a satisfactory experience for your customers. Go ahead and click the download button.
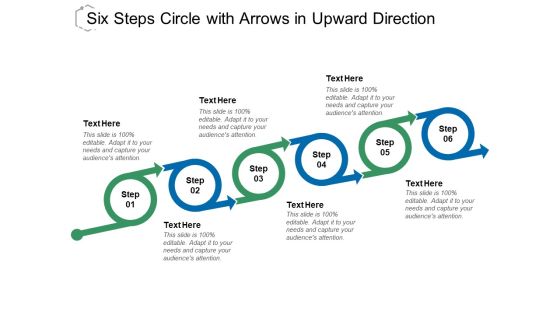
Six Steps Circle With Arrows In Upward Direction Ppt Powerpoint Presentation Infographics Outline
This is a six steps circle with arrows in upward direction ppt powerpoint presentation infographics outline. This is a six stage process. The stages in this process are executive summary, analysis summary, review summary.

Customer Acquisition Cost 1 Of 2 Ppt PowerPoint Presentation Infographics Outline
This is a customer acquisition cost 1 of 2 ppt powerpoint presentation infographics outline. This is a three stage process. The stages in this process are icons, management, strategy, analysis, marketing.

Business Event Day Activities Conference Event Day Activity Schedule Infographics PDF
This slide showcases tasks performed on conference day. It includes registration, breakfast, welcoming attendees, conducting ice-breaker activities, providing keynotes and conducting QandA sessions. Formulating a presentation can take up a lot of effort and time, so the content and message should always be the primary focus. The visuals of the PowerPoint can enhance the presenters message, so our Business Event Day Activities Conference Event Day Activity Schedule Infographics PDF was created to help save time. Instead of worrying about the design, the presenter can concentrate on the message while our designers work on creating the ideal templates for whatever situation is needed. Slidegeeks has experts for everything from amazing designs to valuable content, we have put everything into Business Event Day Activities Conference Event Day Activity Schedule Infographics PDF.

Data Chart For Distribution Of Vehicles By Origin And Type Ppt PowerPoint Presentation Infographics Topics
This is a data chart for distribution of vehicles by origin and type ppt powerpoint presentation infographics topics. This is a four stage process. The stages in this process are financial analysis, quantitative, statistical modelling.

Price Analysis Infographics For Financial Planning And Analysis Ppt Styles Information PDF
Persuade your audience using this price analysis infographics for financial planning and analysis ppt styles information pdf. This PPT design covers four stages, thus making it a great tool to use. It also caters to a variety of topics including price analysis infographics for financial planning and analysis. Download this PPT design now to present a convincing pitch that not only emphasizes the topic but also showcases your presentation skills.
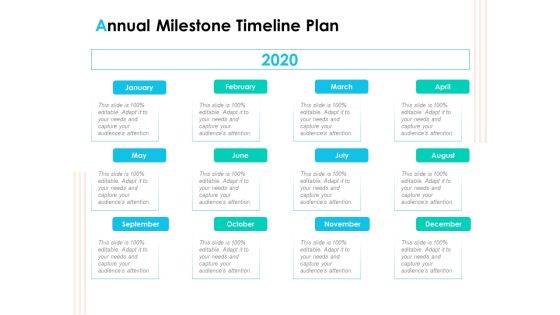
Effective Milestone Scheduling Approach Annual Milestone Timeline Plan Ppt PowerPoint Presentation Infographics Aids PDF
This is a effective milestone scheduling approach annual milestone timeline plan ppt powerpoint presentation infographics aids pdf template with various stages. Focus and dispense information on twelve stages using this creative set, that comes with editable features. It contains large content boxes to add your information on topics like annual milestone, timeline, plan, 2020. You can also showcase facts, figures, and other relevant content using this PPT layout. Grab it now.

Dashboard For Email And Web Performance Ppt PowerPoint Presentation Infographics Visual Aids PDF
Presenting this set of slides with name dashboard for email and web performance ppt powerpoint presentation infographics visual aids pdf. The topics discussed in these slides are email list growth, list performance, email and web performance. This is a completely editable PowerPoint presentation and is available for immediate download. Download now and impress your audience.

High Low Close Chart Template 1 Ppt PowerPoint Presentation Infographics Graphics Design
This is a high low close chart template 1 ppt powerpoint presentation infographics graphics design. This is a five stage process. The stages in this process are close, high, volume, low, open, product.

Volume Open High Low Close Chart Ppt PowerPoint Presentation Infographics Guide
This is a volume open high low close chart ppt powerpoint presentation infographics guide. This is a two stage process. The stages in this process are close, high, volume, low, open, product.
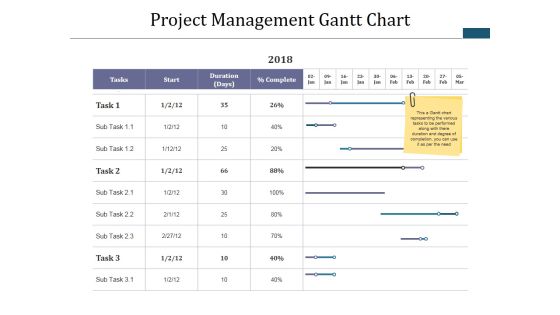
Project Management Gantt Chart Template 1 Ppt PowerPoint Presentation Infographics Tips
This is a project management gantt chart template 1 ppt powerpoint presentation infographics tips. This is a four stage process. The stages in this process are table, business, marketing, strategy, compare.

Bar Chart For Business Performance Evaluation Ppt PowerPoint Presentation Infographics Professional
This is a bar chart for business performance evaluation ppt powerpoint presentation infographics professional. This is a five stage process. The stages in this process are metrics icon, kpis icon, statistics icon.
Experimental Control Pie Chart With Dollar Symbol Ppt Powerpoint Presentation Infographics Background Images
This is a experimental control pie chart with dollar symbol ppt powerpoint presentation infographics background images. This is a four stage process. The stages in this process are exploratory, experimental, investigational.

Bar Chart With Magnifying Glass For Financial Analysis Ppt Powerpoint Presentation Infographics Designs Download
This is a bar chart with magnifying glass for financial analysis ppt powerpoint presentation infographics designs download. This is a three stage process. The stages in this process are business metrics, business kpi, business dashboard.

Donut Chart Finance Marketing Ppt Powerpoint Presentation Infographics Skills Ppt Powerpoint Presentation File Skills
This is a donut chart finance marketing ppt powerpoint presentation infographics skills ppt powerpoint presentation file skills. This is a four stage process. The stages in this process are finance, marketing, management, investment, analysis.

 Home
Home