Agenda Infographic

Dashboard To Track Autonomous Mobile Robot Performance Infographics PDF
This slide represents the dashboard to track the AMRs performance in the warehouse. It covers various AMRs status reports, energy consumption, battery level, total working hours, and time to return. Take your projects to the next level with our ultimate collection of Dashboard To Track Autonomous Mobile Robot Performance Infographics PDF. Slidegeeks has designed a range of layouts that are perfect for representing task or activity duration, keeping track of all your deadlines at a glance. Tailor these designs to your exact needs and give them a truly corporate look with your own brand colors they will make your projects stand out from the rest.

Current Challenges Faced By Retail Stores Infographics PDF
This slide represents major challenges faced by retail store. It highlights decline in conversion for shoppers into buyers and decrease in customer visits. Boost your pitch with our creative Current Challenges Faced By Retail Stores Infographics PDF. Deliver an awe inspiring pitch that will mesmerize everyone. Using these presentation templates you will surely catch everyones attention. You can browse the ppts collection on our website. We have researchers who are experts at creating the right content for the templates. So you do not have to invest time in any additional work. Just grab the template now and use them.

Budget Breakdown And Cost Incurred In Procurement Strategy Infographics PDF
This slide provides an overview of the budget created by managers for procurement strategies and the actual cost spent. The maximum cost was spent on corporate social responsibility activities to improve brand value and customer loyalty. From laying roadmaps to briefing everything in detail, our templates are perfect for you. You can set the stage with your presentation slides. All you have to do is download these easy to edit and customizable templates. Budget Breakdown And Cost Incurred In Procurement Strategy Infographics PDF will help you deliver an outstanding performance that everyone would remember and praise you for. Do download this presentation today.

Customer Service Measurement KPI Dashboard Ppt Infographics Themes PDF
Mentioned slide portrays customer service measurement KPI dashboard that includes metrics namely request volume vs. service level, customer satisfaction, customer retention, costs per support and average time to solve issue. If your project calls for a presentation, then Slidegeeks is your go-to partner because we have professionally designed, easy-to-edit templates that are perfect for any presentation. After downloading, you can easily edit Customer Service Measurement KPI Dashboard Ppt Infographics Themes PDF and make the changes accordingly. You can rearrange slides or fill them with different images. Check out all the handy templates

Consumer Partition Dashboard For Email Campaigns Infographics PDF
The following slide depicts a dashboard which can be used by marketers for sending targeted mails to customers and enhance customer retention. The key performing indicators are number of customers, average value or orders, number of orders, top ten percent customers etc. Showcasing this set of slides titled Consumer Partition Dashboard For Email Campaigns Infographics PDF. The topics addressed in these templates are Average Life Time Value, Average Value Of Orders, Returns, Average Number Of Orders. All the content presented in this PPT design is completely editable. Download it and make adjustments in color, background, font etc. as per your unique business setting.
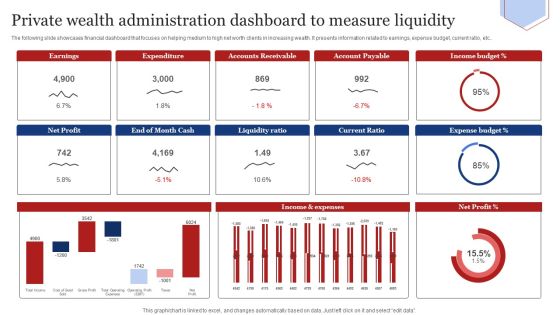
Private Wealth Administration Dashboard To Measure Liquidity Infographics PDF
The following slide showcases financial dashboard that focuses on helping medium to high net worth clients in increasing wealth. It presents information related to earnings, expense budget, current ratio, etc. Showcasing this set of slides titled Private Wealth Administration Dashboard To Measure Liquidity Infographics PDF. The topics addressed in these templates are Liquidity Ratio, Current Ratio, Expense Budget. All the content presented in this PPT design is completely editable. Download it and make adjustments in color, background, font etc. as per your unique business setting.

Global Iot Agriculture Market By Component Ppt Infographics Slides PDF
This slide focuses on global internet of things in agriculture market by component which includes hardware, software and connectivity and services. If your project calls for a presentation, then Slidegeeks is your go-to partner because we have professionally designed, easy-to-edit templates that are perfect for any presentation. After downloading, you can easily edit Global Iot Agriculture Market By Component Ppt Infographics Slides PDF and make the changes accordingly. You can rearrange slides or fill them with different images. Check out all the handy templates

Periodic Revenue Model Recurring Revenue Dashboard Infographics PDF
The following slide display recurring revenue generated over the year, the following dashboard displays MRR, churn rate net recurring revenue and growth rate. Slidegeeks is one of the best resources for PowerPoint templates. You can download easily and regulate Periodic Revenue Model Recurring Revenue Dashboard Infographics PDF for your personal presentations from our wonderful collection. A few clicks is all it takes to discover and get the most relevant and appropriate templates. Use our Templates to add a unique zing and appeal to your presentation and meetings. All the slides are easy to edit and you can use them even for advertisement purposes.

Factors Encouraging E Commerce Transactions By Customers Infographics PDF
This slide analysis major factors that influence online purchase decision of customer foe ecommerce company. It includes details such as ability to compare prices, time savings, free shipping offers, etc. Showcasing this set of slides titled Factors Encouraging E Commerce Transactions By Customers Infographics PDF. The topics addressed in these templates are Key Insights, Convenience, Push Form Offline. All the content presented in this PPT design is completely editable. Download it and make adjustments in color, background, font etc. as per your unique business setting.

Monthly Financial Metrics Dashboard With Income Statement Infographics PDF
This following slide displays kpis to communicate key financial information to both internal and external stakeholders. It further includes details such as OPEX ratio, revenue and COGS, income, expenses, etc. Showcasing this set of slides titled Monthly Financial Metrics Dashboard With Income Statement Infographics PDF. The topics addressed in these templates are Gross Profit Margin, Taxes, Revenue. All the content presented in this PPT design is completely editable. Download it and make adjustments in color, background, font etc. as per your unique business setting.
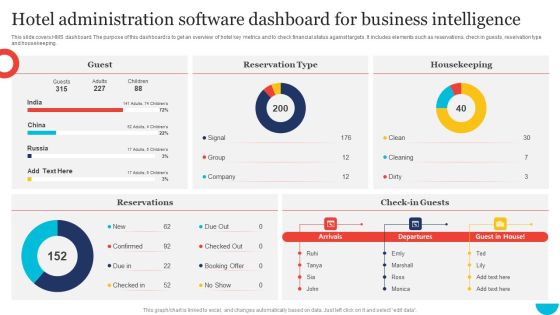
Hotel Administration Software Dashboard For Business Intelligence Infographics PDF
This slide covers HMS dashboard. The purpose of this dashboard is to get an overview of hotel key metrics and to check financial status against targets. It includes elements such as reservations, check in guests, reservation type and housekeeping. Pitch your topic with ease and precision using this Hotel Administration Software Dashboard For Business Intelligence Infographics PDF. This layout presents information on Guest, Housekeeping, Reservation Type. It is also available for immediate download and adjustment. So, changes can be made in the color, design, graphics or any other component to create a unique layout.

Consumer Packed Good Companies Investment In Buyer Marketing Infographics PDF
Following slide brings forth the investment criteria adopted by consumer packed goods and their trends for two years. Key investment areas include retailer specific discounts, sampling, instore advertising, merchandizing, in store events and others Showcasing this set of slides titled Consumer Packed Good Companies Investment In Buyer Marketing Infographics PDF. The topics addressed in these templates are Key Takeaways, Buyer Marketing, Purchase Rate. All the content presented in this PPT design is completely editable. Download it and make adjustments in color, background, font etc. as per your unique business setting.

Dashboard To Track Performance Of Buyer Marketing Campaign Infographics PDF
This slide depicts a Dashboard which can be used to track performance of shopper marketing campaign on digital platforms. The key performance indicators include Website leads, Current service users, Lead conversion rate, Lead satisfaction rate etc. Pitch your topic with ease and precision using this Dashboard To Track Performance Of Buyer Marketing Campaign Infographics PDF. This layout presents information on Social Media Campaign, Social Media Engagement, Current Service Users. It is also available for immediate download and adjustment. So, changes can be made in the color, design, graphics or any other component to create a unique layout.

Data Automation Solution Investor Funding Presentation Shareholding Pattern Infographics PDF
Mentioned slide provides insights into company shareholding distribution by number of shareholders and percentage of holding by each member. Coming up with a presentation necessitates that the majority of the effort goes into the content and the message you intend to convey. The visuals of a PowerPoint presentation can only be effective if it supplements and supports the story that is being told. Keeping this in mind our experts created Data Automation Solution Investor Funding Presentation Shareholding Pattern Infographics PDF to reduce the time that goes into designing the presentation. This way, you can concentrate on the message while our designers take care of providing you with the right template for the situation.
Different Brands Performance Tracking Dashboard Ppt Gallery Infographics PDF
This slide provides information regarding different brands performance tracking dashboard in terms of brand metric, brand commitment, advertising metrics, and purchase metrics. Take your projects to the next level with our ultimate collection of Different Brands Performance Tracking Dashboard Ppt Gallery Infographics PDF. Slidegeeks has designed a range of layouts that are perfect for representing task or activity duration, keeping track of all your deadlines at a glance. Tailor these designs to your exact needs and give them a truly corporate look with your own brand colors they will make your projects stand out from the rest.
KPI Dashboard For Tracking Customer Retention Infographics PDF
This slide covers the dashboard for analyzing customer loyalty with metrics such as NPS, loyal customer rate, premium users, CLV, customer churn, revenue churn, net retention, MRR growth, etc. Slidegeeks is one of the best resources for PowerPoint templates. You can download easily and regulate KPI Dashboard For Tracking Customer Retention Infographics PDF for your personal presentations from our wonderful collection. A few clicks is all it takes to discover and get the most relevant and appropriate templates. Use our Templates to add a unique zing and appeal to your presentation and meetings. All the slides are easy to edit and you can use them even for advertisement purposes.

Budget For Running Personalized Marketing Campaign Ppt Infographics Images PDF
This showcases budget that can be allocated by organization before running personalized marketing campaigns. Key elements of budget are email marketing, data analysis, social media marketing, mobile application personalization and website optimization. This Budget For Running Personalized Marketing Campaign Ppt Infographics Images PDF is perfect for any presentation, be it in front of clients or colleagues. It is a versatile and stylish solution for organizing your meetings. The product features a modern design for your presentation meetings. The adjustable and customizable slides provide unlimited possibilities for acing up your presentation. Slidegeeks has done all the homework before launching the product for you. So, do not wait, grab the presentation templates today

HDI Comparison On Basis Of Inequality Infographics PDF
Following slides shows comparison of the human development index based on national disparities which will assist in measuring well being through economic data It major countries are Pakistan, India, Nepal, Bangladesh , etc. Showcasing this set of slides titled HDI Comparison On Basis Of Inequality Infographics PDF. The topics addressed in these templates are Country Effect, Most Effected Country, Human Development. All the content presented in this PPT design is completely editable. Download it and make adjustments in color, background, font etc. as per your unique business setting.
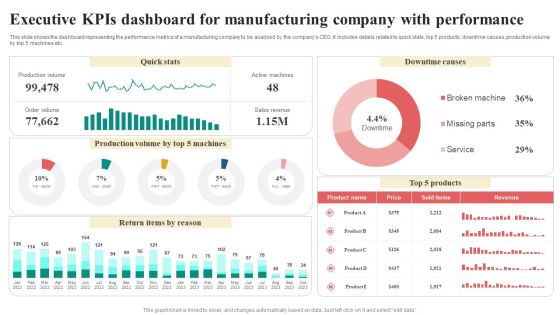
Executive Kpis Dashboard For Manufacturing Company With Performance Infographics PDF
This slide shows the dashboard representing the performance metrics of a manufacturing company to be analyzed by the companys CEO. It includes details related to quick stats, top 5 products, downtime causes, production volume by top 5 machines etc. Showcasing this set of slides titled Executive Kpis Dashboard For Manufacturing Company With Performance Infographics PDF. The topics addressed in these templates are Return Items By Reason, Quick Stats, Downtime Causes, Revenue. All the content presented in this PPT design is completely editable. Download it and make adjustments in color, background, font etc. as per your unique business setting.

Call Center Kpis Dashboard With Data Management Infographics PDF
This slide covers contact center metrics KPI dashboard with call data details. It involves details such as total number of contacts handled, product sales, repeated calls and contact handles per day. Pitch your topic with ease and precision using this Call Center Kpis Dashboard With Data Management Infographics PDF. This layout presents information on Achieved, Contacts Handled, Repeated Calls. It is also available for immediate download and adjustment. So, changes can be made in the color, design, graphics or any other component to create a unique layout.

Retail Business Gross Comparison Analysis Of Profit Infographics PDF
This slide presents retail business comparison based on their respective gross profit margins, helpful in identifying most successful retailers and overall standing in market. It includes beverages, jewellery, cosmetics, fashion and shoes industries. Showcasing this set of slides titled Retail Business Gross Comparison Analysis Of Profit Infographics PDF. The topics addressed in these templates are Beverages Retail, Gross Profit Margin, Retail Segment. All the content presented in this PPT design is completely editable. Download it and make adjustments in color, background, font etc. as per your unique business setting.

Annually E Mail Performance Campaign Statistics Analysis Infographics PDF
This slide showcases the yearly figures for the number of emails sent and received globally. It consists the number of mail sent and received from the past five years and forecasted emails to be sent or received in upcoming years. Showcasing this set of slides titled Annually E Mail Performance Campaign Statistics Analysis Infographics PDF. The topics addressed in these templates are Annually E Mail Performance, Campaign Statistics Analysis. All the content presented in this PPT design is completely editable. Download it and make adjustments in color, background, font etc. as per your unique business setting.
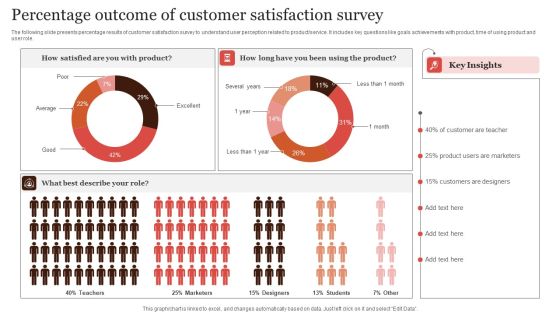
Percentage Outcome Of Customer Satisfaction Survey Infographics PDF
The following slide presents percentage results of customer satisfaction survey to understand user perception related to product or service. It includes key questions like goals achievements with product, time of using product and user role. Pitch your topic with ease and precision using this Percentage Outcome Of Customer Satisfaction Survey Infographics PDF. This layout presents information on Percentage Outcome, Customer Satisfaction Survey. It is also available for immediate download and adjustment. So, changes can be made in the color, design, graphics or any other component to create a unique layout.
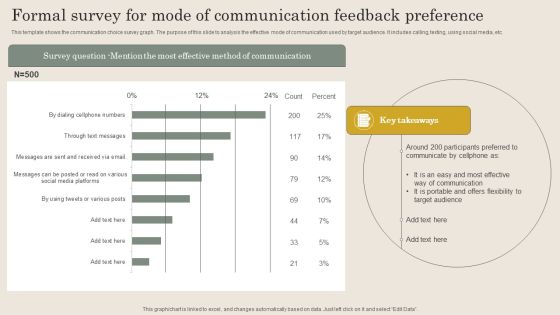
Formal Survey For Mode Of Communication Feedback Preference Infographics PDF
This template shows the communication choice survey graph. The purpose of this slide to analysis the effective mode of communication used by target audience. It includes calling, texting, using social media, etc. Showcasing this set of slides titled Formal Survey For Mode Of Communication Feedback Preference Infographics PDF. The topics addressed in these templates are Effective Way Communication, Offers Flexibility, Target Audience. All the content presented in this PPT design is completely editable. Download it and make adjustments in color, background, font etc. as per your unique business setting.

Intelligent Process Automation Market Share By Different Countries Infographics PDF
This slide showcases cognitive automation market share by different regions to identify future business opportunities. It includes regions such as North America, Europe, Asia Pacific, Middle East and Africa, and South America. Showcasing this set of slides titled Intelligent Process Automation Market Share By Different Countries Infographics PDF. The topics addressed in these templates are Cognitive Automation, Automation Business Processes, Manufacturing Industry Growth. All the content presented in this PPT design is completely editable. Download it and make adjustments in color, background, font etc. as per your unique business setting.

Display Ad Campaigning Dashboard To Monitor Productivity Infographics PDF
This slide showcases KPI dashboard for display advertising for real- time tracking of key marketing metrices, It includes elements such as cost, clicks, impressions, CTR, conversion rate, CPC, etc. Showcasing this set of slides titled Display Ad Campaigning Dashboard To Monitor Productivity Infographics PDF. The topics addressed in these templates are Cost Per Conversion, Conversions, Ad Impressions. All the content presented in this PPT design is completely editable. Download it and make adjustments in color, background, font etc. as per your unique business setting.
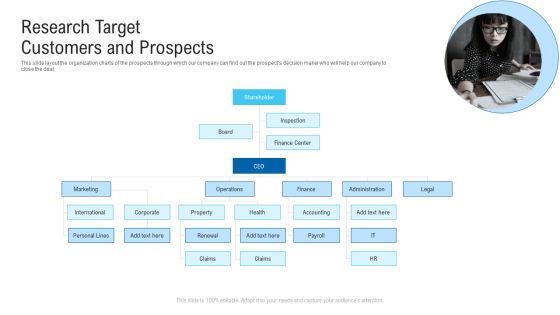
Research Target Customers And Prospects Ppt Infographics Show PDF
This slide layout the organization charts of the prospects through which our company can find out the prospects decision maker who will help our company to close the deal.Presenting research target customers and prospects ppt infographics show pdf. to provide visual cues and insights. Share and navigate important information on seven stages that need your due attention. This template can be used to pitch topics like shareholder, marketing, international, operations. In addtion, this PPT design contains high resolution images, graphics, etc, that are easily editable and available for immediate download.

Healthcare Services Company Profile Organization Structure Infographics PDF
The slide depicts the company hierarchical chart to define the various management positions in organization. It depicts managing director, founder, chief financial officer, chief executive officer, director of operations, director of surgeries, IPR head, R and D head and manufacturing head.This is a Healthcare Services Company Profile Organization Structure Infographics PDF template with various stages. Focus and dispense information on five stages using this creative set, that comes with editable features. It contains large content boxes to add your information on topics like Hospital Business, Research Business, Pharmacy Business You can also showcase facts, figures, and other relevant content using this PPT layout. Grab it now.

Pharmaceutical And Clinical Research Summary Organisation Structure Infographics PDF
The slide depicts the company hierarchical chart to define the various management positions in organization. It depicts managing director, founder, chief financial officer, chief executive officer, director of operations, director of surgeries, IPR head, R and D head and manufacturing head. This is a Pharmaceutical And Clinical Research Summary Organisation Structure Infographics PDF template with various stages. Focus and dispense information on four stages using this creative set, that comes with editable features. It contains large content boxes to add your information on topics like Sales And Marketing Manager, Manufacturing Head Chief, Financial Officer. You can also showcase facts, figures, and other relevant content using this PPT layout. Grab it now.

Facility Asset Hierarchy Structure Ppt PowerPoint Presentation Icon Infographics PDF
This slide covers asset hierarchy chart of a facility management. It includes division of facility 1 under asset A and B along with subdivisions such as subassembly 1, 2,3 with further divisions into several parts. Persuade your audience using this Facility Asset Hierarchy Structure Ppt PowerPoint Presentation Icon Infographics PDF. This PPT design covers three stages, thus making it a great tool to use. It also caters to a variety of topics including Asset, Facility, Subassembly. Download this PPT design now to present a convincing pitch that not only emphasizes the topic but also showcases your presentation skills.

Customer Support Process Flow Diagram For Online Stores Infographics PDF
This slide includes customer support flow chart which can be used by service department to increase customer satisfaction rate. It includes elements such as development department, tester, technical support team, sales team and customers.Presenting Customer Support Process Flow Diagram For Online Stores Infographics PDF to dispense important information. This template comprises one stage. It also presents valuable insights into the topics including Implement Solution, Determine Solution, Formulate Error Report . This is a completely customizable PowerPoint theme that can be put to use immediately. So, download it and address the topic impactfully.
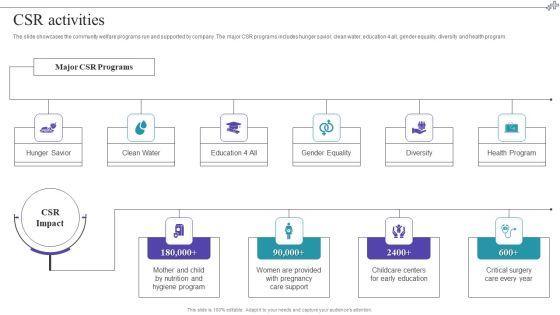
Medical Care Company Overview CSR Activities Infographics PDF
The slide showcases the community welfare programs run and supported by company. The major CSR programs includes hunger savior, clean water, education 4 all, gender equality, diversity and health program. Presenting Medical Care Company Overview CSR Activities Infographics PDF to provide visual cues and insights. Share and navigate important information on four stages that need your due attention. This template can be used to pitch topics like Gender Equality, Csr Activities. In addtion, this PPT design contains high resolution images, graphics, etc, that are easily editable and available for immediate download.
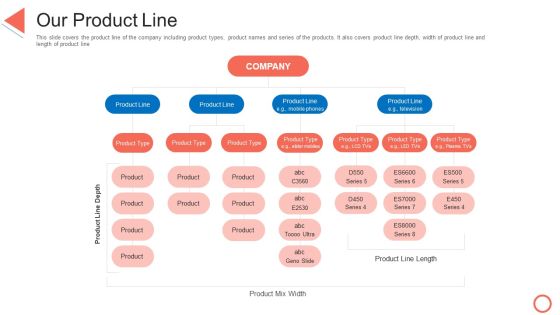
Our Product Line STP Approaches In Retail Marketing Infographics PDF
This slide covers the product line of the company including product types, product names and series of the products. It also covers product line depth, width of product line and length of product line. This is a our product line stp approaches in retail marketing infographics pdf template with various stages. Focus and dispense information on six stages using this creative set, that comes with editable features. It contains large content boxes to add your information on topics like our product line. You can also showcase facts, figures, and other relevant content using this PPT layout. Grab it now.
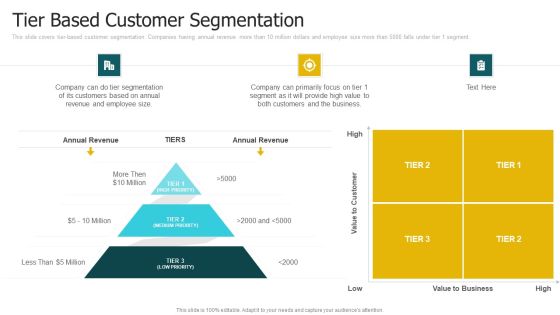
Tier Based Customer Segmentation Ppt Infographics Influencers PDF
This slide covers tier based customer segmentation. Companies having annual revenue more than 10 million dollars and employee size more than 5000 falls under tier 1 segment. This is a tier based customer segmentation ppt infographics influencers pdf template with various stages. Focus and dispense information on four stages using this creative set, that comes with editable features. It contains large content boxes to add your information on topics like value, customers, business, revenue. You can also showcase facts, figures, and other relevant content using this PPT layout. Grab it now.
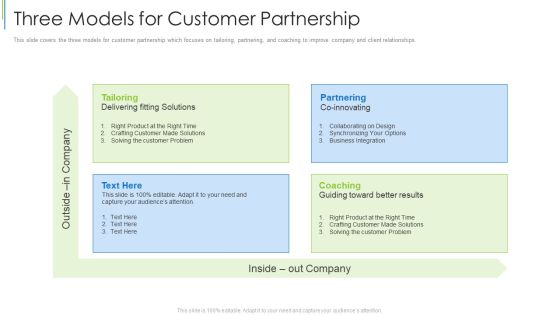
Three Models For Customer Partnership Ppt Professional Infographics PDF
This slide covers the three models for customer partnership which focuses on tailoring, partnering, and coaching to improve company and client relationships. This is a three models for customer partnership ppt professional infographics pdf template with various stages. Focus and dispense information on four stages using this creative set, that comes with editable features. It contains large content boxes to add your information on topics like three models for customer partnership. You can also showcase facts, figures, and other relevant content using this PPT layout. Grab it now.

Diversity Initiatives And Practices At Organizational Environment Infographics PDF
This slide exhibits diversity initiatives and practices at workplace environment. It includes major element such as improving and making use of diversity, formulating HR practices, training and staffing and so on. Presenting diversity initiatives and practices at organizational environment infographics pdf to dispense important information. This template comprises three stages. It also presents valuable insights into the topics including strategic, management, innovation. This is a completely customizable PowerPoint theme that can be put to use immediately. So, download it and address the topic impactfully.
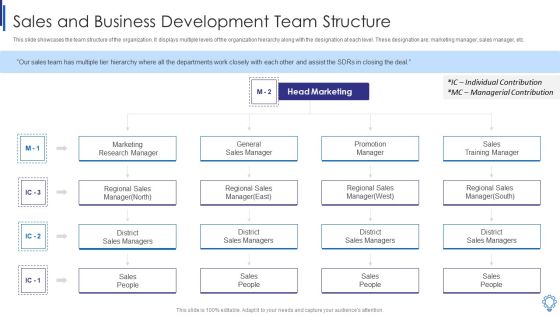
Sales And Business Development Team Structure Infographics PDF
This slide showcases the team structure of the organization. It displays multiple levels of the organization hierarchy along with the designation at each level. These designation are marketing manager, sales manager, etc. Presenting sales and business development team structure infographics pdf to provide visual cues and insights. Share and navigate important information on four stages that need your due attention. This template can be used to pitch topics like marketing research manager, general sales manager, sales training manager, individual contribution, managerial contribution. In addtion, this PPT design contains high resolution images, graphics, etc, that are easily editable and available for immediate download.

New Project Management Organizational Structure Of A PMO Infographics PDF
This slide shows the hierarchy structure of PMO, that includes PMO head, departments under the PMO, and various projects under each department. This is a New Project Management Organizational Structure Of A PMO Infographics PDF template with various stages. Focus and dispense information on five stages using this creative set, that comes with editable features. It contains large content boxes to add your information on topics like Research And Development Department, Sales, Marketing, HR Department, IT Department, PMO Head. You can also showcase facts, figures, and other relevant content using this PPT layout. Grab it now.

PMP Tools Cost Of Quality Data Analysis Tool Infographics PDF
This slide provides the glimpse about the cost of quality technique which focuses on cost of conformance such as prevention and appraisal cost and non conformance such as internal and external failure costs.Presenting PMP Tools Cost Of Quality Data Analysis Tool Infographics PDF to provide visual cues and insights. Share and navigate important information on six stages that need your due attention. This template can be used to pitch topics like Cost Of Conformance, Appraisal Cost, Prevention Cost In addtion, this PPT design contains high resolution images, graphics, etc, that are easily editable and available for immediate download.

Construction Services Company Profile Construction Group Organizational Structure Infographics PDF
This slide shows the organizational structure of our construction group which covers board, executive, director, manager and support level director, manager and specialist.Presenting Construction Services Company Profile Construction Group Organizational Structure Infographics PDF to provide visual cues and insights. Share and navigate important information on five stages that need your due attention. This template can be used to pitch topics like Financial Manager, Finance Director, Executive Level In addtion, this PPT design contains high resolution images, graphics, etc, that are easily editable and available for immediate download.

Project Management Governance Framework With Team Member Details Infographics PDF
This slide visually represents project governance framework with team member details which can be beneficial for organizations to create a formal structure of a project team. It contains information about executive members of board, support, leader, declaration, director, analysis, risk mitigation and stakeholders Persuade your audience using this Project Management Governance Framework With Team Member Details Infographics PDF. This PPT design covers three stages, thus making it a great tool to use. It also caters to a variety of topics including Supporting Management, Project Management, Organizational Analysis Manager. Download this PPT design now to present a convincing pitch that not only emphasizes the topic but also showcases your presentation skills.

Key Members Of Logistics Information Technology Department Infographics PDF
This slide illustrates key members of logistics information technology department. It provides information about chief technical officer, process engineering, supply chain analyst, operator, logistics manager, operations manager, etc. This is a Key Members Of Logistics Information Technology Department Infographics PDF template with various stages. Focus and dispense information on three stages using this creative set, that comes with editable features. It contains large content boxes to add your information on topics like Supply Chain Analyst, Operations Manager, Chief Technical Officer. You can also showcase facts, figures, and other relevant content using this PPT layout. Grab it now.
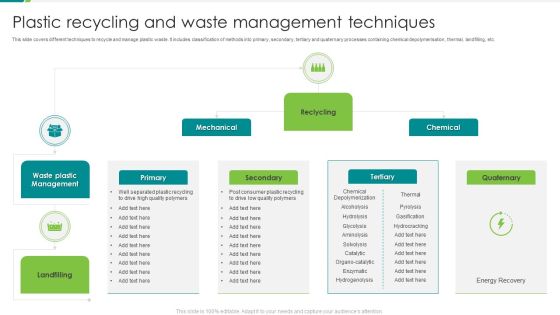
Plastic Recycling And Waste Management Techniques Ppt Infographics Designs PDF
This slide covers different techniques to recycle and manage plastic waste. It includes classification of methods into primary, secondary, tertiary and quaternary processes containing chemical depolymerisation, thermal, landfilling, etc. Persuade your audience using this Plastic Recycling And Waste Management Techniques Ppt Infographics Designs PDF. This PPT design covers three stages, thus making it a great tool to use. It also caters to a variety of topics including Mechanical, Reclycling, Chemical, Secondary. Download this PPT design now to present a convincing pitch that not only emphasizes the topic but also showcases your presentation skills.

Basis Of Global Market Segmentation Framework Ppt Infographics Demonstration PDF
This slide represents the framework showing the basis of international market segmentation and strategic brand positioning. It includes segmentation of international market on the basis of macro- level and behavioral level. Presenting Basis Of Global Market Segmentation Framework Ppt Infographics Demonstration PDF to dispense important information. This template comprises five stages. It also presents valuable insights into the topics including International Market, Segmentation Basis, Hybrid Basis Integration, Strategic Brand Positioning. This is a completely customizable PowerPoint theme that can be put to use immediately. So, download it and address the topic impactfully.
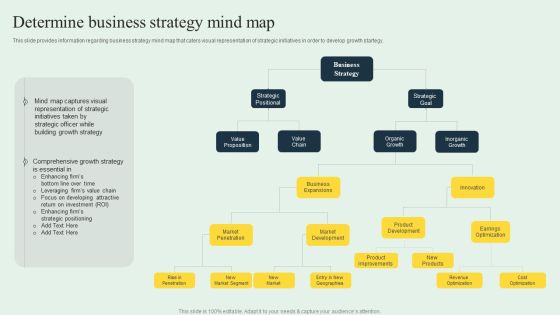
Effective Strategy Development Determine Business Strategy Mind Map Infographics PDF
This slide provides information regarding business strategy mind map that caters visual representation of strategic initiatives in order to develop growth startegy. Slidegeeks is one of the best resources for PowerPoint templates. You can download easily and regulate Effective Strategy Development Determine Business Strategy Mind Map Infographics PDF for your personal presentations from our wonderful collection. A few clicks is all it takes to discover and get the most relevant and appropriate templates. Use our Templates to add a unique zing and appeal to your presentation and meetings. All the slides are easy to edit and you can use them even for advertisement purposes.
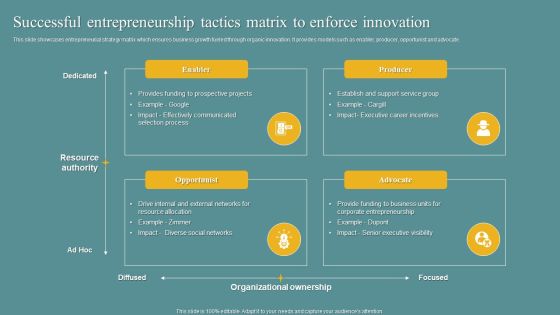
Successful Entrepreneurship Tactics Matrix To Enforce Innovation Infographics PDF
This slide showcases entrepreneurial strategy matrix which ensures business growth fueled through organic innovation. It provides models such as enabler, producer, opportunist and advocate. Persuade your audience using this Successful Entrepreneurship Tactics Matrix To Enforce Innovation Infographics PDF. This PPT design covers four stages, thus making it a great tool to use. It also caters to a variety of topics including Enabler, Opportunist, Advocate. Download this PPT design now to present a convincing pitch that not only emphasizes the topic but also showcases your presentation skills.

Eight Levers To Strategic Frameworks For Digital Transformation Infographics PDF
This slide includes digital transformation framework divided into two segments. Broadly this division is premised upon growth drivers and operational improvement. Persuade your audience using this Eight Levers To Strategic Frameworks For Digital Transformation Infographics PDF. This PPT design covers one stages, thus making it a great tool to use. It also caters to a variety of topics including Digital Transformation, Growth Drivers, Operational Improvement. Download this PPT design now to present a convincing pitch that not only emphasizes the topic but also showcases your presentation skills.

Mind Map Of Blue Ocean Leadership Ppt Infographics Layouts PDF
This template covers a tipping point leadership mind map. It shows differences from the conventional approach. It also depicts that blue ocean leadership can help organizations realize oceans of employee potential and stop leaders from wasting their time. The step-by-step process we have outlined gives organizations and leaders a clear roadmap to approach the implementation of blue ocean leadership. Do you know about Slidesgeeks Mind Map Of Blue Ocean Leadership Ppt Infographics Layouts PDF These are perfect for delivering any kind od presentation. Using it, create PowerPoint presentations that communicate your ideas and engage audiences. Save time and effort by using our pre designed presentation templates that are perfect for a wide range of topic. Our vast selection of designs covers a range of styles, from creative to business, and are all highly customizable and easy to edit. Download as a PowerPoint template or use them as Google Slides themes.

Cognitive Sensing Innovation Architecture Of Cognitive Radio Networks Infographics PDF
This slide outlines a cognitive radio network architecture consisting of primary and secondary networks where licensed users use the primary network and unlicensed users use the secondary without interrupting each other. Present like a pro with Cognitive Sensing Innovation Architecture Of Cognitive Radio Networks Infographics PDF Create beautiful presentations together with your team, using our easy-to-use presentation slides. Share your ideas in real-time and make changes on the fly by downloading our templates. So whether you are in the office, on the go, or in a remote location, you can stay in sync with your team and present your ideas with confidence. With Slidegeeks presentation got a whole lot easier. Grab these presentations today.

Managing Employee Turnover Employee Compensation Strategy Infographics PDF
Purpose of the following slide is to show the employee compensation strategy as it displays the key issues within the current strategy along with new policies that the organization needs to introduced. The provided table displays a timeline for implementing these strategies.This is a Managing Employee Turnover Employee Compensation Strategy Infographics PDF template with various stages. Focus and dispense information on one stage using this creative set, that comes with editable features. It contains large content boxes to add your information on topics like Compensation, Decided Compensation, Overall Compensation. You can also showcase facts, figures, and other relevant content using this PPT layout. Grab it now.

Modern Day Talent Sourcing Strategies For Recruitment Consulting Infographics PDF
The Following slide highlights the modern day talent sourcing strategies for recruitment consulting illustrating virtual recruitment, employer value proposition, referral program, aptitude hiring and adaptation.Persuade your audience using this Modern Day Talent Sourcing Strategies For Recruitment Consulting Infographics PDF This PPT design covers five stages, thus making it a great tool to use. It also caters to a variety of topics including Virtual Recruitment, Referral Program, Aptitude Hiring Download this PPT design now to present a convincing pitch that not only emphasizes the topic but also showcases your presentation skills.

Safety Audit Types For Fire Safety At Workplace Infographics PDF
The following slide covers types of safety audit aimed at examining and identifying gaps and issues in safety procedures and ensure compliance to norms. This covers compliance audit, program audit and management system audit. Presenting Safety Audit Types For Fire Safety At Workplace Infographics PDF to dispense important information. This template comprises three stages. It also presents valuable insights into the topics including Compliance Audit, Program Audit, Management System Audit. This is a completely customizable PowerPoint theme that can be put to use immediately. So, download it and address the topic impactfully.
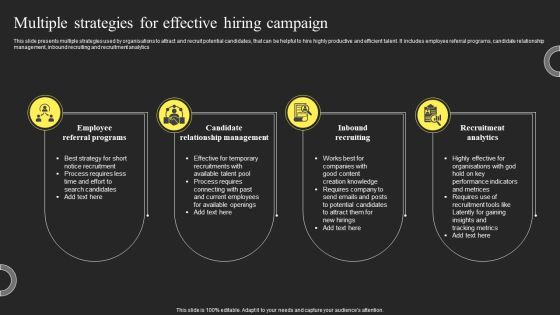
Multiple Strategies For Effective Hiring Campaign Infographics PDF
This slide presents multiple strategies used by organisations to attract and recruit potential candidates, that can be helpful to hire highly productive and efficient talent. It includes employee referral programs, candidate relationship management, inbound recruiting and recruitment analytics. Persuade your audience using this Multiple Strategies For Effective Hiring Campaign Infographics PDF. This PPT design covers four stages, thus making it a great tool to use. It also caters to a variety of topics including Employee Referral Programs, Candidate Relationship Management, Inbound Recruiting. Download this PPT design now to present a convincing pitch that not only emphasizes the topic but also showcases your presentation skills.

Implementation Procedure For Degrees Of Service Management Infographics PDF
This slide mentions the implementation procedure for degrees of service management. It includes gather data, building the plan, executing the plan, reporting of SLM and post implementation review. Persuade your audience using this Implementation Procedure For Degrees Of Service Management Infographics PDF. This PPT design covers five stages, thus making it a great tool to use. It also caters to a variety of topics including Implementation Review, Execute Plan, Build Plan. Download this PPT design now to present a convincing pitch that not only emphasizes the topic but also showcases your presentation skills.

Effective Procurement Flow Diagram To Mitigate Supplier Risk Infographics PDF
The following slide delineates a comprehensive procurement flow chart used to reduce supplier risk. It provides information about originator, project manager, sign-off authority, and super user. Persuade your audience using this Effective Procurement Flow Diagram To Mitigate Supplier Risk Infographics PDF. This PPT design covers four stages, thus making it a great tool to use. It also caters to a variety of topics including Project Manager, Originator, Super User. Download this PPT design now to present a convincing pitch that not only emphasizes the topic but also showcases your presentation skills.

Flow Diagram Illustrating It Procurement Process Infographics PDF
The following slide delineates procurement flow chart used for IT procurement process. The major steps involved in the template are selecting the product, obtaining a VPAT, filling out the IT purchase review form, etc. Persuade your audience using this Flow Diagram Illustrating It Procurement Process Infographics PDF. This PPT design covers one stages, thus making it a great tool to use. It also caters to a variety of topics including Product, Required, Organization. Download this PPT design now to present a convincing pitch that not only emphasizes the topic but also showcases your presentation skills.

Human Resources Performance Indicators Setting Process Diagram Infographics PDF
Following slide includes employee assessment flow chart which can be used to determine staff performance and productivity. It includes cross functioning between personals such as employees, department head, deputy manager, general manager and comprehensive department. Presenting Human Resources Performance Indicators Setting Process Diagram Infographics PDF to dispense important information. This template comprises one stages. It also presents valuable insights into the topics including Head Of Department, Deputy Manager, Reporting Manager, Team Leader. This is a completely customizable PowerPoint theme that can be put to use immediately. So, download it and address the topic impactfully.

AI Applications In Logistics And Supply Chain Management Infographics PDF
This slide covers uses of artificial intelligence in logistics and supply chain management. It involves applications such as demand forecasting models, integrated business planning, dynamic planning optimization and physical flow automation.Persuade your audience using this AI Applications In Logistics And Supply Chain Management Infographics PDF. This PPT design covers four stages, thus making it a great tool to use. It also caters to a variety of topics including Forecasting Models, Integrated Business, Dynamic Planning. Download this PPT design now to present a convincing pitch that not only emphasizes the topic but also showcases your presentation skills.
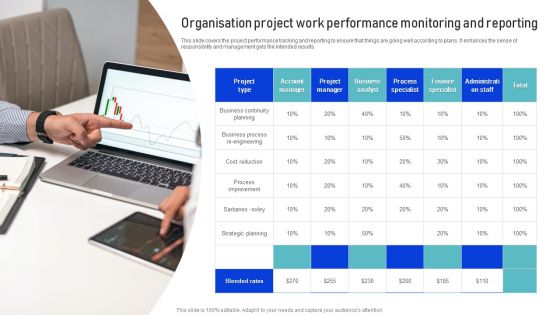
Organisation Project Work Performance Monitoring And Reporting Infographics PDF
This slide covers the project performance tracking and reporting to ensure that things are going well according to plans. It enhances the sense of responsibility and management gets the intended results. Presenting Organisation Project Work Performance Monitoring And Reporting Infographics PDF to dispense important information. This template comprises one stages. It also presents valuable insights into the topics including Business Continuity Planning, Strategic Planning, Business Analyst. This is a completely customizable PowerPoint theme that can be put to use immediately. So, download it and address the topic impactfully.

3 Key Strategic Areas For Effective Marketing Strategy Infographics PDF
This slide provides key strategic areas for developing a marketing plan that generates leads, sales and eventually business growth. It includes define clear goals, select marketing channels and implement efficient plan. Persuade your audience using this 3 Key Strategic Areas For Effective Marketing Strategy Infographics PDF. This PPT design covers three stages, thus making it a great tool to use. It also caters to a variety of topics including Strategy, Marketing Channels, Efficient Plan. Download this PPT design now to present a convincing pitch that not only emphasizes the topic but also showcases your presentation skills.
 Home
Home