Agenda Infographic

Key Capabilities And Skills In Business Analysis Infographics PDF
This slide covers key competencies required for business analysis to assess candidates and efficiently structure resource pool for future tasks. This consists of analytical thinking, behavioural characteristics, business knowledge and interaction skills. Presenting Key Capabilities And Skills In Business Analysis Infographics PDF to dispense important information. This template comprises four stages. It also presents valuable insights into the topics including Analytical Thinking, Behavioural Characteristics, Business Knowledge. This is a completely customizable PowerPoint theme that can be put to use immediately. So, download it and address the topic impactfully.

Chief Information Officer Transition Challenges And Solutions Infographics PDF
This slide includes challenges faced by CIO during transition and solutions to help them create value as member of C-suite. It includes challenges such as retaining IT talent, supporting hybrid work, deploying automation and navigating inflation. Presenting Chief Information Officer Transition Challenges And Solutions Infographics PDF to dispense important information. This template comprises five stages. It also presents valuable insights into the topics including Retaining IT Talent, Supporting Hybrid Work, Deploying Automation. This is a completely customizable PowerPoint theme that can be put to use immediately. So, download it and address the topic impactfully.

Impact Of Artificial Intelligence In Insurance Claims Management Infographics PDF
This slide presents benefits of AI in insurance claims management, helpful in highlighting its importance in making each process smooth and easy. It includes impacts such as risk assessment, fraud detection, human error reduction and customer service management. Persuade your audience using this Impact Of Artificial Intelligence In Insurance Claims Management Infographics PDF. This PPT design covers four stages, thus making it a great tool to use. It also caters to a variety of topics including Risk Assessment, Human Error Reduction, Customer Service Management. Download this PPT design now to present a convincing pitch that not only emphasizes the topic but also showcases your presentation skills.

Timeframe Request For Branding Proposal Ppt Infographics Template PDF
This slide covers the timeline for providing branding services. It includes the major project phases such as discovery meetings, present strategy, initial design concepts, refined designs, and brand guidelines documents. Unleash your creativity with our Timeframe Request For Branding Proposal Ppt Infographics Template PDF single-slide PPT template. Whether you are a seasoned presenter or a newbie, our editable and visually-stunning template will make your presentations shine. This template is versatile and easy to use. Make your presentations unforgettable with our premium template and leave a lasting impression on your audience.

Working Of Software Development Life Cycle Infographics PDF
This slide describes the software development life cycle working that runs in a loop and starts from business needs, solution requirements, solutions features, software needs, analysis and design, code development, testing, and so on. If your project calls for a presentation, then Slidegeeks is your go to partner because we have professionally designed, easy to edit templates that are perfect for any presentation. After downloading, you can easily edit Working Of Software Development Life Cycle Infographics PDF and make the changes accordingly. You can rearrange slides or fill them with different images. Check out all the handy templates.
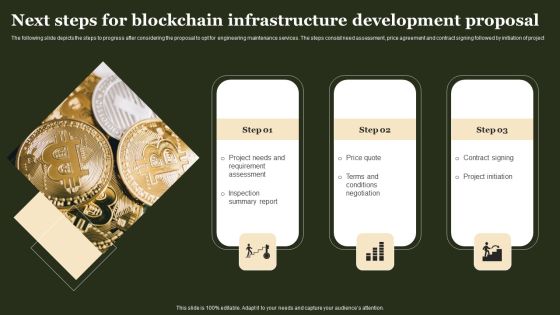
Next Steps For Blockchain Infrastructure Development Proposal Infographics PDF
The following slide depicts the steps to progress after considering the proposal to opt for engineering maintenance services. The steps consist need assessment, price agreement and contract signing followed by initiation of project Take your presentations to the next level with our Next Steps For Blockchain Infrastructure Development Proposal Infographics PDF template. With its sleek design and seamless editing features, this single-slide PPT template is a game-changer for professionals who want to make an impact. Impress your audience with stunning visuals and engaging content that will capture their attention from start to finish. Get your hands on our template and elevate your presentations to new heights.

Problems In The Business Value Chain Infographics PDF
The following template provides solutions to overcome pain points in business value chain to helps minimize delays, which is crucial for maintaining financial efficiency and efficacy. The various challenges are centralized inventory management system, material shortages etc. Presenting Problems In The Business Value Chain Infographics PDF to dispense important information. This template comprises four stages. It also presents valuable insights into the topics including Centralized Inventory Management, Material Shortages, Lack Supply Chain Visibility. This is a completely customizable PowerPoint theme that can be put to use immediately. So, download it and address the topic impactfully.
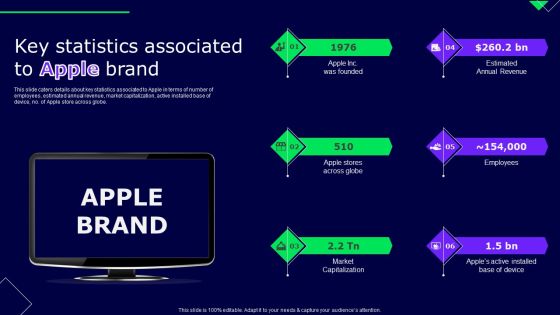
Key Statistics Associated To Apple Brand Ppt Infographics Aids PDF
This slide caters details about key statistics associated to Apple in terms of number of employees, estimated annual revenue, market capitalization, active installed base of device, no. of Apple store across globe. The best PPT templates are a great way to save time, energy, and resources. Slidegeeks have 100 percent editable powerpoint slides making them incredibly versatile. With these quality presentation templates, you can create a captivating and memorable presentation by combining visually appealing slides and effectively communicating your message. Download Key Statistics Associated To Apple Brand Ppt Infographics Aids PDF from Slidegeeks and deliver a wonderful presentation.
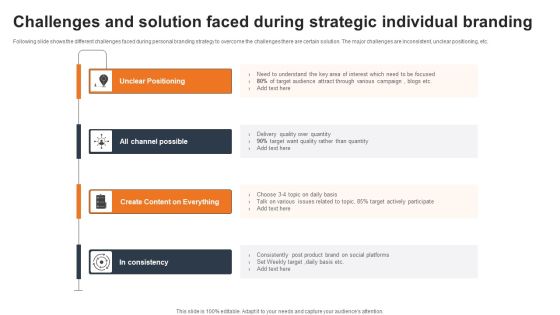
Challenges And Solution Faced During Strategic Individual Branding Infographics PDF
Following slide shows the different challenges faced during personal branding strategy to overcome the challenges there are certain solution. The major challenges are inconsistent, unclear positioning, etc. Persuade your audience using this Challenges And Solution Faced During Strategic Individual Branding Infographics PDF. This PPT design covers four stages, thus making it a great tool to use. It also caters to a variety of topics including Target, Social Platforms, Product Brand. Download this PPT design now to present a convincing pitch that not only emphasizes the topic but also showcases your presentation skills.
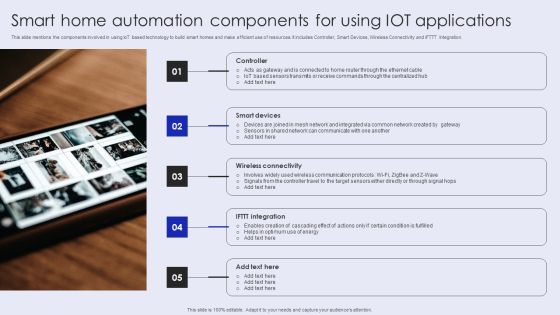
Smart Home Automation Components For Using Iot Applications Infographics PDF
This slide mentions the components involved in using IoT based technology to build smart homes and make efficient use of resources. It includes Controller, Smart Devices, Wireless Connectivity and IFTTT Integration. Persuade your audience using this Smart Home Automation Components For Using Iot Applications Infographics PDF. This PPT design covers five stages, thus making it a great tool to use. It also caters to a variety of topics including Smart Devices, Wireless Connectivity, Controller. Download this PPT design now to present a convincing pitch that not only emphasizes the topic but also showcases your presentation skills.
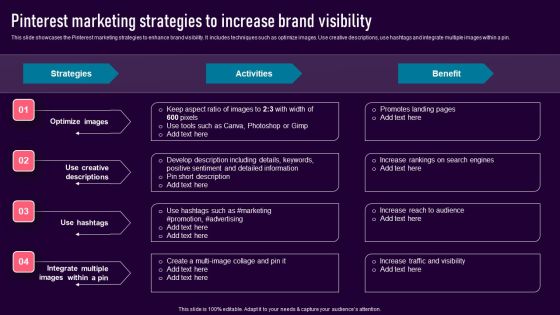
Pinterest Marketing Strategies To Increase Brand Visibility Infographics PDF
This slide showcases the Pinterest marketing strategies to enhance brand visibility. It includes techniques such as optimize images. Use creative descriptions, use hashtags and integrate multiple images within a pin. Slidegeeks is one of the best resources for PowerPoint templates. You can download easily and regulate Pinterest Marketing Strategies To Increase Brand Visibility Infographics PDF for your personal presentations from our wonderful collection. A few clicks is all it takes to discover and get the most relevant and appropriate templates. Use our Templates to add a unique zing and appeal to your presentation and meetings. All the slides are easy to edit and you can use them even for advertisement purposes.

Global Communication Strategies To Reach Transnational Customers Infographics PDF
Following slide describes global communication strategies used by businesses to increase customer base. It includes strategies such as global standardization strategy, transactional strategy, international strategy and localization strategy. Persuade your audience using this Global Communication Strategies To Reach Transnational Customers Infographics PDF. This PPT design covers four stages, thus making it a great tool to use. It also caters to a variety of topics including Global Standardization Strategy, Transnational Strategy, Localization Strategy. Download this PPT design now to present a convincing pitch that not only emphasizes the topic but also showcases your presentation skills.
Smart Strategies For Coordinate With Various Teams Infographics PDF
This slide presents smart strategies for collaborating with different teams helpful in building comprehensive approach for team alliance and making project successful. It includes involving research and go-to-market member, strong management oversight, design thinking approach and weekly blueprint sessions. Introducing Smart Strategies For Coordinate With Various Teams Infographics PDF. to increase your presentation threshold. Encompassed with four stages, this template is a great option to educate and entice your audience. Dispence information on Strong Management Oversight, Design Thinking Approach, Weekly Blueprint Sessions, using this template. Grab it now to reap its full benefits.
Use Cases Of Problem Analysis Procedure Infographics PDF
This slide highlights solutions to root cause analysis use cases aimed at understanding and overcome barriers using potential remedies. The basis of challenges are problem definition, systematic approach, investigations, decision making, detail use and skills. Showcasing this set of slides titled Use Cases Of Problem Analysis Procedure Infographics PDF. The topics addressed in these templates are Systematic Approach, Skill Availability, Unimportant Data. All the content presented in this PPT design is completely editable. Download it and make adjustments in color, background, font etc. as per your unique business setting.
SAP Intelligent Robotic Process Automation Framework Infographics PDF
This slide illustrates a high-level overview of smart CDS core data services view assistant to automate the complex process and reduce organizational time and cost. It includes elements such as SAP conversational artificial intelligence, S or 4HANA etc. Presenting SAP Intelligent Robotic Process Automation Framework Infographics PDF to dispense important information. This template comprises two stages. It also presents valuable insights into the topics including Data Sources, Locate Custom, Sap Conversational Artificial Intelligence. This is a completely customizable PowerPoint theme that can be put to use immediately. So, download it and address the topic impactfully.

Strategic Talent Procurement Analytics With Cognition Insights Infographics PDF
This slide exhibits various analytics solutions that exist in candidate sourcing and screening which can potentially increase new-hire quality and reduce the impact of selection biases. It includes cognitive insights, cognitive automation, and cognitive engagement. Presenting Strategic Talent Procurement Analytics With Cognition Insights Infographics PDF to dispense important information. This template comprises six stages. It also presents valuable insights into the topics including Data Mining, Artificial Intelligence, Pattern Recognition, Smart Chatbots. This is a completely customizable PowerPoint theme that can be put to use immediately. So, download it and address the topic impactfully.
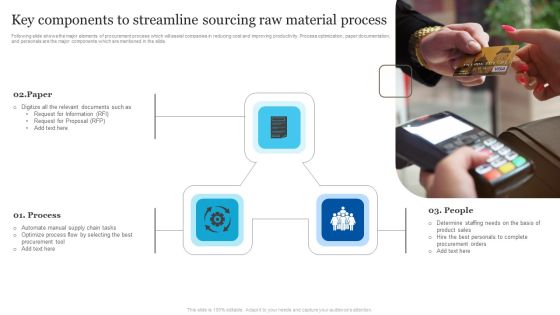
Key Components To Streamline Sourcing Raw Material Process Infographics PDF
Following slide shows the major elements of procurement process which will assist companies in reducing cost and improving productivity. Process optimization, paper documentation, and personals are the major components which are mentioned in the slide. Persuade your audience using this Key Components To Streamline Sourcing Raw Material Process Infographics PDF. This PPT design covers three stages, thus making it a great tool to use. It also caters to a variety of topics including Paper, Process, People. Download this PPT design now to present a convincing pitch that not only emphasizes the topic but also showcases your presentation skills.

Real Time Market Analytics Benefits And Impact Infographics PDF
The slide showcases marketing benefits and impacts of real-time data analytics. It covers improves website performance, removes underperforming elements, keeps track of current trends, optimizes conversions. Presenting Real Time Market Analytics Benefits And Impact Infographics PDF to dispense important information. This template comprises four stages. It also presents valuable insights into the topics including Improves Website Performance, Removes Underperforming Elements, Optimizes Conversions. This is a completely customizable PowerPoint theme that can be put to use immediately. So, download it and address the topic impactfully.
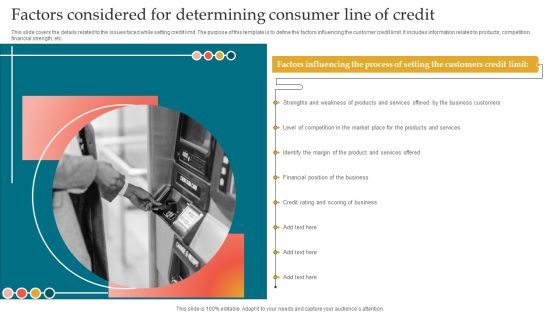
Factors Considered For Determining Consumer Line Of Credit Infographics PDF
This slide covers the details related to the issues faced while setting credit limit. The purpose of this template is to define the factors influencing the customer credit limit. It includes information related to products, competition, financial strength, etc. Presenting Factors Considered For Determining Consumer Line Of Credit Infographics PDF to dispense important information. This template comprises one stages. It also presents valuable insights into the topics including Business Customers, Products And Services, Financial Position. This is a completely customizable PowerPoint theme that can be put to use immediately. So, download it and address the topic impactfully.

Six Months High Level Project Design Concept Strategy Infographics PDF
The slide represents a biannual project roadmap with a design framework. It highlights all the phases beginning with the clients request to execute a project. It helps the firm track down project goals, timelines, and outcomes for the specific project. It includes critical phases, activities, and time in which the task has to be completed. Persuade your audience using this Six Months High Level Project Design Concept Strategy Infographics PDF. This PPT design covers Six stages, thus making it a great tool to use. It also caters to a variety of topics including Concept Strategy, Sales Presentation, Review Proposals. Download this PPT design now to present a convincing pitch that not only emphasizes the topic but also showcases your presentation skills.
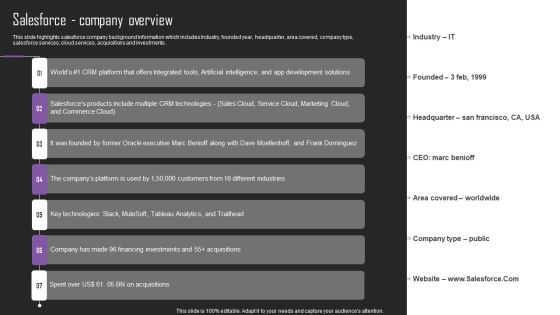
Web Hosting Software Company Outline Salesforce Company Overview Infographics PDF
This slide highlights salesforce company background information which includes Industry, founded year, headquarter, area covered, company type, salesforce services, cloud services, acquisitions and investments. Coming up with a presentation necessitates that the majority of the effort goes into the content and the message you intend to convey. The visuals of a PowerPoint presentation can only be effective if it supplements and supports the story that is being told. Keeping this in mind our experts created Web Hosting Software Company Outline Salesforce Company Overview Infographics PDF to reduce the time that goes into designing the presentation. This way, you can concentrate on the message while our designers take care of providing you with the right template for the situation.

Marketing Success Metrics Implementing Marketing Analytics On Various Infographics PDF
This slide covers various types of marketing channel analytics, such as landing page or website, SEO, email, paid search, social media, and blog analytics. Slidegeeks has constructed Marketing Success Metrics Implementing Marketing Analytics On Various Infographics PDF after conducting extensive research and examination. These presentation templates are constantly being generated and modified based on user preferences and critiques from editors. Here, you will find the most attractive templates for a range of purposes while taking into account ratings and remarks from users regarding the content. This is an excellent jumping-off point to explore our content and will give new users an insight into our top-notch PowerPoint Templates.

About Us For Infrastructure Maintenance And Service Proposal Infographics PDF
The following slide highlights the brief details of company work, objectives, and previous service records. It further shows expert services which include electrical system and equipment, HVAC maintenance, and safety audit. Elevate your presentations with our intuitive About Us For Infrastructure Maintenance And Service Proposal Infographics PDF template. Whether youre delivering a pitch, sharing data, or presenting ideas, our visually-stunning single-slide PPT template is the perfect tool to captivate your audience. With 100 percent editable features and a user-friendly interface, creating professional presentations has never been easier. Download now and leave a lasting impression.
Employee Training Status Report With Activities Infographics PDF
This slide presents the training progress report that records the time involved in completing specific training activities that enables the manager to analyze reasons for the delay. It includes elements such as training activities, employee name, responsible, status, etc. Pitch your topic with ease and precision using this Employee Training Status Report With Activities Infographics PDF. This layout presents information on Team Building Exercise, Customer Experience Optimization, Product Management. It is also available for immediate download and adjustment. So, changes can be made in the color, design, graphics or any other component to create a unique layout.
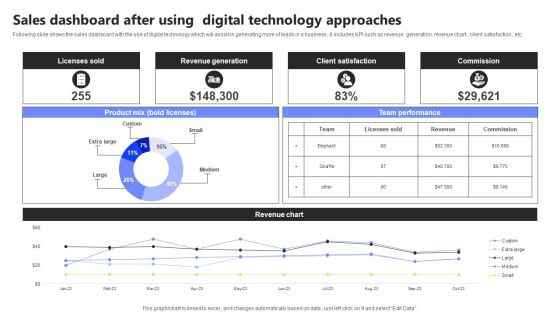
Sales Dashboard After Using Digital Technology Approaches Infographics PDF
Following slide shows the sales dashboard with the use of digital technology which will assist in generating more of leads in a business . It includes KPI such as revenue generation, revenue chart , client satisfaction , etc. Showcasing this set of slides titled Sales Dashboard After Using Digital Technology Approaches Infographics PDF. The topics addressed in these templates are Licenses Sold, Revenue Generation, Client Satisfaction. All the content presented in this PPT design is completely editable. Download it and make adjustments in color, background, font etc. as per your unique business setting.
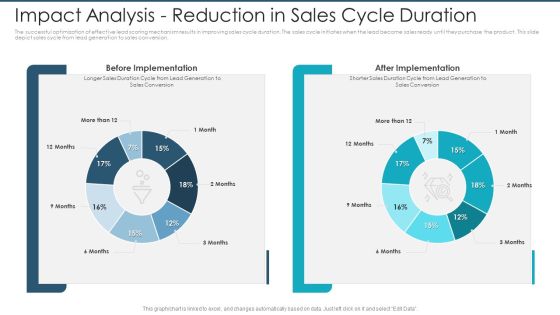
Impact Analysis Reduction In Sales Cycle Duration Infographics PDF
The successful optimization of effective lead scoring mechanism results in improving sales cycle duration. The sales cycle initiates when the lead become sales ready until they purchase the product. This slide depict sales cycle from lead generation to sales conversion.Deliver an awe-inspiring pitch with this creative impact analysis reduction in sales cycle duration infographics pdf. bundle. Topics like before implementation, after implementation can be discussed with this completely editable template. It is available for immediate download depending on the needs and requirements of the user.

Growing Risk Of Unemployment And Job Loss Infographics PDF
This slide provides risk of unemployment and job loss during coronavirus. Under this, it covers the unemployment rate from Jan 2019 to May 2020 in China, Australia, Germany, USA, South Korea along with the key facts related to job cut in fitness sector.Deliver and pitch your topic in the best possible manner with this growing risk of unemployment and job loss infographics pdf. Use them to share invaluable insights on employees, key facts related to job cut in fitness and other related sectors and impress your audience. This template can be altered and modified as per your expectations. So, grab it now.

Other Kpis Key Performance Indicators After Strategy Implementation Infographics PDF
The slide shows the forecast of the companys key KPIs key performance indicators from 2020 to 2024. Major KPIS include RPAS Revenue per available seat, total passengers, number of flights, number of fatality etc. Deliver and pitch your topic in the best possible manner with this other kpis key performance indicators after strategy implementation infographics pdf. Use them to share invaluable insights on other kpis key performance indicators after strategy implementation and impress your audience. This template can be altered and modified as per your expectations. So, grab it now.
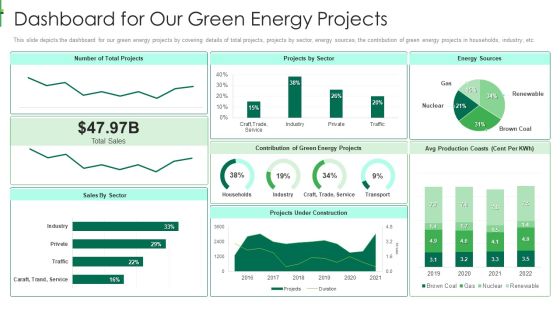
Sustainable Energy Dashboard For Our Green Energy Projects Infographics PDF
This slide depicts the dashboard for our green energy projects by covering details of total projects, projects by sector, energy sources, the contribution of green energy projects in households, industry, etc.Deliver and pitch your topic in the best possible manner with this sustainable energy dashboard for our green energy projects infographics pdf Use them to share invaluable insights on dashboard for our green energy projects and impress your audience. This template can be altered and modified as per your expectations. So, grab it now.

Graph Indicating Clinical Trial Phases Probability Of Success Infographics PDF
This slide compares and visually presents the success rate of each stage with preceding one of the clinical research procedures to represent the achievement of the drug efficacy objective of the firm.Deliver and pitch your topic in the best possible manner with this Graph Indicating Clinical Trial Phases Probability Of Success Infographics PDF Use them to share invaluable insights on Graph Indicating Clinical Trial Phases Probability Of Success and impress your audience. This template can be altered and modified as per your expectations. So, grab it now.

Organization IT Service Desk Administration Performance Dashboard Infographics PDF
This slide represents the dashboard showing the performance of the service desk management team of the organization. It shows details related to benchmark achieved, customer satisfaction, contracts by type and manufacturer, incidents by category, computer by status, service level management etc. Showcasing this set of slides titled Organization IT Service Desk Administration Performance Dashboard Infographics PDF. The topics addressed in these templates are Service, Management, Manufacturer. All the content presented in this PPT design is completely editable. Download it and make adjustments in color, background, font etc. as per your unique business setting.
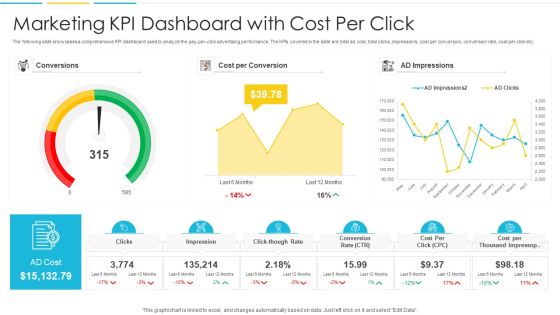
Marketing KPI Dashboard With Cost Per Click Infographics PDF
The following slide showcases a comprehensive KPI dashboard used to analyze the pay-per-click advertising performance. The KPIs covered in the slide are total ad cost, total clicks, impressions, cost per conversion, conversion rate, cost per click etc. Pitch your topic with ease and precision using this Marketing KPI Dashboard With Cost Per Click Infographics PDF. This layout presents information on Conversions, Cost, Impressions. It is also available for immediate download and adjustment. So, changes can be made in the color, design, graphics or any other component to create a unique layout.
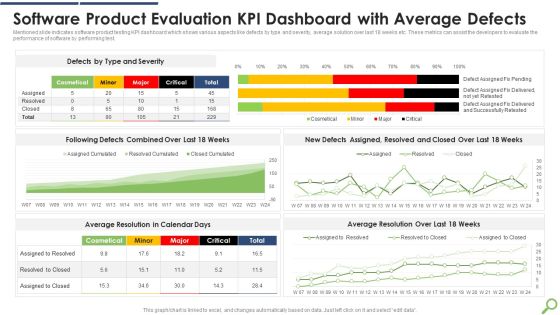
Software Product Evaluation KPI Dashboard With Average Defects Infographics PDF
Mentioned slide indicates software product testing KPI dashboard which shows various aspects like defects by type and severity, average solution over last 18 weeks etc. These metrics can assist the developers to evaluate the performance of software by performing test.Showcasing this set of slides titled Software Product Evaluation KPI Dashboard With Average Defects Infographics PDF The topics addressed in these templates are Software Product, Evaluation Dashboard, Average Defects All the content presented in this PPT design is completely editable. Download it and make adjustments in color, background, font etc. as per your unique business setting.

Client Portfolio Analysis At Different Bank Branches Infographics PDF
This slide shows the customer portfolio analysis at different branch offices of bank which covers gender, age, liquid assets, country of origin and occupation such as business, retired or not working, etc. that helps in preparing customer portfolio on demographic basis.Showcasing this set of slides titled Client Portfolio Analysis At Different Bank Branches Infographics PDF The topics addressed in these templates are Client Portfolio, Analysis Different, Bank Branches All the content presented in this PPT design is completely editable. Download it and make adjustments in color, background, font etc. as per your unique business setting.
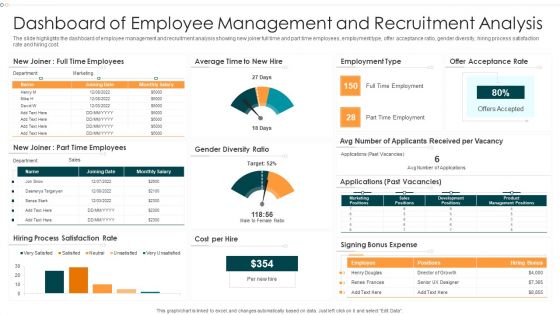
Dashboard Of Employee Management And Recruitment Analysis Infographics PDF
The slide highlights the dashboard of employee management and recruitment analysis showing new joiner full time and part time employees, employment type, offer acceptance ratio, gender diversity, hiring process satisfaction rate and hiring cost.Pitch your topic with ease and precision using this Dashboard Of Employee Management And Recruitment Analysis Infographics PDF This layout presents information on Dashboard Employee, Management, Recruitment Analysis It is also available for immediate download and adjustment. So, changes can be made in the color, design, graphics or any other component to create a unique layout.

Financial Performance Introduction Of Supply Chain Management Organization Infographics PDF
This slide showcases introduction to statistics that can help supply chain management organization to evaluate the financial performance. Its key components are revenue, net income and revenue sources.Pitch your topic with ease and precision using this Financial Performance Introduction Of Supply Chain Management Organization Infographics PDF This layout presents information on Revenue Sources, Revenue Increased, Income Increased It is also available for immediate download and adjustment. So, changes can be made in the color, design, graphics or any other component to create a unique layout.
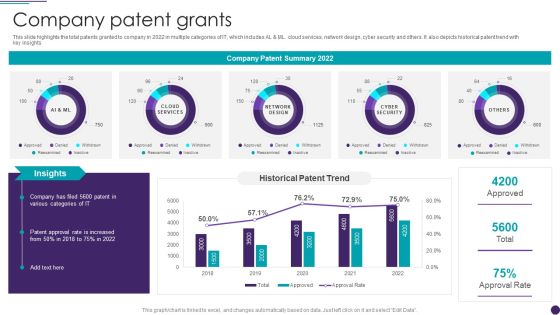
IT Services Business Profile Company Patent Grants Infographics PDF
This slide highlights the total patents granted to company in 2022 in multiple categories of IT, which includes AL and ML. cloud services, network design, cyber security and others. It also depicts historical patent trend with key insights. Deliver an awe inspiring pitch with this creative IT Services Business Profile Company Patent Grants Infographics PDF bundle. Topics like Network Design, Cyber Security, Cloud Services can be discussed with this completely editable template. It is available for immediate download depending on the needs and requirements of the user.
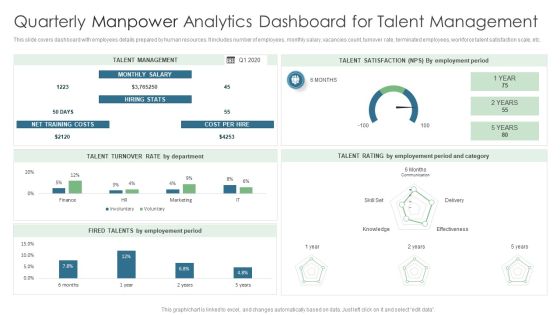
Quarterly Manpower Analytics Dashboard For Talent Management Infographics PDF
This slide covers dashboard with employees details prepared by human resources. It includes number of employees, monthly salary, vacancies count, turnover rate, terminated employees, workforce talent satisfaction scale, etc. Showcasing this set of slides titled Quarterly Manpower Analytics Dashboard For Talent Management Infographics PDF. The topics addressed in these templates are Talent Management, Cost Per Hire, Net Training Costs. All the content presented in this PPT design is completely editable. Download it and make adjustments in color, background, font etc. as per your unique business setting.
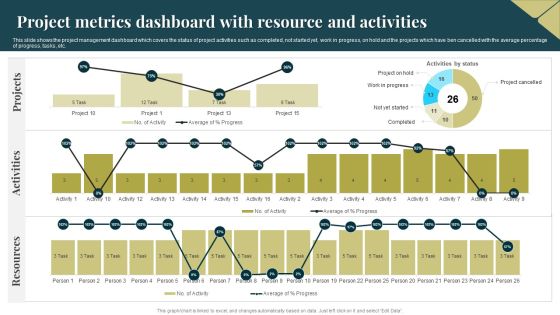
Project Metrics Dashboard With Resource And Activities Infographics PDF
This slide shows the project management dashboard which covers the status of project activities such as completed, not started yet, work in progress, on hold and the projects which have ben cancelled with the average percentage of progress, tasks, etc. Showcasing this set of slides titled Project Metrics Dashboard With Resource And Activities Infographics PDF. The topics addressed in these templates are Activities, Projects, Resources. All the content presented in this PPT design is completely editable. Download it and make adjustments in color, background, font etc. as per your unique business setting.

Customer Service Metrics Dashboard For Email And Chat Infographics PDF
This slide showcases dashboard for customer service metrics that can help to identify the customer satisfaction score plus implement strategies in case of decline. Its key KPIs are first response time, requester wait time, first response time and time to close. Pitch your topic with ease and precision using this Customer Service Metrics Dashboard For Email And Chat Infographics PDF. This layout presents information on Customer Service, Metrics Dashboard, Email And Chat. It is also available for immediate download and adjustment. So, changes can be made in the color, design, graphics or any other component to create a unique layout.

Internal Organizational Communication Kpis And Dashboard With Channels Infographics PDF
This slide showcases dashboard that can help organization to assess the performance of internal communication and analyzing the user participation. Its key components are message success, channels and user engagement. Pitch your topic with ease and precision using this Internal Organizational Communication Kpis And Dashboard With Channels Infographics PDF. This layout presents information on User Participation, User Engagement, Message Success. It is also available for immediate download and adjustment. So, changes can be made in the color, design, graphics or any other component to create a unique layout.

Account Based Marketing Customer Engagement Dashboard Infographics PDF
Purpose of the following slide is to show key metrics that can help the organization to track their account based marketing efforts, it highlights essential KPIs such as CTR, session by account. Boost your pitch with our creative Account Based Marketing Customer Engagement Dashboard Infographics PDF. Deliver an awe inspiring pitch that will mesmerize everyone. Using these presentation templates you will surely catch everyones attention. You can browse the ppts collection on our website. We have researchers who are experts at creating the right content for the templates. So you do not have to invest time in any additional work. Just grab the template now and use them.
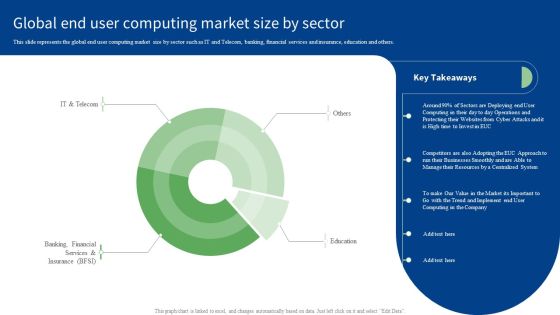
Global End User Computing Market Size By Sector Infographics PDF
This slide represents the global end user computing market size by sector such as IT and Telecom, banking, financial services and insurance, education and others. Boost your pitch with our creative Global End User Computing Market Size By Sector Infographics PDF. Deliver an awe-inspiring pitch that will mesmerize everyone. Using these presentation templates you will surely catch everyones attention. You can browse the ppts collection on our website. We have researchers who are experts at creating the right content for the templates. So you do not have to invest time in any additional work. Just grab the template now and use them.

Marketing Channels Return On Investment ROI Comparison Infographics PDF
This slide covers the return of investment from various promotional channels such as social media, banner ads, SEO, paid marketing, affiliate marketing, and email marketing. The best PPT templates are a great way to save time, energy, and resources. Slidegeeks have 100 percent editable powerpoint slides making them incredibly versatile. With these quality presentation templates, you can create a captivating and memorable presentation by combining visually appealing slides and effectively communicating your message. Download Marketing Channels Return On Investment ROI Comparison Infographics PDF from Slidegeeks and deliver a wonderful presentation.

Segmentation Of Target Audience Retail Merchandising Techniques Infographics PDF
Are you in need of a template that can accommodate all of your creative concepts This one is crafted professionally and can be altered to fit any style. Use it with Google Slides or PowerPoint. Include striking photographs, symbols, depictions, and other visuals. Fill, move around, or remove text boxes as desired. Test out color palettes and font mixtures. Edit and save your work, or work with colleagues. Download Segmentation Of Target Audience Retail Merchandising Techniques Infographics PDF and observe how to make your presentation outstanding. Give an impeccable presentation to your group and make your presentation unforgettable.

Information Technology Operations Operations Dashboard For Issues Management Infographics PDF
The slide illustrates various KPIs to manage and track IT operations in business. Various elements included in the dashboard are month-wise issue status, types of issues, average resolution time, overall status and resolved issues. Showcasing this set of slides titled Information Technology Operations Operations Dashboard For Issues Management Infographics PDF. The topics addressed in these templates are Information Technology Operations, Operations Dashboard, Issues Management. All the content presented in this PPT design is completely editable. Download it and make adjustments in color, background, font etc. as per your unique business setting.

Dashboard Showing Monitoring Campaign Of Marketing Ppt Infographics PDF
This slide represents dashboard showcasing campaign report. It includes recipients, email clients, open rate, spam complaints etc that enable organization in analyzing progress of marketing campaign to develop more effective strategies. Showcasing this set of slides titled Dashboard Showing Monitoring Campaign Of Marketing Ppt Infographics PDF. The topics addressed in these templates are Recipients, Open Rate, Spam Complaints, Shares. All the content presented in this PPT design is completely editable. Download it and make adjustments in color, background, font etc. as per your unique business setting.
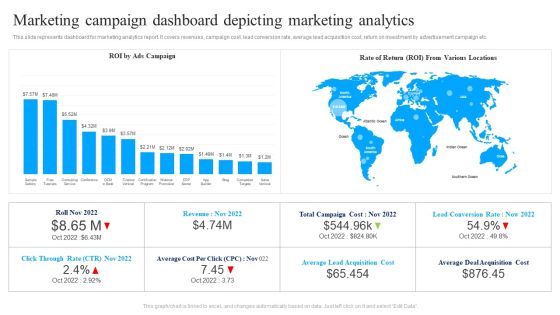
Marketing Campaign Dashboard Depicting Marketing Analytics Ppt Summary Infographics PDF
This slide represents dashboard for marketing analytics report. It covers revenues, campaign cost, lead conversion rate, average lead acquisition cost, return on investment by advertisement campaign etc. Pitch your topic with ease and precision using this Marketing Campaign Dashboard Depicting Marketing Analytics Ppt Summary Infographics PDF. This layout presents information on ROI Ads Campaign, Rate Of Return, Various Locations. It is also available for immediate download and adjustment. So, changes can be made in the color, design, graphics or any other component to create a unique layout.

Dashboard For Skill Assessment During Leadership Recruitment Infographics PDF
The slide shows industry wise top skills that are assessed during leadership hiring. It includes skill assessment in hiring by different industries, average time taken in hiring, skill assessment tools in leadership hiring. Showcasing this set of slides titled Dashboard For Skill Assessment During Leadership Recruitment Infographics PDF. The topics addressed in these templates are Skill Assessment Tools, Skill Analysis. All the content presented in this PPT design is completely editable. Download it and make adjustments in color, background, font etc. as per your unique business setting.

Top Skills Assessed During Leadership Recruitment Infographics PDF
The slide showcases various skill that organizations assess during leadership recruiting. It includes cognitive skills, personality skills, domain skills, key insights, applications received, applications accepted , total hired leaders and cost of hiring. Showcasing this set of slides titled Top Skills Assessed During Leadership Recruitment Infographics PDF. The topics addressed in these templates are Cognitive Skills, Personality Skills, Domain Skills. All the content presented in this PPT design is completely editable. Download it and make adjustments in color, background, font etc. as per your unique business setting.
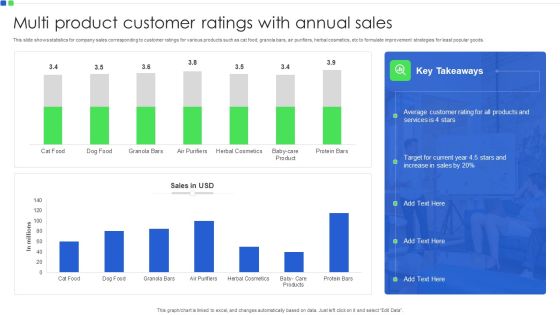
Multi Product Customer Ratings With Annual Sales Infographics PDF
This slide shows statistics for company sales corresponding to customer ratings for various products such as cat food, granola bars, air purifiers, herbal cosmetics, etc to formulate improvement strategies for least popular goods. Showcasing this set of slides titled Multi Product Customer Ratings With Annual Sales Infographics PDF. The topics addressed in these templates are Target For Current Year, Average Customer Rating. All the content presented in this PPT design is completely editable. Download it and make adjustments in color, background, font etc. as per your unique business setting.

IT Project Change Management Operations Analysis Dashboard Infographics PDF
This slide shows the dashboard representing the operational analysis related to change management of an IT project. It shows details related to top requesting groups, outstanding change requests, outstanding age breakdown etc.Pitch your topic with ease and precision using this IT Project Change Management Operations Analysis Dashboard Infographics PDF. This layout presents information on Outstanding Requests, Outstanding Breakdown, Outstanding Changes. It is also available for immediate download and adjustment. So, changes can be made in the color, design, graphics or any other component to create a unique layout.

Virtual Assistant Global Market Share By Applications Infographics PDF
This slide depicts share of virtual assistants in global market based on usage in several industries. It includes industries such as BFSI, consumer electronics, automative, healthcare, education, retail, IT, travel and hospitality. Showcasing this set of slides titled Virtual Assistant Global Market Share By Applications Infographics PDF. The topics addressed in these templates are Consumer Electronics, Automotive, Demand Advanced. All the content presented in this PPT design is completely editable. Download it and make adjustments in color, background, font etc. as per your unique business setting.
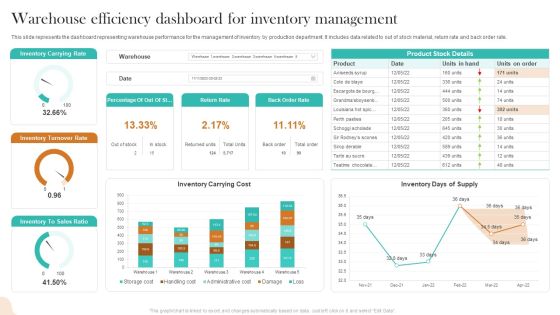
Warehouse Efficiency Dashboard For Inventory Management Infographics PDF
This slide represents the dashboard representing warehouse performance for the management of inventory by production department. It includes data related to out of stock material, return rate and back order rate. Showcasing this set of slides titled Warehouse Efficiency Dashboard For Inventory Management Infographics PDF. The topics addressed in these templates are Inventory Carrying Rate, Inventory Turnover Rate, Inventory Carrying Cost. All the content presented in this PPT design is completely editable. Download it and make adjustments in color, background, font etc. as per your unique business setting.

Stakeholders Management Strategy With Engagement Dashboard Infographics PDF
The following slide displays key parameters to map involvement of stakeholders in the business by analyzing them on the basis of influence, interest and impact to monitor and improve overall communication strategies of organization. Pitch your topic with ease and precision using this Stakeholders Management Strategy With Engagement Dashboard Infographics PDF. This layout presents information on Influence, Interest, Impact. It is also available for immediate download and adjustment. So, changes can be made in the color, design, graphics or any other component to create a unique layout.

Revenue Generated From Operations Administration In It Services Infographics PDF
This slide illustrates the graphical representation of revenue generated from operation management in IT services in the recent years. It shows the revenue in millions of US dollars from 2015 to 2022 and expected revenue generation in upcoming years. Pitch your topic with ease and precision using this Revenue Generated From Operations Administration In It Services Infographics PDF. This layout presents information on Revenue, Management, Cloud Computing. It is also available for immediate download and adjustment. So, changes can be made in the color, design, graphics or any other component to create a unique layout.
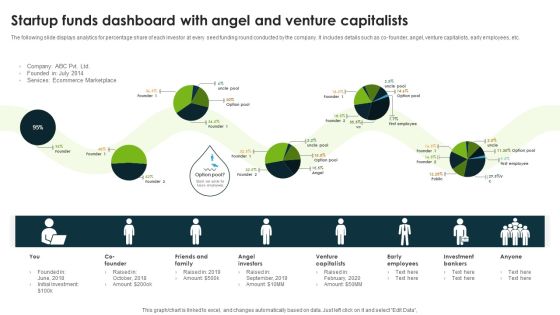
Startup Funds Dashboard With Angel And Venture Capitalists Infographics PDF
The following slide displays analytics for percentage share of each investor at every seed funding round conducted by the company. It includes details such as co founder, angel, venture capitalists, early employees, etc. Showcasing this set of slides titled Startup Funds Dashboard With Angel And Venture Capitalists Infographics PDF. The topics addressed in these templates are Angel Investors, Venture Capitalists, Early Employees. All the content presented in this PPT design is completely editable. Download it and make adjustments in color, background, font etc. as per your unique business setting.
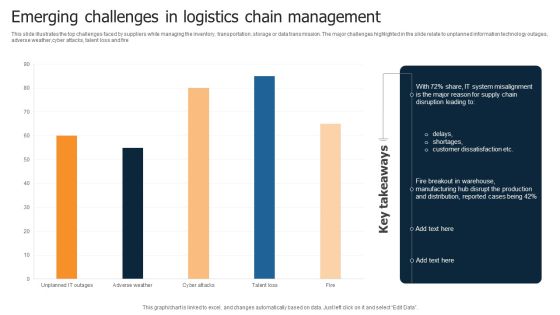
Emerging Challenges In Logistics Chain Management Infographics PDF
This slide illustrates the top challenges faced by suppliers while managing the inventory, transportation, storage or data transmission. The major challenges highlighted in the slide relate to unplanned information technology outages, adverse weather,cyber attacks, talent loss and fire Showcasing this set of slides titled Emerging Challenges In Logistics Chain Management Infographics PDF. The topics addressed in these templates are System Misalignment, Disruption Leading, Customer Dissatisfaction. All the content presented in this PPT design is completely editable. Download it and make adjustments in color, background, font etc. as per your unique business setting.
Website Leads Tracking Dashboard With Traffic Sources Infographics PDF
This slide showcases dashboard for lead generation that can help organziation to identify the traffic sources plus visitors and make changes in SEO of website. It also showcases key metrics that are bounce rate by week, visitors by user type, top channels by conversion, top campaign by conversion and top pages by conversion. Pitch your topic with ease and precision using this Website Leads Tracking Dashboard With Traffic Sources Infographics PDF. This layout presents information on Visitors User Type, Traffic Sources, Bounce Rate Week. It is also available for immediate download and adjustment. So, changes can be made in the color, design, graphics or any other component to create a unique layout.

International Fintech Industry With Market Size Infographics PDF
This slide showcases global report that can help organizations to estimate future growth and identify the market share of different fintech segments. It also showcases fintech startups by region, market and investment in different countries. Showcasing this set of slides titled International Fintech Industry With Market Size Infographics PDF. The topics addressed in these templates are Fintech Segments, Region, Fintech Investment. All the content presented in this PPT design is completely editable. Download it and make adjustments in color, background, font etc. as per your unique business setting.
 Home
Home