Agenda Infographic

Customer Retention Strategies Ppt PowerPoint Presentation Infographics Background Images
This is a customer retention strategies ppt powerpoint presentation infographics background images. This is a six stage process. The stages in this process are regular reviews, loyalty programs, personal touches, premiums and gifts.
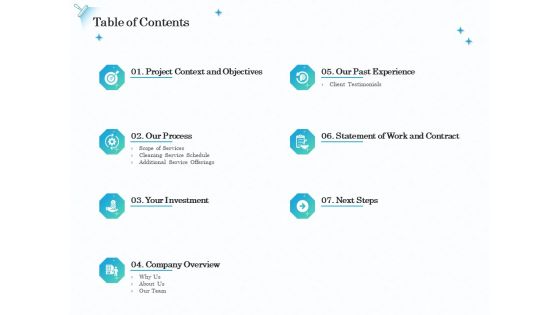
Professional Sanitation Solutions Table Of Contents Ppt Infographics Outfit PDF
Presenting this set of slides with name professional sanitation solutions table of contents ppt infographics outfit pdf. The topics discussed in these slides are project context and objectives, our process, your investment, company overview, our past experience, statement of work and contract, next steps. This is a completely editable PowerPoint presentation and is available for immediate download. Download now and impress your audience.

HVAC Table Of Contents Ppt Infographics Design Inspiration PDF
Presenting this set of slides with name hvac table of contents ppt infographics design inspiration pdf. The topics discussed in these slides are project context and objectives, our process, your investment, company overview, our past experience, statement of work and contract, next steps. This is a completely editable PowerPoint presentation and is available for immediate download. Download now and impress your audience.

Business Management Research Table Of Contents Ppt Infographics Ideas PDF
Presenting this set of slides with name business management research table of contents ppt infographics ideas pdf. The topics discussed in these slides are project context and objectives, our process, your investment, company overview, our past experience, statement of work and contract, next steps. This is a completely editable PowerPoint presentation and is available for immediate download. Download now and impress your audience.

Academic Study Proposal Table Of Contents Ppt Infographics Outfit PDF
Presenting this set of slides with name academic study proposal table of contents ppt infographics outfit pdf. This is a seven stage process. The stages in this process are context and objectives, process, investment, company overview, next steps. This is a completely editable PowerPoint presentation and is available for immediate download. Download now and impress your audience.

Table Of Contents Ppt Infographics Background Designs PDF
Deliver an awe-inspiring pitch with this creative table of contents ppt infographics background designs pdf. bundle. Topics like security, measures, performance, future targets, implementation can be discussed with this completely editable template. It is available for immediate download depending on the needs and requirements of the user.

Half Yearly Business Analytics Analyst Career Roadmap Infographics
We present our half yearly business analytics analyst career roadmap infographics. This PowerPoint layout is easy-to-edit so you can change the font size, font type, color, and shape conveniently. In addition to this, the PowerPoint layout is Google Slides compatible, so you can share it with your audience and give them access to edit it. Therefore, download and save this well-researched half yearly business analytics analyst career roadmap infographics in different formats like PDF, PNG, and JPG to smoothly execute your business plan.

Half Yearly Business Process Advancement Validation Roadmap Infographics
We present our half yearly business process advancement validation roadmap infographics. This PowerPoint layout is easy-to-edit so you can change the font size, font type, color, and shape conveniently. In addition to this, the PowerPoint layout is Google Slides compatible, so you can share it with your audience and give them access to edit it. Therefore, download and save this well-researched half yearly business process advancement validation roadmap infographics in different formats like PDF, PNG, and JPG to smoothly execute your business plan.

3 Months Roadmap For Business ITSM Execution Infographics
We present our 3 months roadmap for business itsm execution infographics. This PowerPoint layout is easy-to-edit so you can change the font size, font type, color, and shape conveniently. In addition to this, the PowerPoint layout is Google Slides compatible, so you can share it with your audience and give them access to edit it. Therefore, download and save this well-researched 3 months roadmap for business itsm execution infographics in different formats like PDF, PNG, and JPG to smoothly execute your business plan.

Professional Development Career Trajectory Half Yearly Roadmap Infographics
We present our professional development career trajectory half yearly roadmap infographics. This PowerPoint layout is easy-to-edit so you can change the font size, font type, color, and shape conveniently. In addition to this, the PowerPoint layout is Google Slides compatible, so you can share it with your audience and give them access to edit it. Therefore, download and save this well-researched professional development career trajectory half yearly roadmap infographics in different formats like PDF, PNG, and JPG to smoothly execute your business plan.

Project Management Phases Ppt PowerPoint Presentation Infographics Brochure
This is a project management phases ppt powerpoint presentation infographics brochure. This is a seven stage process. The stages in this process are initiation, project, set up, planning, realization, strategic planning.

Process To Setup Business Linkedin Page For Marketing Infographics PDF
This slide covers steps to build a business profile to promote on LinkedIn platform. The purpose of this template is to guide the user to create a business profile as per the need of the business. It starts from selecting work icon on LinkedIn homepage, etc. Find highly impressive Process To Setup Business Linkedin Page For Marketing Infographics PDF on Slidegeeks to deliver a meaningful presentation. You can save an ample amount of time using these presentation templates. No need to worry to prepare everything from scratch because Slidegeeks experts have already done a huge research and work for you. You need to download Process To Setup Business Linkedin Page For Marketing Infographics PDF for your upcoming presentation. All the presentation templates are 100 percent editable and you can change the color and personalize the content accordingly. Download now.

Business Partnership Strategy Scheme Ppt Infographics Demonstration PDF
This slide covers the partners management framework which has classified on assessed criticality, risk and complexity along with business reviews, cross functional reviews and operational meetings. Deliver and pitch your topic in the best possible manner with this business partnership strategy scheme ppt infographics demonstration pdf. Use them to share invaluable insights on recruiting, communication, cooperation, performance management and impress your audience. This template can be altered and modified as per your expectations. So, grab it now.

Business Scheme Management Synopsis Feedbacks Inquire Infographics PDF
This is a business scheme management synopsis feedbacks inquire infographics pdf template with various stages. Focus and dispense information on six stages using this creative set, that comes with editable features. It contains large content boxes to add your information on topics like process, share, outcomes, action, vision. You can also showcase facts, figures, and other relevant content using this PPT layout. Grab it now.

Application Programming Interface Management For Business Services Infographics PDF
Showcasing this set of slides titled application programming interface management for business services infographics pdf. The topics addressed in these templates are management plane, data plan, application. All the content presented in this PPT design is completely editable. Download it and make adjustments in color, background, font etc. as per your unique business setting.

Executing Automotive Marketing Tactics For Sales Boost Venn Infographics PDF
Are you searching for a Executing Automotive Marketing Tactics For Sales Boost Venn Infographics PDF that is uncluttered, straightforward, and original Its easy to edit, and you can change the colors to suit your personal or business branding. For a presentation that expresses how much effort you have put in, this template is ideal With all of its features, including tables, diagrams, statistics, and lists, its perfect for a business plan presentation. Make your ideas more appealing with these professional slides. Download Executing Automotive Marketing Tactics For Sales Boost Venn Infographics PDF from Slidegeeks today.
Drawing Of Down Arrow Ppt PowerPoint Presentation Infographics Maker
This is a drawing of down arrow ppt powerpoint presentation infographics maker. This is a stage process. The stages in this process are hand drawn arrow, hand outlined arrow, hand designed.

Pie Of Pie Ppt Powerpoint Presentation Infographics Layout Ideas
This is a pie of pie ppt powerpoint presentation infographics layout ideas. This is a four stage process. The stages in this process are pie chart, marketing, business, analysis, management.
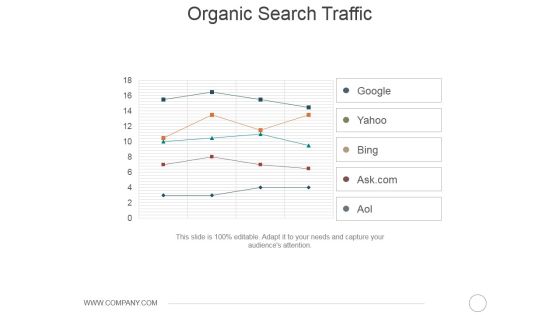
Organic Search Traffic Ppt PowerPoint Presentation Infographics Show
This is a organic search traffic ppt powerpoint presentation infographics show. This is a five stage process. The stages in this process are google, yahoo, bing, ask com, aol.

Stacked Line With Marker Ppt PowerPoint Presentation Infographics Images
This is a stacked line with marker ppt powerpoint presentation infographics images. This is a twelve stage process. The stages in this process are business, marketing, strategy, finance, success.

Clustered Column Line Ppt PowerPoint Presentation Infographics Templates
This is a clustered column line ppt powerpoint presentation infographics templates. This is a three stage process. The stages in this process are in percentage, business, marketing, product, finance, graph.

Bar Graph Ppt PowerPoint Presentation Infographics Graphics Design
This is a bar graph ppt powerpoint presentation infographics graphics design. This is a five stage process. The stages in this process are bar graph, business, years, marketing, management.
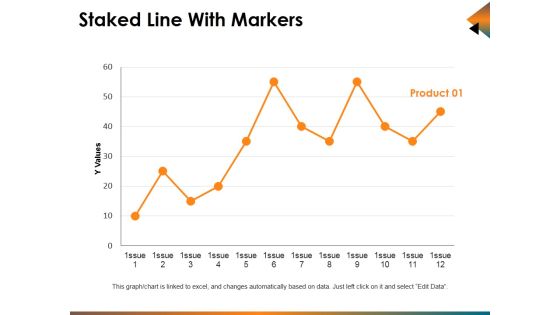
Staked Line With Markers Ppt PowerPoint Presentation Infographics Show
This is a staked line with markers ppt powerpoint presentation infographics show. This is a one stage process. The stages in this process are business, marketing, finance, line, analysis.

Change Management Performance Dashboard Ppt PowerPoint Presentation Infographics Topics
This is a change management performance dashboard ppt powerpoint presentation infographics topics. This is a Three stage process. The stages in this process are emergency changes, change rejected, changes failed, average cost per change, emergency.

Income Statement Graphical Representation Ppt PowerPoint Presentation Infographics Layouts
This is a income statement graphical representation ppt powerpoint presentation infographics layouts. This is a four stage process. The stages in this process are revenue, cogs, operating profit, net profit.
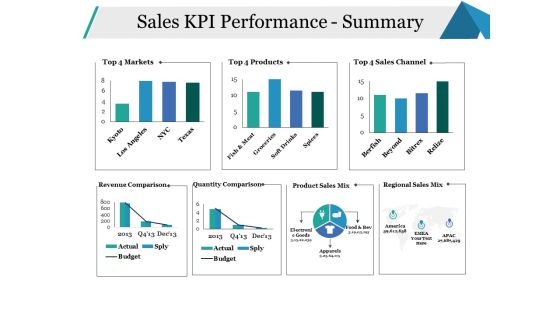
Sales KPI Performance Summary Ppt PowerPoint Presentation Infographics Model
This is a sales kpi performance summary ppt powerpoint presentation infographics model. This is a seven stage process. The stages in this process are sales channel, revenue comparison, quantity comparison, business, marketing.
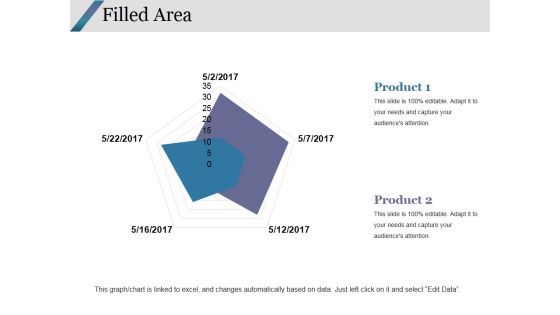
Filled Area Ppt PowerPoint Presentation Infographics Graphics Design
This is a filled area ppt powerpoint presentation infographics graphics design. This is a two stage process. The stages in this process are filled area, finance, marketing, strategy, analysis.

Capex Summary Template 1 Ppt PowerPoint Presentation Infographics Mockup
This is a capex summary template 1 ppt powerpoint presentation infographics mockup. This is a four stage process. The stages in this process are finance, marketing, business, analysis, strategy.

Clustered Column Line Ppt PowerPoint Presentation Infographics Graphics Design
This is a clustered column line ppt powerpoint presentation infographics graphics design. This is a three stage process. The stages in this process are finance, marketing, business, analysis, management.

Clustered Column Line Ppt PowerPoint Presentation Infographics Background Images
This is a clustered column line ppt powerpoint presentation infographics background images. This is a three stage process. The stages in this process are clustered column line, finance, analysis, marketing, business.

Summary Financials Revenue Ebitda Pat Ppt PowerPoint Presentation Infographics Ideas
This is a summary financials revenue ebitda pat ppt powerpoint presentation infographics ideas. This is a three stage process. The stages in this process are business, finance, analysis, marketing, strategy.
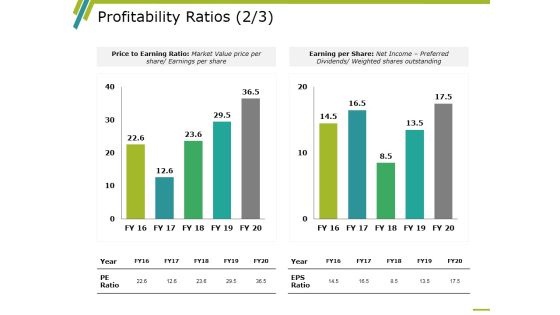
Profitability Ratios Template 4 Ppt PowerPoint Presentation Infographics Rules
This is a profitability ratios template 4 ppt powerpoint presentation infographics rules. This is a two stage process. The stages in this process are business, marketing, graph, price to earning ratio, earning per share.

Competitor Comparison Template 2 Ppt PowerPoint Presentation Infographics Objects
This is a competitor comparison template 2 ppt powerpoint presentation infographics objects. This is a five stage process. The stages in this process are business, marketing, graph, finance, strategy.

Balance Sheet Graphical Representation Ppt PowerPoint Presentation Infographics Layouts
This is a balance sheet graphical representation ppt powerpoint presentation infographics layouts. This is a four stage process. The stages in this process are business, current assets, total assets, total liabilities, current liabilities.

Scatter Line Ppt PowerPoint Presentation Infographics Background Images
This is a scatter line ppt powerpoint presentation infographics background images. This is a one stage process. The stages in this process are dollar in millions, product, sales in percentage.

Big Data Architecture Ppt PowerPoint Presentation Infographics Design Inspiration
This is a big data architecture ppt powerpoint presentation infographics design inspiration. This is a four stage process. The stages in this process are data pipeline, processing, insight, value of data, staging.
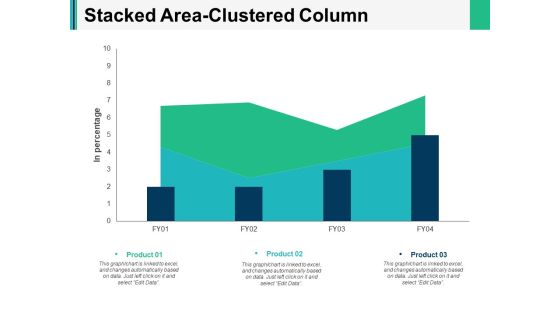
Stacked Area Clustered Column Ppt PowerPoint Presentation Infographics Backgrounds
This is a stacked area clustered column ppt powerpoint presentation infographics backgrounds. This is a three stage process. The stages in this process are finance, marketing, management, investment, analysis.

Clustered Bar Finance Ppt PowerPoint Presentation Infographics Graphics Template
This is a clustered bar finance ppt powerpoint presentation infographics graphics template. This is a three stage process. The stages in this process are clustered bar, finance, business, investment, marketing.

Bar Graph Finance Ppt PowerPoint Presentation Infographics Background Designs
This is a bar graph finance ppt powerpoint presentation infographics background designs. This is a two stage process. The stages in this process are finance, analysis, business, investment, marketing.
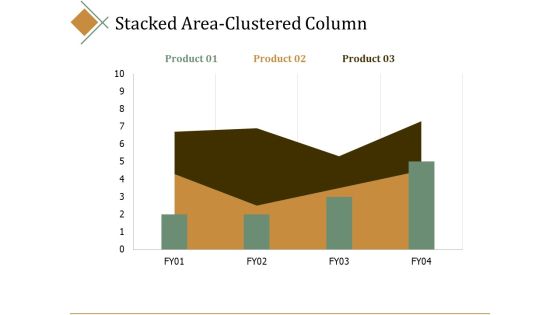
Stacked Area Clustered Column Ppt PowerPoint Presentation Infographics Portrait
This is a stacked area clustered column ppt powerpoint presentation infographics portrait. This is a three stage process. The stages in this process are percentage, product, business, management, marketing.

Marketing Return On Investment Ppt PowerPoint Presentation Infographics Files
This is a marketing return on investment ppt powerpoint presentation infographics files. This is a three stage process. The stages in this process are marketing investment, impressions, return on investment, finance, marketing.

Effective Management Virtual Teams Ppt PowerPoint Presentation Infographics Ideas Cpb
This is a effective management virtual teams ppt powerpoint presentation infographics ideas cpb. This is a six stage process. The stages in this process are effective management virtual teams.

Retail Global Trends Comparing Online Ppt PowerPoint Presentation Infographics Guide
This is a retail global trends comparing online ppt powerpoint presentation infographics guide. This is a two stage process. The stages in this process are finance, analysis, business, investment, marketing.

Cost Performance Index Ppt PowerPoint Presentation Infographics Mockup
This is a cost performance index ppt powerpoint presentation infographics mockup. This is a three stage process. The stages in this process are finance, marketing, management, investment, product, percentage.
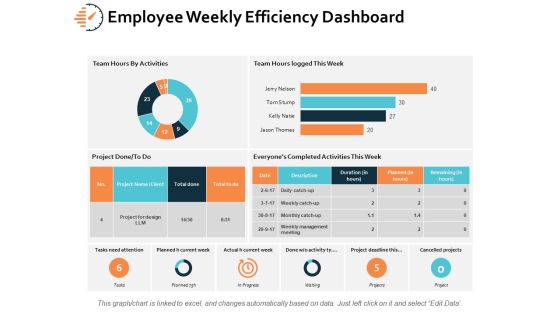
Employee Weekly Efficiency Dashboard Ppt PowerPoint Presentation Infographics Microsoft
This is a employee weekly efficiency dashboard ppt powerpoint presentation infographics microsoft. This is a six stage process. The stages in this process are finance, analysis, business, investment, marketing.
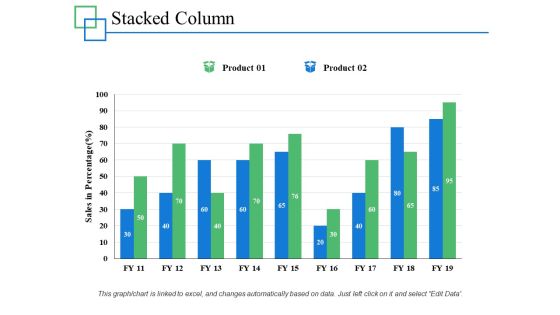
Stacked Column Percentage Product Ppt PowerPoint Presentation Infographics Outfit
This is a stacked column percentage product ppt powerpoint presentation infographics outfit. This is a two stage process. The stages in this process are marketing, business, management, percentage, product.

Brand Promotional Program Analysis Plan Icon Infographics PDF
Presenting Brand Promotional Program Analysis Plan Icon Infographics PDF to dispense important information. This template comprises three stages. It also presents valuable insights into the topics including Brand Promotional Program, Analysis Plan Icon. This is a completely customizable PowerPoint theme that can be put to use immediately. So, download it and address the topic impactfully.

Bulb Or Idea Ppt Powerpoint Presentation Infographics Icon
This is a bulb or idea ppt powerpoint presentation infographics icon. This is a one stage process. The stages in this process are bulb, technology, business, management, strategy, planning.
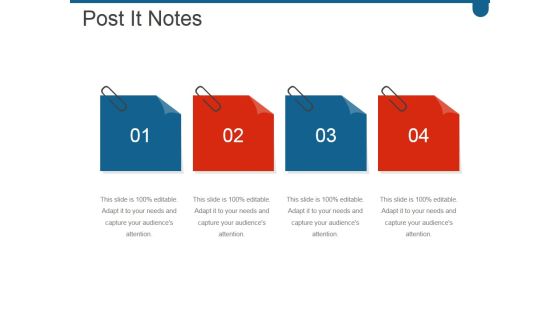
Post It Notes Ppt PowerPoint Presentation Infographics Slideshow
This is a post it notes ppt powerpoint presentation infographics slideshow. This is a four stage process. The stages in this process are business, marketing, strategy, post it, planning.

Community And Volunteer Work Ppt PowerPoint Presentation Infographics Smartart
This is a community and volunteer work ppt powerpoint presentation infographics smartart. This is a five stage process. The stages in this process are business, marketing, process, planning, strategy.

Thanks For Watching Ppt PowerPoint Presentation Infographics Tips
This is a thanks for watching ppt powerpoint presentation infographics tips. This is a one stage process. The stages in this process are thank you, success, marketing, strategy, management, planning.
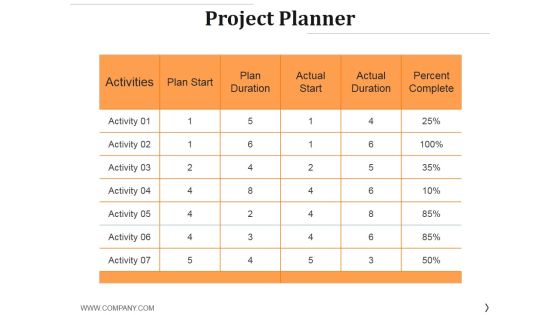
Project Planner Template 2 Ppt PowerPoint Presentation Infographics Layout
This is a project planner template 2 ppt powerpoint presentation infographics layout. This is a seven stage process. The stages in this process are activities, activity, plan duration, actual duration.

Contract Agreement Template 1 Ppt PowerPoint Presentation Infographics Tips
This is a contract agreement template 1 ppt powerpoint presentation infographics tips. This is a one stage process. The stages in this process are success, management, planning, marketing, business, strategy.

Thank You Ppt PowerPoint Presentation Infographics Example Topics
This is a thank you ppt powerpoint presentation infographics example topics. This is a one stage process. The stages in this process are thank you, planning, business, management, strategy.
Elevator Pitch Template 3 Ppt PowerPoint Presentation Infographics Elements
This is a elevator pitch template 3 ppt powerpoint presentation infographics elements. This is a one stage process. The stages in this process are magnifying glass, business, marketing, management, planning.
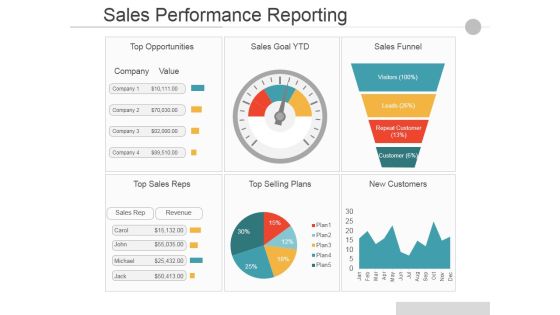
Sales Performance Reporting Ppt PowerPoint Presentation Infographics Portrait
This is a Sales Performance Reporting Ppt PowerPoint Presentation Infographics Portrait. This is a six stage process. The stages in this process are Top Opportunities, Sales Goal Ytd, Sales Funnel, Top Sales Reps, Top Selling Plans, New Customers.

Classification Of Solar System Ppt PowerPoint Presentation Infographics Images
This is a classification of solar system ppt powerpoint presentation infographics images. This is a one stage process. The stages in this process are green energy, management, planning, strategy, marketing.
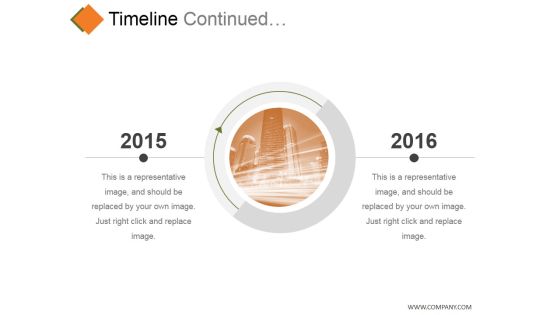
Timeline Continued Template 2 Ppt PowerPoint Presentation Infographics Objects
This is a timeline continued template 2 ppt powerpoint presentation infographics objects. This is a two stage process. The stages in this process are year, growth, success, time planning, business.

Current Staff Composition Ppt PowerPoint Presentation Infographics Design Inspiration
This is a current staff composition ppt powerpoint presentation infographics design inspiration. This is a five stage process. The stages in this process are staff composition, business, circle, process, planning.

Career Template 1 Ppt PowerPoint Presentation Infographics Tips
This is a career template 1 ppt powerpoint presentation infographics tips. This is a six stage process. The stages in this process are year, growth, success, time planning, business.
 Home
Home