Agenda Infographic
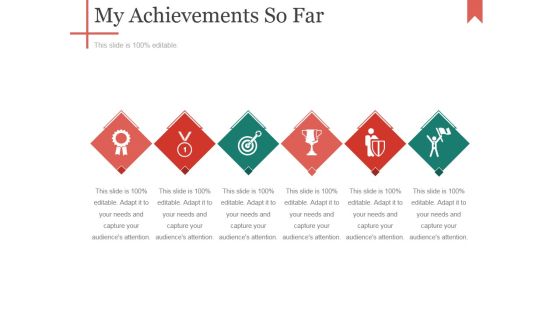
My Achievements So Far Ppt PowerPoint Presentation Infographics Display
This is a my achievements so far ppt powerpoint presentation infographics display. This is a six stage process. The stages in this process are process, business, marketing, icons, management.
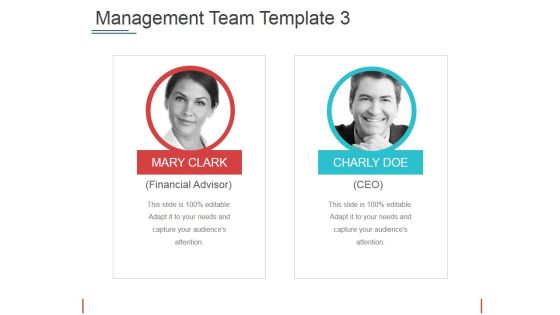
Management Team Template 3 Ppt PowerPoint Presentation Infographics Graphic Tips
This is a management team template 3 ppt powerpoint presentation infographics graphic tips. This is a two stage process. The stages in this process are mary clark, charly doe, ceo, financial advisor.
Use Of Funds Ppt PowerPoint Presentation Infographics Icons
This is a use of funds ppt powerpoint presentation infographics icons. This is a four stage process. The stages in this process are new hires, operational cost, marketing, product development.
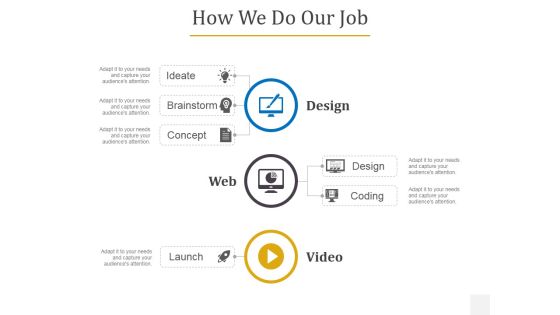
How We Do Our Job Ppt PowerPoint Presentation Infographics Graphics
This is a how we do our job ppt powerpoint presentation infographics graphics. This is a three stage process. The stages in this process are ideate, brainstorm, concept, design, coding, launch.

Exclusive Package For You Ppt PowerPoint Presentation Infographics Background Image
This is a exclusive package for you ppt powerpoint presentation infographics background image. This is a three stage process. The stages in this process are product, business, marketing, sales, icons.
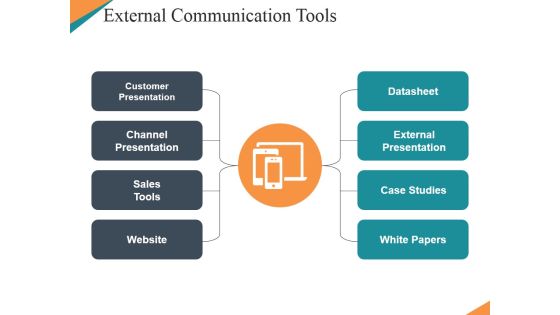
External Communication Tools Ppt PowerPoint Presentation Infographics Summary
This is a external communication tools ppt powerpoint presentation infographics summary. This is a eight stage process. The stages in this process are customer presentation, channel presentation, sales tools, website, datasheet.

Phases Of Implementation Ppt PowerPoint Presentation Infographics Graphics Example
This is a phases of implementation ppt powerpoint presentation infographics graphics example. This is a five stage process. The stages in this process are icon, shapes, business, marketing, strategy.

Methods Or Approach Limitations Ppt PowerPoint Presentation Infographics Guidelines
This is a methods or approach limitations ppt powerpoint presentation infographics guidelines. This is a four stage process. The stages in this process are limitation, business, marketing, management, arrows.
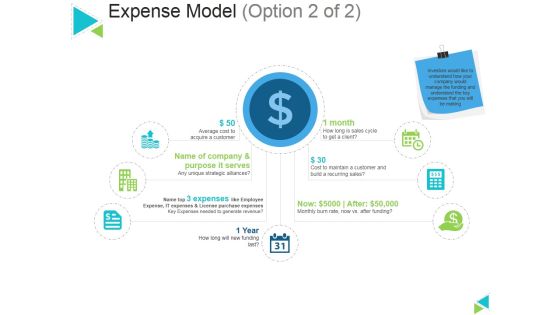
Expense Model Template 2 Ppt PowerPoint Presentation Infographics Graphic Tips
This is a expense model template 2 ppt powerpoint presentation infographics graphic tips. This is a seven stage process. The stages in this process are expense model, month, business, marketing, success.

Revenue Streams Ppt PowerPoint Presentation Infographics Example Topics
This is a revenue streams ppt powerpoint presentation infographics example topics. This is a four stage process. The stages in this process are partner commission, selling in house products, indirect sources such as advertising, affiliates etc, supplier commission, revenue streams.

competition comparison table ppt powerpoint presentation infographics design inspiration
This is a competition comparison table ppt powerpoint presentation infographics design inspiration. This is a seven stage process. The stages in this process are revenue, profit, market share, main activity, number of employee.

Big Data Technologies Ppt PowerPoint Presentation Infographics Example Introduction
This is a big data technologies ppt powerpoint presentation infographics example introduction. This is a nine stage process. The stages in this process are time series, signal processing, natural language processing, machine learning, genetic algorithm.
Our Mission Template 1 Ppt PowerPoint Presentation Infographics Designs
This is a our mission template 1 ppt powerpoint presentation infographics designs. This is a one stage process. The stages in this process are growth, strategy, business, our mission.

Communication Goals Template 2 Ppt PowerPoint Presentation Infographics File Formats
This is a communication goals template 2 ppt powerpoint presentation infographics file formats. This is a one stage process. The stages in this process are communication, goals, social, business, marketing.
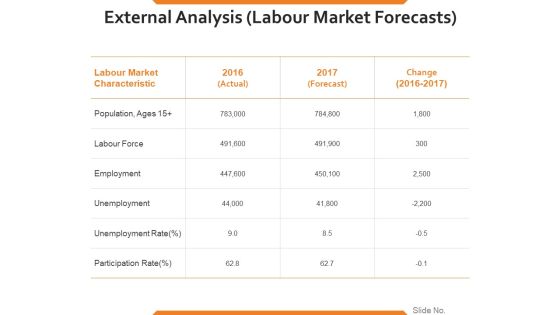
External Analysis Labour Market Forecasts Ppt PowerPoint Presentation Infographics Outfit
This is a external analysis labour market forecasts ppt powerpoint presentation infographics outfit. This is a three stage process. The stages in this process are labour force, employment, unemployment, unemployment rate, participation rate.

About Me Template 2 Ppt PowerPoint Presentation Infographics Mockup

Pipeline Quality Template Ppt PowerPoint Presentation Infographics Slideshow
This is a pipeline quality template ppt powerpoint presentation infographics slideshow. This is a four stage process. The stages in this process are qualify sales development, pass to sales, scrap, nurture marketing.

Business And Financial Analysis Ppt PowerPoint Presentation Infographics Slide Portrait
This is a business and financial analysis ppt powerpoint presentation infographics slide portrait. This is a three stage process. The stages in this process are investment, land cost, equipment, employee cost, marketing cost, other cost.

Repositioning A Product Ppt PowerPoint Presentation Infographics Sample
This is a repositioning a product ppt powerpoint presentation infographics sample. This is a one stage process. The stages in this process are among existing customers, to new consumers.

Product Feasibility And Review Ppt PowerPoint Presentation Infographics Design Inspiration
This is a product feasibility and review ppt powerpoint presentation infographics design inspiration. This is a five stage process. The stages in this process are feasibility review, evaluating scores, alpha and beta testing timelines, product quality check, launch monitoring dashboard.

Establish Brand Positioning Ppt PowerPoint Presentation Infographics Themes
This is a establish brand positioning ppt powerpoint presentation infographics themes. This is a three stage process. The stages in this process are target customers, company and product, key benefits, price, value proposition.
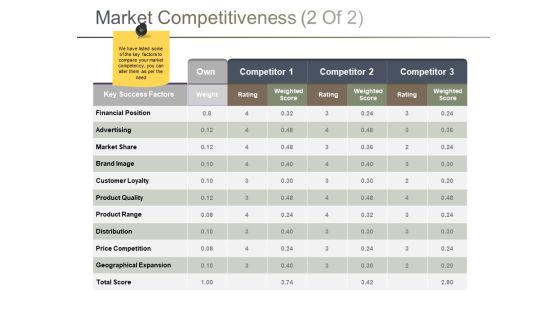
Market Competitiveness Template 2 Ppt PowerPoint Presentation Infographics Influencers
This is a market competitiveness template 2 ppt powerpoint presentation infographics influencers. This is a three stage process. The stages in this process are financial position, advertising, market share, brand image, customer loyalty.
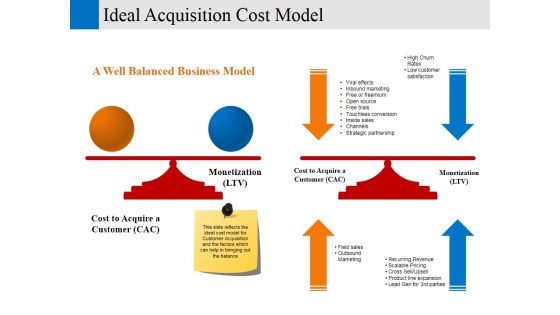
Ideal Acquisition Cost Model Ppt PowerPoint Presentation Infographics Example File
This is a ideal acquisition cost model ppt powerpoint presentation infographics example file. This is a two stage process. The stages in this process are cost to acquire a customer, monetization, business, marketing.

About Us Ppt PowerPoint Presentation Infographics Background Image
This is a about us ppt powerpoint presentation infographics background image. This is a one stage process. The stages in this process are about us, business, marketing, strategy, management.

Project Team Structure Template 2 Ppt PowerPoint Presentation Infographics Ideas
This is a project team structure template 2 ppt powerpoint presentation infographics ideas. This is a three stage process. The stages in this process are president, project manage, team member.

Balance Sheet Kpis Tabular Formcont Ppt PowerPoint Presentation Infographics Visuals
This is a balance sheet kpis tabular formcont ppt powerpoint presentation infographics visuals. This is a four stage process. The stages in this process are noncurrent, investments, long term loans and advances, current investments, inventories.
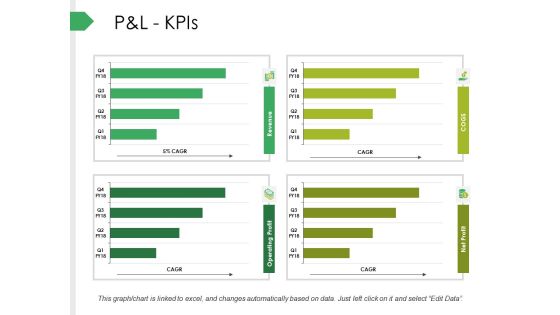
P And L Kpis Ppt PowerPoint Presentation Infographics Background
This is a p and l kpis ppt powerpoint presentation infographics background. This is a four stage process. The stages in this process are net sales, expenses, ebitda, profit before tax, profit after tax.
Top Customers And Vendors Ppt PowerPoint Presentation Infographics Icon
This is a top customers and vendors ppt powerpoint presentation infographics icon. This is a three stage process. The stages in this process are business, customers, amount, vendors, marketing.

Demand Creation System Ppt PowerPoint Presentation Infographics Background Designs
This is a demand creation system ppt powerpoint presentation infographics background designs. This is a three stage process. The stages in this process are value innovation, value enhancement, opportunity and threat discovery, customer demand model.

Demand Generation From Sales Perspective Ppt PowerPoint Presentation Infographics Skills
This is a demand generation from sales perspective ppt powerpoint presentation infographics skills. This is a four stage process. The stages in this process are lead, appointment, opportunity, customer.

Fishbone Diagram Cause Effect Relationship Ppt PowerPoint Presentation Infographics Slideshow
This is a fishbone diagram cause effect relationship ppt powerpoint presentation infographics slideshow. This is a six stage process. The stages in this process are description, cause, problem quality feature.

Customer Success Cycle Ppt PowerPoint Presentation Infographics Background
This is a customer success cycle ppt powerpoint presentation infographics background. This is a six stage process. The stages in this process are technology, process, people, customer journey, mission.
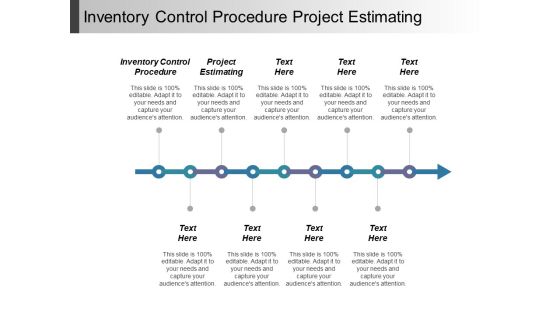
Inventory Control Procedure Project Estimating Ppt PowerPoint Presentation Infographics Picture
This is a inventory control procedure project estimating ppt powerpoint presentation infographics picture. This is a nine stage process. The stages in this process are inventory, control, procedure, project, estimating.
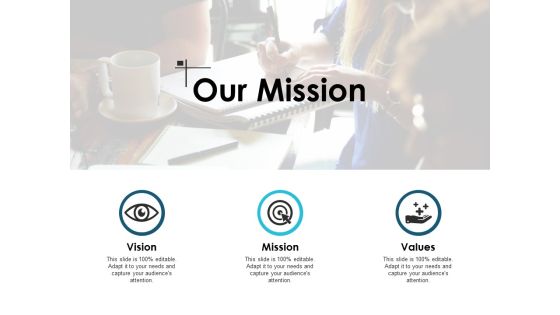
Our Mission Goal Ppt PowerPoint Presentation Infographics Designs Download
This is a our mission goal ppt powerpoint presentation infographics designs download. This is a three stage process. The stages in this process are our mission, vision, goal, marketing, strategy.
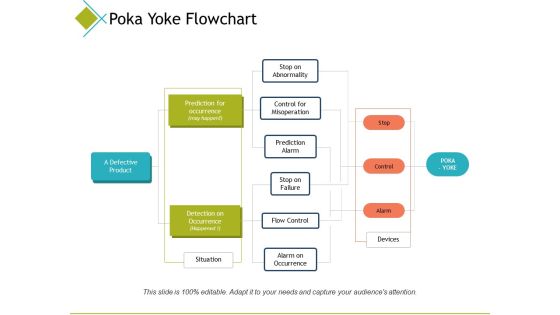
Poka Yoke Flowchart Prediction Alarm Ppt PowerPoint Presentation Infographics Gridlines
This is a poka yoke flowchart prediction alarm ppt powerpoint presentation infographics gridlines. This is a five stage process. The stages in this process are stop on failure, prediction alarm, situation, flow control, devices.

Bank Correspondence Program Process With Forex Transactions Infographics PDF
Showcasing this set of slides titled Bank Correspondence Program Process With Forex Transactions Infographics PDF. The topics addressed in these templates are Payment, Supplier, Supplier. All the content presented in this PPT design is completely editable. Download it and make adjustments in color, background, font etc. as per your unique business setting.
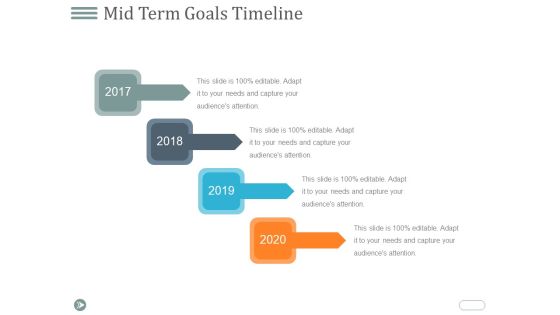
Mid Term Goals Timeline Ppt PowerPoint Presentation Infographics Demonstration
This is a mid term goals timeline ppt powerpoint presentation infographics demonstration. This is a four stage process. The stages in this process are timeline, year, management, business, planning.
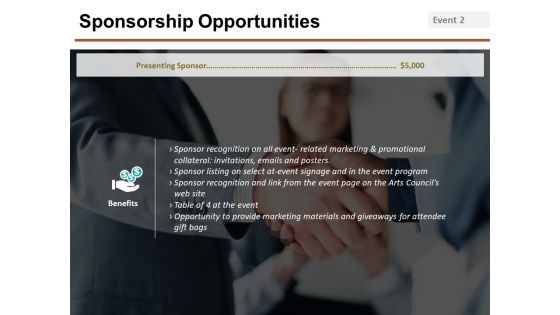
Sponsorship Opportunities Template 5 Ppt PowerPoint Presentation Infographics Portfolio
This is a sponsorship opportunities template 5 ppt powerpoint presentation infographics portfolio. This is a one stage process. The stages in this process are benefits, marketing, icons, business, planning.

Recruitment Sector Capital Raising Elevator Table Of Contents Infographics PDF
Deliver an awe inspiring pitch with this creative recruitment sector capital raising elevator table of contents infographics pdf bundle. Topics like problems of insufficient, performing in the market, stories and testimonial can be discussed with this completely editable template. It is available for immediate download depending on the needs and requirements of the user.
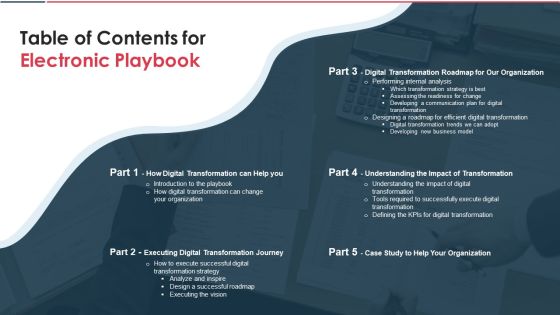
Table Of Contents For Electronic Playbook Infographics PDF
Deliver an awe inspiring pitch with this creative table of contents for electronic playbook infographics pdf bundle. Topics like digital transformation, executing digital transformation, digital transformation roadmap can be discussed with this completely editable template. It is available for immediate download depending on the needs and requirements of the user.

Table Of Contents For Managing Commercial Property Risks Infographics PDF
Deliver an awe inspiring pitch with this creative Table Of Contents For Managing Commercial Property Risks Infographics PDF bundle. Topics like Estate Company, Management Process, Stakeholders Organization can be discussed with this completely editable template. It is available for immediate download depending on the needs and requirements of the user.
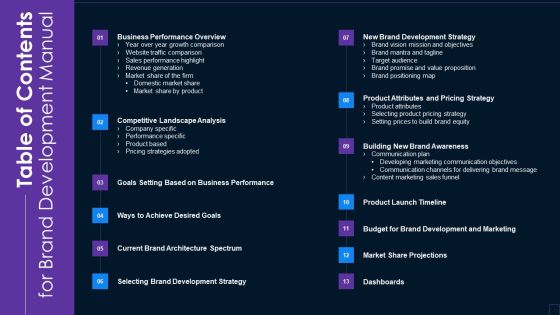
Table Of Contents For Brand Development Manual Infographics PDF
Deliver and pitch your topic in the best possible manner with this Table Of Contents For Brand Development Manual Infographics PDF Use them to share invaluable insights on Business Performance Overview, Competitive Landscape Analysis, Product Launch Timeline and impress your audience. This template can be altered and modified as per your expectations. So, grab it now.

Table Of Contents Digital Medical Services Pitch Deck Infographics PDF
Deliver and pitch your topic in the best possible manner with this Table Of Contents Digital Medical Services Pitch Deck Infographics PDF. Use them to share invaluable insights on Customer Segments, Problems Identified, Management Mobile and impress your audience. This template can be altered and modified as per your expectations. So, grab it now.

Small Business Venture Company Profile Table Of Contents Infographics PDF
Deliver and pitch your topic in the best possible manner with this Small Business Venture Company Profile Table Of Contents Infographics PDF. Use them to share invaluable insights on Executive Summary, Company Introduction, Financial Comparison and impress your audience. This template can be altered and modified as per your expectations. So, grab it now.

Customer Service Benchmarking Template 1 Ppt PowerPoint Presentation Infographics Themes
This is a customer service benchmarking template 1 ppt powerpoint presentation infographics themes. This is a five stage process. The stages in this process are business, process, marketing, management, customer service benchmarking.

Profitability Ratios Template 2 Ppt PowerPoint Presentation Infographics Layouts
This is a profitability ratios template 2 ppt powerpoint presentation infographics layouts. This is a two stage process. The stages in this process are price to earning ratio, earning per share, market value price per share.

Competitive Analysis Ppt PowerPoint Presentation Infographics Format Ideas
This is a competitive analysis ppt powerpoint presentation infographics format ideas. This is a four stage process. The stages in this process are own business, competitor, price, quality, additional functions.
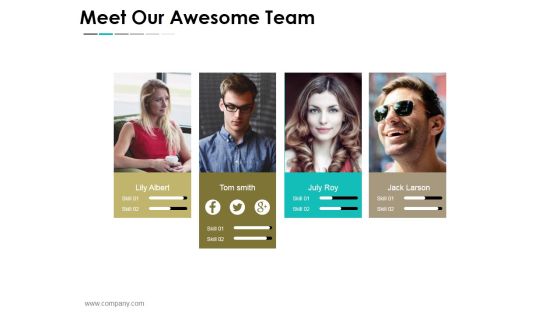
Meet Our Awesome Team Ppt PowerPoint Presentation Infographics Layout
This is a meet our awesome team ppt powerpoint presentation infographics layout. This is a four stage process. The stages in this process are lily albert, tom smith, july roy, jack larson.
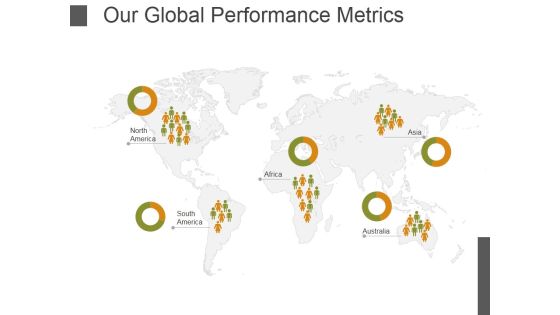
Our Global Performance Metrics Ppt PowerPoint Presentation Infographics Format
This is a our global performance metrics ppt powerpoint presentation infographics format. This is a five stage process. The stages in this process are north, south, africa, australia, america.

Mind Map Ppt PowerPoint Presentation Infographics Design Inspiration
This is a mind map ppt powerpoint presentation infographics design inspiration. This is a four stage process. The stages in this process are mind map, process, ideas, business, marketing.

Departments And Teams Ppt PowerPoint Presentation Infographics Gridlines
This is a departments and teams ppt powerpoint presentation infographics gridlines. This is a three stage process. The stages in this process are ceo, product manager, product manager, marketing, graphic designer, web designer.
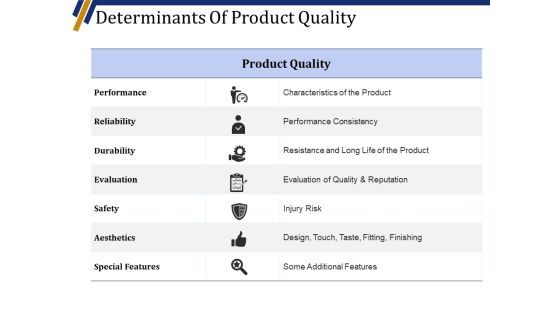
Determinants Of Product Quality Ppt PowerPoint Presentation Infographics Design Templates
This is a determinants of product quality ppt powerpoint presentation infographics design templates. This is a seven stage process. The stages in this process are performance, reliability, durability, evaluation, safety.

HR Manager Virtual Orientation Program For Remote Employees Infographics PDF
This slide covers virtual orientation schedule for remote employees during pandemic. It includes bootcamp sessions, management interactions, breakout sessions, skills training, Showcasing this set of slides titled HR Manager Virtual Orientation Program For Remote Employees Infographics PDF The topics addressed in these templates are Employee Introduction, Management Introduction, Breakout Sessions All the content presented in this PPT design is completely editable. Download it and make adjustments in color, background, font etc. as per your unique business setting.

Portfolio Management Securities Allocation Dashboard Ppt PowerPoint Presentation Infographics Examples
This is a portfolio management securities allocation dashboard ppt powerpoint presentation infographics examples. The topics discussed in this diagram are finance, marketing, management, investment, analysis. This is a completely editable PowerPoint presentation, and is available for immediate download.
Tasks Planning Calendar Icon For Year 2023 Infographics PDF
Persuade your audience using this Tasks Planning Calendar Icon For Year 2023 Infographics PDF. This PPT design covers four stages, thus making it a great tool to use. It also caters to a variety of topics including Tasks Planning, Calendar, Icon For Year. Download this PPT design now to present a convincing pitch that not only emphasizes the topic but also showcases your presentation skills.
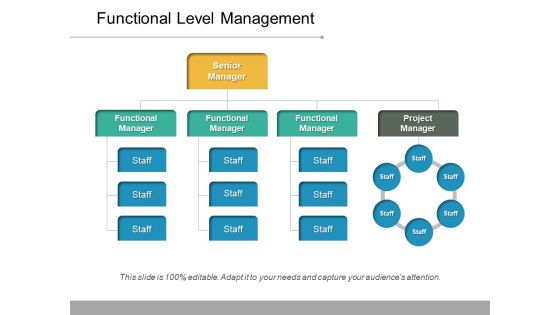
Functional Level Management Ppt PowerPoint Presentation Infographics Images
This is a functional level management ppt powerpoint presentation infographics images. This is a three stage process. The stages in this process are organization chart, org chart, project team structure.

Breakdown Of Behavioral Segmentation Ppt PowerPoint Presentation Infographics Slide Portrait
This is a breakdown of behavioral segmentation ppt powerpoint presentation infographics slide portrait. This is a five stage process. The stages in this process are target market, aware, unaware, not tried, tried, negative opinion.

Our Services Template 3 Ppt PowerPoint Presentation Infographics Inspiration
This is a our services template 3 ppt powerpoint presentation infographics inspiration. This is a four stage process. The stages in this process are icon, business, management, strategy, person.
Software Product Development Process Ppt PowerPoint Presentation Infographics Pictures Cpb
This is a software product development process ppt powerpoint presentation infographics pictures cpb. This is a two stage process. The stages in this process are software product development process.

Total Quality Management Business Ppt PowerPoint Presentation Infographics Diagrams Cpb
This is a total quality management business ppt powerpoint presentation infographics diagrams cpb. This is a three stage process. The stages in this process are total quality management business.
 Home
Home