2 Sections

Data Transfer From Primary To Secondary Devices Ppt PowerPoint Presentation Portfolio Display PDF
Persuade your audience using this data transfer from primary to secondary devices ppt powerpoint presentation portfolio display pdf. This PPT design covers two stages, thus making it a great tool to use. It also caters to a variety of topics including primary disk, secondary disk, master volume, remote mirror, bitmap volume, updated data blocks are consistently duplicated to secondary, differences between the master volume on the essential plate and the master volume on the secondary disk are followed on the remote mirror bitmap volume. Download this PPT design now to present a convincing pitch that not only emphasizes the topic but also showcases your presentation skills.

Client Experience Management Structure And Implementation Process Sample PDF
This slide contains the customer experience management framework with the implementation process in order to develop its CX capabilities by building an environment capable of operating with a customer focus. It also includes building blocks for the customer experience. Persuade your audience using this Client Experience Management Structure And Implementation Process Sample PDF. This PPT design covers Two stages, thus making it a great tool to use. It also caters to a variety of topics including Customer Experience Understanding, Customer Experience Design. Download this PPT design now to present a convincing pitch that not only emphasizes the topic but also showcases your presentation skills.

Automated Supplier Relationship Management Tracking Vendor Shipments Through Topics PDF
This slide showcases workflow which can help businesses in eliminating uncertainties of manual methods and ensure real-time visibility in vendor management. It provides details about bar-code scanning, web entry, corporate office, branches, etc. There are so many reasons you need a Automated Supplier Relationship Management Tracking Vendor Shipments Through Topics PDF. The first reason is you can not spend time making everything from scratch, Thus, Slidegeeks has made presentation templates for you too. You can easily download these templates from our website easily.
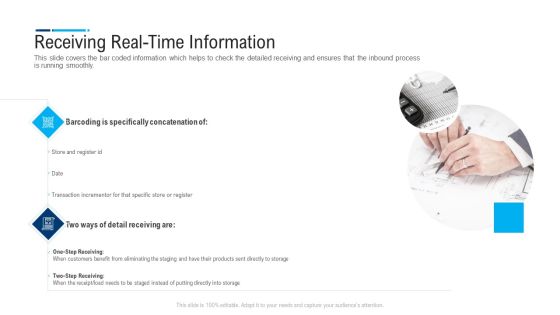
Internal And External Logistics Management Procedure Receiving Real Time Information Background PDF
This slide covers the bar coded information which helps to check the detailed receiving and ensures that the inbound process is running smoothly. Presenting internal and external logistics management procedure receiving real time information background pdf to provide visual cues and insights. Share and navigate important information on two stages that need your due attention. This template can be used to pitch topics like barcoding is specifically concatenation, two ways of detail receiving. In addtion, this PPT design contains high resolution images, graphics, etc, that are easily editable and available for immediate download.

Business Transformation Engagement Plan Dashboard Ppt Outline Format PDF
The slide shows dashboard of change management communication plan. The dashboard includes number of communications with priority level, communication type and communication bar graph. Persuade your audience using this Business Transformation Engagement Plan Dashboard Ppt Outline Format PDF. This PPT design covers two stages, thus making it a great tool to use. It also caters to a variety of topics including Communications, Awareness Communication, Priority Level. Download this PPT design now to present a convincing pitch that not only emphasizes the topic but also showcases your presentation skills.

Techniques To Make Real Estate Website Mobile Responsive Topics PDF
The following slide outlines multiple practices that can assist real estate firms in increasing page speed and visitor retention rate. The techniques mentioned in slide are scaling property images, blocking popup notifications, make call-to-action CTA button visible, etc. Slidegeeks is here to make your presentations a breeze with Techniques To Make Real Estate Website Mobile Responsive Topics PDF With our easy-to-use and customizable templates, you can focus on delivering your ideas rather than worrying about formatting. With a variety of designs to choose from, you are sure to find one that suits your needs. And with animations and unique photos, illustrations, and fonts, you can make your presentation pop. So whether you are giving a sales pitch or presenting to the board, make sure to check out Slidegeeks first

Introduction To Mobile SEM Approaches To Make Mobile Website Responsive Information PDF
The purpose of this slide is to outline various approaches which will assist the marketer to optimize website design. It provides information about scaling the images for mobile users, blocking popup notifications etc. Create an editable Introduction To Mobile SEM Approaches To Make Mobile Website Responsive Information PDF that communicates your idea and engages your audience. Whether you are presenting a business or an educational presentation, pre designed presentation templates help save time. Introduction To Mobile SEM Approaches To Make Mobile Website Responsive Information PDF is highly customizable and very easy to edit, covering many different styles from creative to business presentations. Slidegeeks has creative team members who have crafted amazing templates. So, go and get them without any delay.
Social Media Marketing Budget Publish Content Ppt Icon Introduction PDF
Presenting this set of slides with name social media marketing budget publish content ppt icon introduction pdf. This is a two stage process. The stages in this process are publish all the content, convert your data to all possible content pieces without creating duplicate content. This is a completely editable PowerPoint presentation and is available for immediate download. Download now and impress your audience.

Deploying AI To Enhance Predictive Maintenance Equipment Condition Summary PDF
This slide represents the predictive maintenance and equipment condition monitoring with the internet of things, including its working and impact on the industry. In this method, a sensor is mounted on the piece of equipment to gather information about its health and performance. This Deploying AI To Enhance Predictive Maintenance Equipment Condition Summary PDF is perfect for any presentation, be it in front of clients or colleagues. It is a versatile and stylish solution for organizing your meetings. The Deploying AI To Enhance Predictive Maintenance Equipment Condition Summary PDF features a modern design for your presentation meetings. The adjustable and customizable slides provide unlimited possibilities for acing up your presentation. Slidegeeks has done all the homework before launching the product for you. So, dont wait, grab the presentation templates today
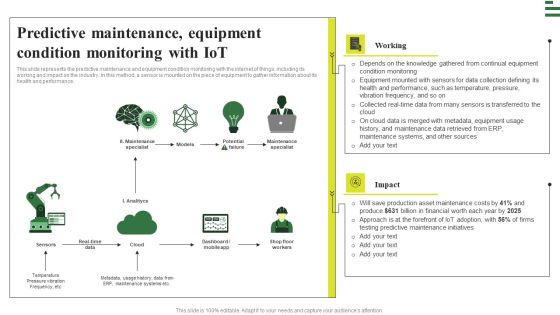
Transforming Manufacturing With Automation Predictive Maintenance Equipment Pictures PDF
This slide represents the predictive maintenance and equipment condition monitoring with the internet of things, including its working and impact on the industry. In this method, a sensor is mounted on the piece of equipment to gather information about its health and performance. Slidegeeks has constructed Transforming Manufacturing With Automation Predictive Maintenance Equipment Pictures PDF after conducting extensive research and examination. These presentation templates are constantly being generated and modified based on user preferences and critiques from editors. Here, you will find the most attractive templates for a range of purposes while taking into account ratings and remarks from users regarding the content. This is an excellent jumping off point to explore our content and will give new users an insight into our top notch PowerPoint Templates.
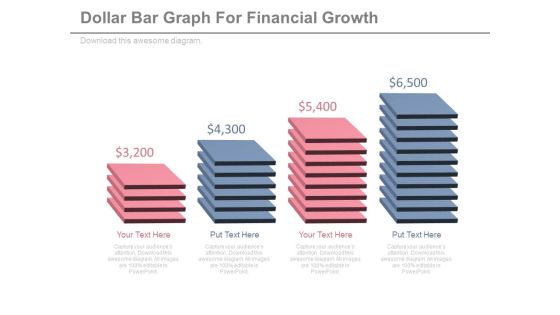
Illustration Of Dollar Value Slabs Powerpoint Slides
Pricing slabs have been displayed in this business slide. This PowerPoint template helps to exhibit financial growth process. Use this diagram slide to build an exclusive presentation.

Clustered Bar Ppt PowerPoint Presentation Summary Ideas
This is a clustered bar ppt powerpoint presentation summary ideas. This is a eight stage process. The stages in this process are clustered bar, finance, marketing, business, strategy.

Bar Graph Ppt PowerPoint Presentation Ideas Show
This is a bar graph ppt powerpoint presentation ideas show. This is a three stage process. The stages in this process are product, percentage, business, year, graph.

Bar Graph Ppt PowerPoint Presentation Infographics Clipart
This is a bar graph ppt powerpoint presentation infographics clipart. This is a three stage process. The stages in this process are product, graph, finance, business, marketing.

Bar Graph For Statistical Analysis Powerpoint Slides
This PowerPoint template has been designed with bar chart and percentage values. You may download this PPT slide to depict statistical analysis. Add this slide to your presentation and impress your superiors.

Bar Graph With Five Icons Powerpoint Slides
This PowerPoint slide contains diagram bar graph with icons. This PPT slide helps to exhibit concepts of financial deal and planning. Use this business slide to make impressive presentations.

Bar Chart Ppt PowerPoint Presentation Icon Demonstration
This is a bar chart ppt powerpoint presentation icon demonstration. This is a seven stage process. The stages in this process are product, sales in percentage, financial year, graph.

Five Steps Bar Graph For Financial Management Powerpoint Slides
This PowerPoint template has been designed with five steps bar graph and icons. This diagram is useful to exhibit financial management. This diagram slide can be used to make impressive presentations.
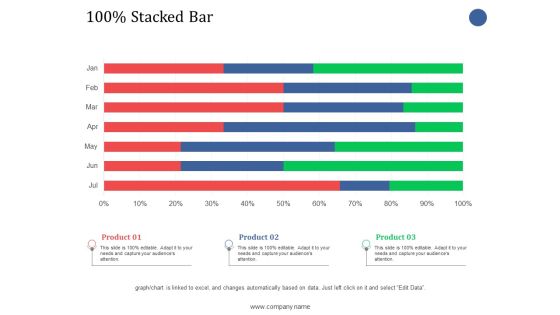
Stacked Bar Ppt PowerPoint Presentation Infographic Template Graphics
This is a stacked bar ppt powerpoint presentation infographic template graphics. This is a three stage process. The stages in this process are stacked bar, finance, product, business.

Bar Graph For Marketing Research Data Powerpoint Slides
This PowerPoint template has been designed with diagram of bar graph. This PPT slide can be used to prepare presentations for profit growth report and also for financial data analysis. You can download finance PowerPoint template to prepare awesome presentations.

Bar Graph For Marketing Research Process Powerpoint Slides
This PowerPoint template has been designed with diagram of bar graph. This PPT slide can be used to prepare presentations for profit growth report and also for financial data analysis. You can download finance PowerPoint template to prepare awesome presentations.

Bar Graph For Year Based Analysis Powerpoint Slides
This PowerPoint template has been designed with year based bar graph. This diagram may be used to display yearly statistical analysis. Use this PPT slide design to make impressive presentations.
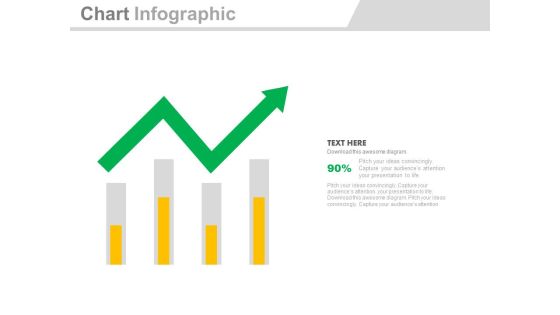
Four Bars With Green Growth Arrow Powerpoint Slides
Four bars with green arrow have been displayed in this business slide. This business diagram helps to exhibit process of business planning. Use this diagram to build an exclusive presentation.

Bar Graph For Profit Growth Analysis Powerpoint Slides
This PowerPoint template has been designed with bar graph with percentage values. This diagram is useful to exhibit profit growth analysis. This diagram slide can be used to make impressive presentations.

Bar Graph For Yearly Statistical Analysis Powerpoint Slides
This PowerPoint template has been designed with bar graph. This PowerPoint diagram is useful to exhibit yearly statistical analysis. This diagram slide can be used to make impressive presentations.
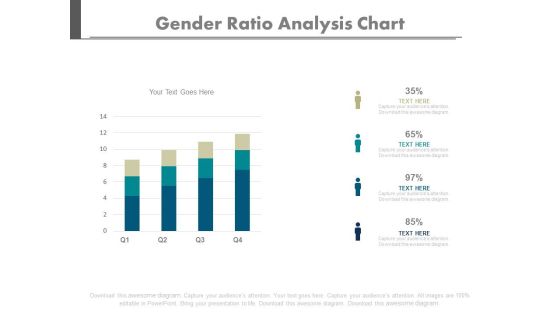
Four Bars Gender Population Ratio Chart Powerpoint Slides
Create dynamic presentations with our creative template of bar graph. This diagram may be used to present gender population. Download this template to leave permanent impression on your audience.
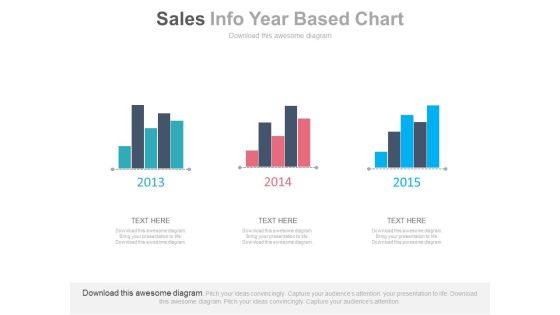
Three Years Sales Data Bar Graph Powerpoint Slides
This PowerPoint template has been designed with bar charts. This business slide may be used to display three years sales data for comparison. Present your views and ideas with this impressive design.

Bar Graph For Data Distribution And Analysis Powerpoint Slides
This PowerPoint template has been designed with bar graph. This PowerPoint diagram is useful for data distribution and analysis This diagram slide can be used to make impressive presentations.

Bar Graph With Increasing Percentage Flow Powerpoint Slides
This PowerPoint slide has been designed with bar graph and increasing percentage values. This diagram slide may be used to display profit growth. Prove the viability of your ideas with this professional slide.

Board With Bar Graph For Financial Analysis Powerpoint Slides
You can download this PowerPoint template to display statistical data and analysis. This PPT slide contains display board with bar graph. Draw an innovative business idea using this professional diagram.
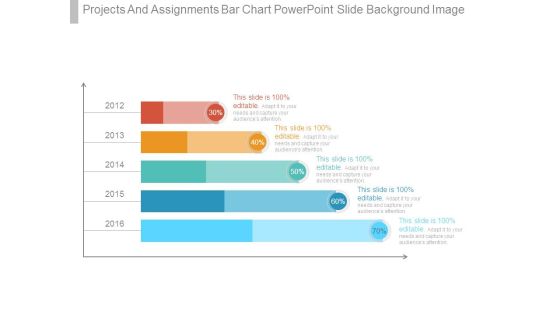
Projects And Assignments Bar Chart Powerpoint Slide Background Image
This is a projects and assignments bar chart powerpoint slide background image. This is a five stage process. The stages in this process are finance, presentation, business, strategy, marketing.

Product Comparison Data Bar Graph Ppt Powerpoint Presentation Slides Show
This is a product comparison data bar graph ppt powerpoint presentation slides show. This is a four stage process. The stages in this process are data presentation, content presentation, information presentation.
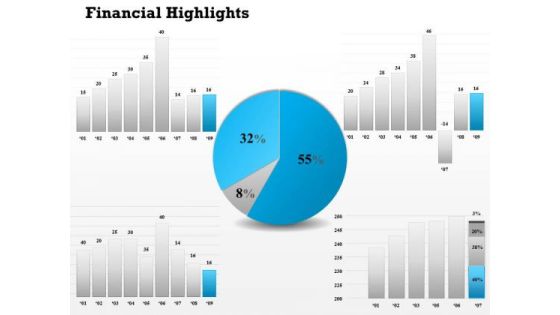
Consulting Diagram Financial Pie And Bar Graph Diagram Business Cycle Diagram
Doll Up Your Thoughts With Our Consulting Diagram Financial Pie And Bar Graph Diagram Business Cycle Diagram Powerpoint Templates. They Will Make A Pretty Picture. They Say A Dog Is Man's Best Friend. Our Consulting Diagram Financial Pie And Bar Graph Diagram Business Cycle Diagram Powerpoint Templates Come A Close Second.

Sales Diagram Financial Result Display Bar Graph Diagram Business Framework Model
Our Sales Diagram Financial Result Display Bar Graph Diagram Business Framework Model Powerpoint Templates Deliver At Your Doorstep. Let Them In For A Wonderful Experience. Dig Out The Dope With Our Sales Diagram Financial Result Display Bar Graph Diagram Business Framework Model Powerpoint Templates. Your Thoughts Will Expose The Truth.

Strategic Management Bar Graph For Business And Financial Growth Business Diagram
Connect The Dots With Our Strategic Management Bar Graph For Business And Financial Growth Business Diagram Powerpoint Templates. Watch The Whole Picture Clearly Emerge. Dot Your Thoughts With Our Strategic Management Bar Graph For Business And Financial Growth Business Diagram Powerpoint Templates. Give Your Demeanor That Propel Look.

3D Bar Chart For Percentage Values Comparison Ppt PowerPoint Presentation Professional Visual Aids
This is a 3d bar chart for percentage values comparison ppt powerpoint presentation professional visual aids. This is a five stage process. The stages in this process are art, colouring, paint brush.

Bar Graph Icon For Research Analysis Ppt PowerPoint Presentation Summary Portfolio
Presenting this set of slides with name bar graph icon for research analysis ppt powerpoint presentation summary portfolio. This is a three stage process. The stages in this process are data visualization icon, research analysis, business focus. This is a completely editable PowerPoint presentation and is available for immediate download. Download now and impress your audience.

Business Circle Chart PowerPoint Templates Success Lego Blocks Flowchart Ppt Slides
Business Circle Chart PowerPoint Templates Success Lego Blocks Flowchart PPT Slides-This PowerPoint diagram shows a circular process with 2 arrows. Useful to represent process slides-Business Circle Chart PowerPoint Templates Success Lego Blocks Flowchart PPT Slides-This template can be used for presentations relating to Activity, Background, Block, Box, Brick, Build, Buildings, Child, Childhood, Colourful, Concept, Connect, Connection, Construction, Cube, Design, Development, Education, Element, Fun, Game, Geometric
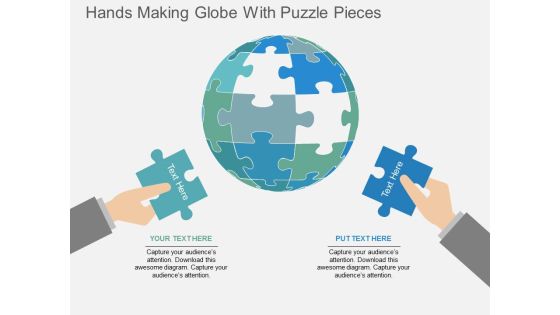
Hands Making Globe With Puzzle Pieces Powerpoint Templates
Our above slide contains graphics of hands making globe design with puzzle pieces. This PowerPoint template helps to display concept of global business solution. Use this diagram to impart more clarity to data and to create more sound impact on viewers.

Bar Graph Ppt PowerPoint Presentation Ideas
This is a bar graph ppt powerpoint presentation ideas. This is a two stage process. The stages in this process are computer, graph, growth, success, social.

Bar Chart Ppt PowerPoint Presentation Model
This is a bar chart ppt powerpoint presentation model. This is a two stage process. The stages in this process are business, marketing, product, planning, management.

Mba Models And Frameworks Post It Notes Style 4 Consulting Diagram
Our MBA Models And Frameworks post it notes style 4 Consulting Diagram Powerpoint Templates Are Like Lego Blocks. Build On Them And Get Any Shape You Want. Set Your Imagination Free With Our MBA Models And Frameworks post it notes style 4 Consulting Diagram Powerpoint Templates. They Will Be The Building Blocks Of Your Impressive Presentation.

Bar Graph Ppt PowerPoint Presentation Model Graphic Tips
This is a bar graph ppt powerpoint presentation model graphic tips. This is a two stage process. The stages in this process are we are dollars in millions, financials years, bar graph, product, business.

Bar Graph Ppt PowerPoint Presentation Gallery Example File
This is a bar graph ppt powerpoint presentation gallery example file. This is a two stage process. The stages in this process are column, bar graph, business, marketing, management.

Adjusted Roce Template 1 Ppt PowerPoint Presentation Styles Background Designs
This is a adjusted roce template 1 ppt powerpoint presentation styles background designs. This is a seven stage process. The stages in this process are bar graph, finance, year, business, marketing.

Clustered Column Line Ppt PowerPoint Presentation Slide
This is a clustered column line ppt powerpoint presentation slide. This is a three stage process. The stages in this process are bar graph, growth, finance, product, sales in percentage.
Product Launch Budget Plan Ppt PowerPoint Presentation Icon Slide
This is a product launch budget plan ppt powerpoint presentation icon slide. This is a seven stage process. The stages in this process are bar graph, icons, percentage, finance, business.
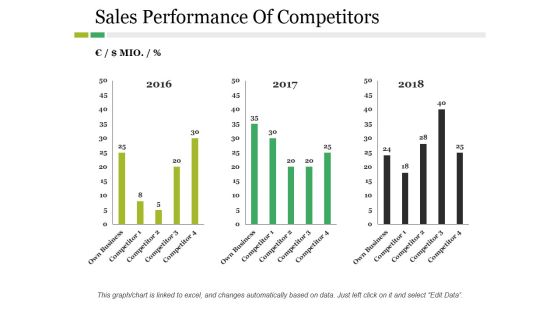
Sales Performance Of Competitors Ppt PowerPoint Presentation Inspiration Example
This is a sales performance of competitors ppt powerpoint presentation inspiration example. This is a three stage process. The stages in this process are business, marketing, year, bar graph, finance.

Competitors Average Price Product Ppt PowerPoint Presentation Icon Layout
This is a competitors average price product ppt powerpoint presentation icon layout. This is a five stage process. The stages in this process are company, bar graph, finance, business, marketing.
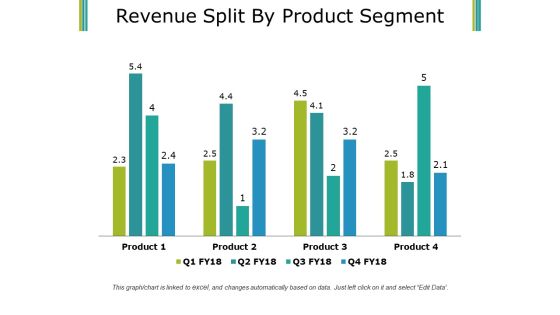
Revenue Split By Product Segment Template 1 Ppt PowerPoint Presentation Infographics Smartart
This is a revenue split by product segment template 1 ppt powerpoint presentation infographics smartart. This is a four stage process. The stages in this process are business, finance, marketing, bar graph, product.
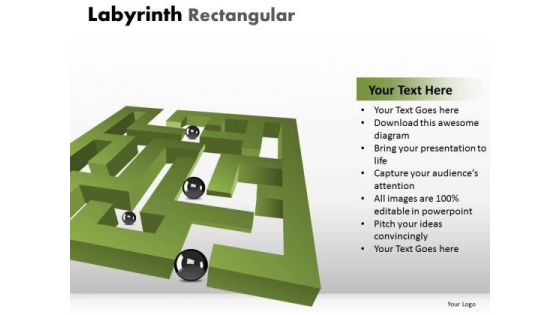
Consulting Diagram Labyrinth Rectangular Business Cycle Diagram
Our Consulting Diagram Labyrinth Rectangular Business Cycle Diagram Powerpoint Templates give good value for money. They also have respect for the value of your time. Take a leap off the starting blocks with our Consulting Diagram Labyrinth Rectangular Business Cycle Diagram Powerpoint Templates. They will put you ahead of the competition in quick time.
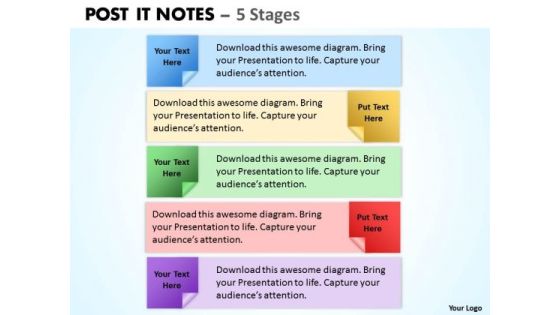
Business Framework Model Post It Notes Business Diagram
Our Business Framework Model POST IT NOTES Business Diagram Powerpoint Templates give good value for money. They also have respect for the value of your time. Take a leap off the starting blocks with our Business Framework Model POST IT NOTES Business Diagram Powerpoint Templates. They will put you ahead of the competition in quick time.
Marketing Diagram Labyrinth Misc Business Framework Model
Raise the bar with our Marketing Diagram Labyrinth Misc Business Framework Model Powerpoint Templates. They are programmed to take you to the next level. Our Marketing Diagram Labyrinth Misc Business Framework Model Powerpoint Templates bring a lot to the table. Their alluring flavors will make your audience salivate.
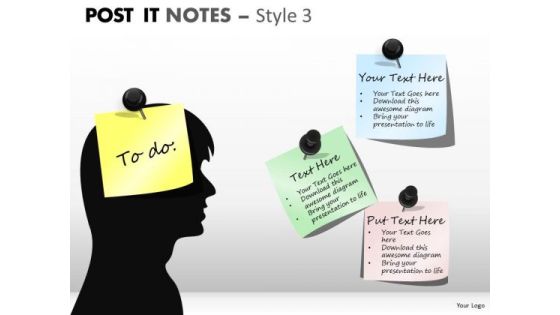
Business Framework Model Post It Notes Style 3 Sales Diagram
Raise the bar with our Business Framework Model Post It Notes Style 3 Sales Diagram Powerpoint Templates. They are programmed to take you to the next level. Our Business Framework Model Post It Notes Style 3 Sales Diagram Powerpoint Templates bring a lot to the table. Their alluring flavours will make your audience salivate.

Mba Models And Frameworks Labyrinth Rectangular Strategy Diagram
Be The Puppeteer With Our MBA Models And Frameworks Labyrinth Rectangular Strategy Diagram Powerpoint Templates As Your Strings. Lead Your Team Through The Steps Of Your Script. Double Your Output With Our MBA Models And Frameworks Labyrinth Rectangular Strategy Diagram Powerpoint Templates. They Make Beating Deadlines A Piece Of Cake.

Area Ppt PowerPoint Presentation Show
This is a area ppt powerpoint presentation show. This is a two stage process. The stages in this process are area, bar graph, growth, years, business.
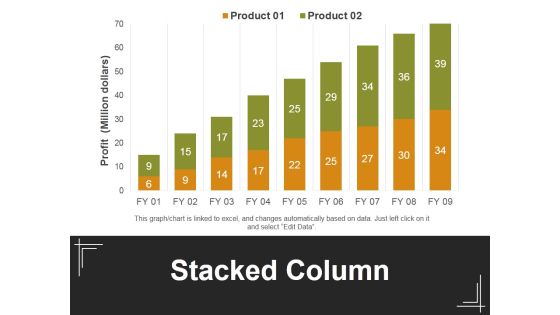
Stacked Column Ppt PowerPoint Presentation Outline Maker
This is a stacked column ppt powerpoint presentation outline maker. This is a two stage process. The stages in this process are profit, stacked bar, product, business, marketing.
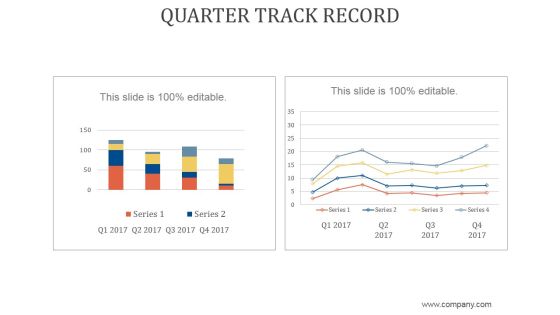
Quarter Track Record Ppt PowerPoint Presentation Samples
This is a quarter track record ppt powerpoint presentation samples. This is a two stage process. The stages in this process are business, strategy, marketing, analysis, growth strategy, bar graph.

Comparison Of Prices Ppt PowerPoint Presentation Designs Download
This is a comparison of prices ppt powerpoint presentation designs download. This is a two stage process. The stages in this process are comparison of prices, marketing, in percentage, bar graph, business.
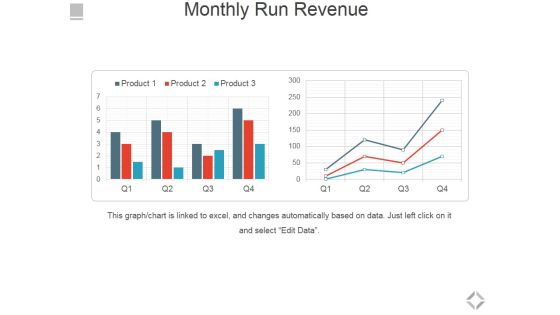
Monthly Run Revenue Ppt PowerPoint Presentation Show Styles
This is a monthly run revenue ppt powerpoint presentation show styles. This is a two stage process. The stages in this process are bar graph, business, marketing, success, growth.

 Home
Home