2 Sections

Bar Graph Showing Five Option For Business Expansion Ppt PowerPoint Presentation Portfolio Brochure PDF
Presenting this set of slides with name bar graph showing five option for business expansion ppt powerpoint presentation portfolio brochure pdf. This is a five stage process. The stages in this process are exporting, licencing, franchising, contract manufacturing, joint ventures. This is a completely editable PowerPoint presentation and is available for immediate download. Download now and impress your audience.
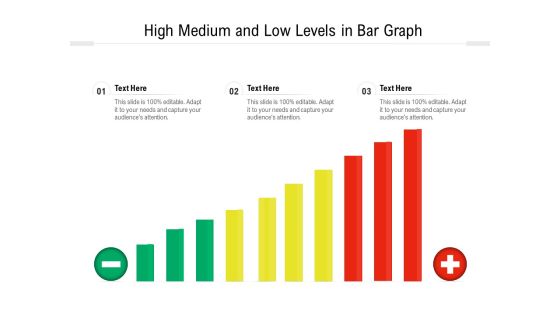
High Medium And Low Levels In Bar Graph Ppt PowerPoint Presentation Professional Design Ideas PDF
Presenting high medium and low levels in bar graph ppt powerpoint presentation professional design ideas pdf to dispense important information. This template comprises one stages. It also presents valuable insights into the topics including low, medium, high. This is a completely customizable PowerPoint theme that can be put to use immediately. So, download it and address the topic impactfully.

Bar Chart With Magnifying Glass And Dollar Symbol For Financial Analysis Ppt PowerPoint Presentation File Structure PDF
Presenting this set of slides with name bar chart with magnifying glass and dollar symbol for financial analysis ppt powerpoint presentation file structure pdf. This is a one stage process. The stages in this process is bar chart with magnifying glass and dollar symbol for financial analysis. This is a completely editable PowerPoint presentation and is available for immediate download. Download now and impress your audience.
Gender Salary Gap Icon With Bar Chart And Dollar Symbol Ppt PowerPoint Presentation Model Graphic Tips PDF
Presenting gender salary gap icon with bar chart and dollar symbol ppt powerpoint presentation model graphic tips pdf to dispense important information. This template comprises three stages. It also presents valuable insights into the topics including gender salary gap icon with bar chart and dollar symbol. This is a completely customizable PowerPoint theme that can be put to use immediately. So, download it and address the topic impactfully.

Man Standing With Stack Of Us Currency Notes Bundles Ppt Powerpoint Presentation File Slides
This is a man standing with stack of us currency notes bundles ppt powerpoint presentation file slides. This is a three stage process. The stages in this process are stacked bar, pile bar, heap bar.

Stack Of Dollar Currency Banknotes For Financial Success Ppt Powerpoint Presentation Slides Background
This is a stack of dollar currency banknotes for financial success ppt powerpoint presentation slides background. This is a five stage process. The stages in this process are stacked bar, pile bar, heap bar.
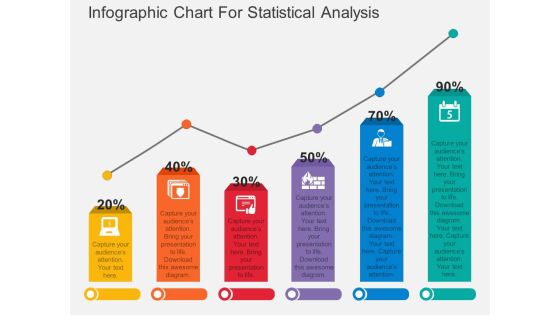
Infographic Chart For Statistical Analysis Powerpoint Template
Download this exclusive business diagram to display statistical analysis. This PowerPoint template contains bar chart with percentage values. This diagram is useful for business presentations.
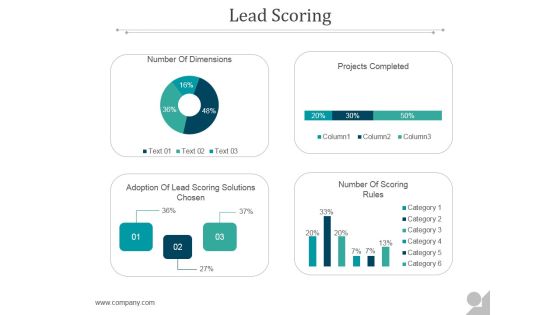
Lead Scoring Ppt PowerPoint Presentation Layouts
This is a lead scoring ppt powerpoint presentation layouts. This is a four stage process. The stages in this process are lead, business, bar graph, marketing, management.

Clustered Column Ppt PowerPoint Presentation Slide Download
This is a clustered column ppt powerpoint presentation slide download. This is a twelve stage process. The stages in this process are bar graph, marketing, strategy, analysis, business.

Competitor Analysis Graph Ppt PowerPoint Presentation Outline
This is a competitor analysis graph ppt powerpoint presentation outline. This is a five stage process. The stages in this process are bar graph, marketing, strategy, analysis, business.

Competitors Analysis 1 Ppt PowerPoint Presentation Outline Templates
This is a competitors analysis 1 ppt powerpoint presentation outline templates. This is a four stage process. The stages in this process are revenue, business, marketing, bar, success.

Clustered Column Line Ppt PowerPoint Presentation File Shapes
This is a clustered column line ppt powerpoint presentation file shapes. This is a four stage process. The stages in this process are business, marketing, strategy, bar, success.
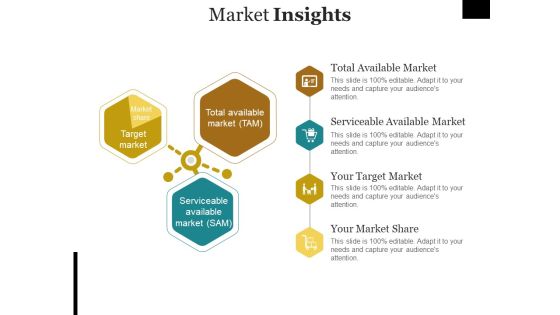
Market Insights Template Ppt PowerPoint Presentation Summary Example
This is a market insights template ppt powerpoint presentation summary example. This is a three stage process. The stages in this process are business, bar, market, growth, success.
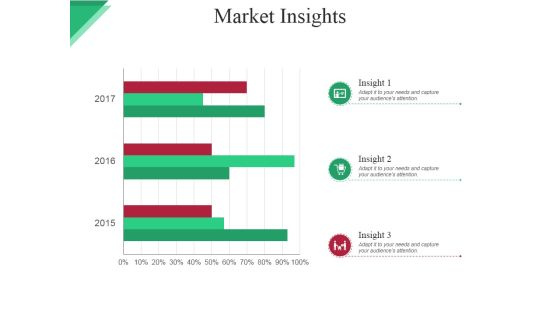
Market Insights Ppt PowerPoint Presentation Infographics Graphics
This is a market insights ppt powerpoint presentation infographics graphics. This is a three stage process. The stages in this process are icons, business, bar, marketing, strategy.

Competitive Analysis Ppt PowerPoint Presentation Summary Model
This is a competitive analysis ppt powerpoint presentation summary model. This is a six stage process. The stages in this process are business, marketing, strategy, bar, finance.

Column Chart Ppt PowerPoint Presentation Show Model
This is a column chart ppt powerpoint presentation show model. This is a six stage process. The stages in this process are business, marketing, bar, planning, strategy.

Channel Kpis Ppt PowerPoint Presentation Professional Inspiration
This is a channel kpis ppt powerpoint presentation professional inspiration. This is a four stage process. The stages in this process are bar graph, marketing, finance, strategy, planning.

Financial Highlights Ppt PowerPoint Presentation Gallery Deck
This is a financial highlights ppt powerpoint presentation gallery deck. This is a four stage process. The stages in this process are bar graph, marketing, finance, strategy, planning.

Combo Chart Ppt PowerPoint Presentation Show Summary
This is a combo chart ppt powerpoint presentation show summary. This is a three stage process. The stages in this process are bar, marketing, strategy, finance, planning.
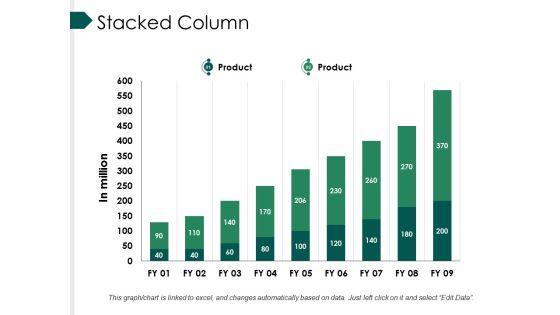
Stacked Column Ppt PowerPoint Presentation Professional Infographics
This is a stacked column ppt powerpoint presentation professional infographics. This is a nine stage process. The stages in this process are bar, marketing, strategy, finance, teamwork.

Sales Projections Ppt PowerPoint Presentation Model Examples
This is a sales projections ppt powerpoint presentation model examples. This is a five stage process. The stages in this process are on sales, in years, bar graph.
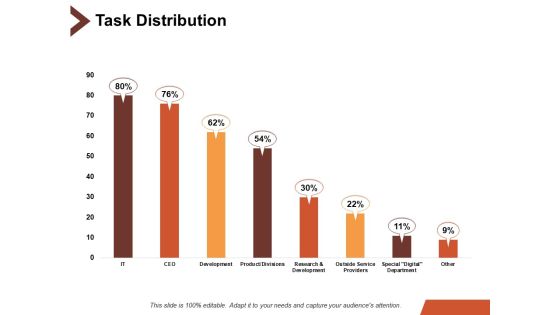
Task Distribution Ppt PowerPoint Presentation Outline Rules
This is a task distribution ppt powerpoint presentation outline rules. This is a eight stage process. The stages in this process are bar chart, finance, marketing, business, analysis.

Column Chart Graph Ppt PowerPoint Presentation Slides File Formats
This is a combo chart bar ppt powerpoint presentation slides portfolio. This is a three stage process. The stages in this process are finance, marketing, analysis, investment, million.
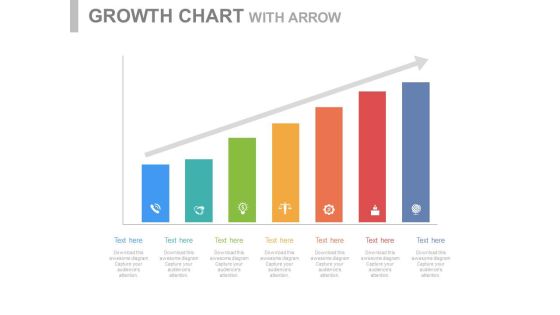
Steps For Developing Strategic Plan Powerpoint Slides
This PowerPoint template is useful for setting goals and developing strategies. This PPT background has a design of seven steps bar graph. This PPT slide is suitable for topics like corporate strategic planning.
Setting Goals And Developing Strategies Powerpoint Slides
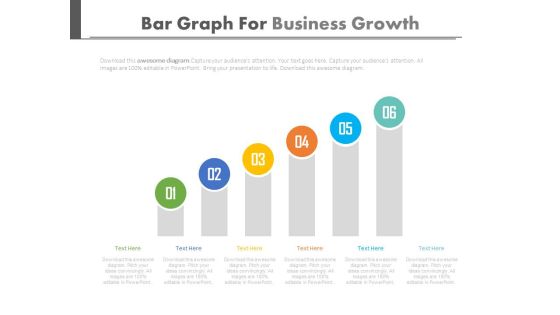
This PowerPoint template is useful for setting goals and developing strategies. This PPT background has a design of six steps bar graph. This PPT slide is suitable for topics like corporate strategic planning.
Development And Testing Ppt PowerPoint Presentation Background Designs
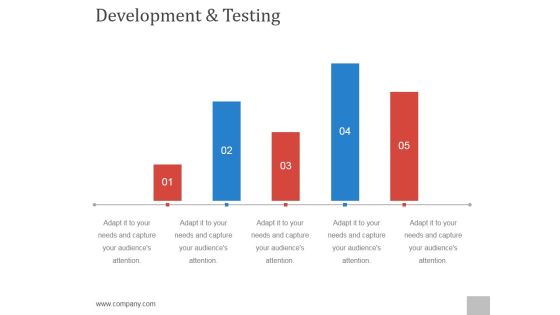
This is a development and testing ppt powerpoint presentation background designs. This is a five stage process. The stages in this process are step, business, growth, success, bar graph.
Mobile For Online Survey And Analysis Powerpoint Slides
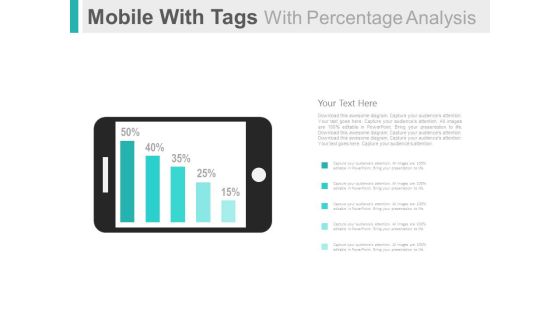
This PowerPoint template has been designed with graphics of mobile and percentage bar graph. This PPT slide can be used to display online survey and analysis. You can download finance PowerPoint template to prepare awesome presentations.

About Us Companys Data Information Powerpoint Slides
Download this PowerPoint template to create an attention grabbing introductory slide. It contains slide bar graph with employee image. Use this professional slide design to build a good reputation of your company.
Search Engine Optimization Metrics Sample Diagram Ppt Slides
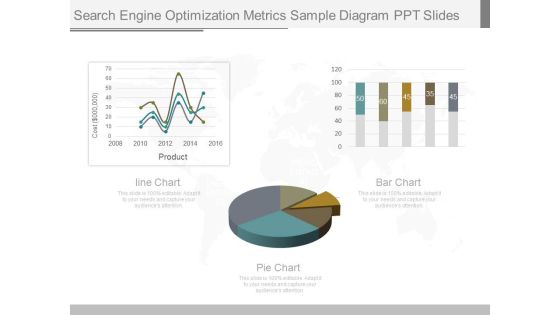
This is a search engine optimization metrics sample diagram ppt slides. This is a three stage process. The stages in this process are cost, product, line chart, bar chart, pie chart.
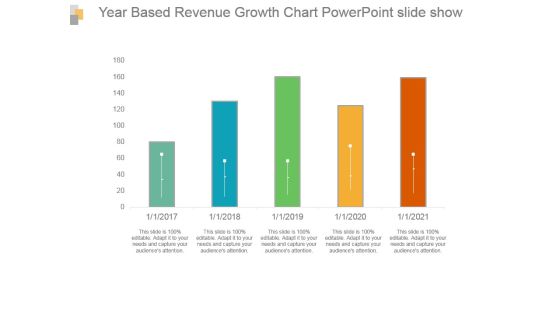
Year Based Revenue Growth Chart Powerpoint Slide Show
This is a year based revenue growth chart powerpoint slide show. This is a five stage process. The stages in this process are bar graph, growth, revenue, year, success.

Annual Customer Service Performance Review Example Of Ppt
This is a annual customer service performance review example of ppt. This is a twelve stage process. The stages in this process are bar graph, growth, data, customer, success.

Data Collection And Analysis Control Chart Ppt PowerPoint Presentation Example File
This is a data collection and analysis control chart ppt powerpoint presentation example file. This is a four stage process. The stages in this process are business, strategy, marketing, bar graph, growth strategy.

Lead Scoring Template Ppt PowerPoint Presentation Model
This is a lead scoring template ppt powerpoint presentation model. This is a four stage process. The stages in this process are business, marketing, success, bar graph, lead scoring.

Combo Chart Ppt PowerPoint Presentation Infographics Infographics
This is a combo chart ppt powerpoint presentation infographics infographics. This is a three stage process. The stages in this process are bar graph, growth, finance, marketing, strategy, business.

Crm Dashboard Current Lead Status Ppt PowerPoint Presentation Infographic Template Visual Aids
This is a crm dashboard current lead status ppt powerpoint presentation infographic template visual aids. This is a six stage process. The stages in this process are bar graph, finance, marketing, strategy, business, analysis.

Crm Dashboard Deals By Expected Close Date Ppt PowerPoint Presentation Portfolio Icons
This is a crm dashboard deals by expected close date ppt powerpoint presentation portfolio icons. This is a three stage process. The stages in this process are bar graph, finance, marketing, strategy, business, analysis, growth.

Crm Dashboard Top Customers Ppt PowerPoint Presentation Styles Designs
This is a crm dashboard top customers ppt powerpoint presentation styles designs. This is a ten stage process. The stages in this process are business, customer, finance, bar graph, marketing, strategy, analysis.

Advertising Spent On Different Mediums Ppt PowerPoint Presentation Infographics Show
This is a advertising spent on different mediums ppt powerpoint presentation infographics show. This is a five stage process. The stages in this process are business, finance, marketing, strategy, bar graph, growth.
Revenue Split By Product Segment Template 1 Ppt PowerPoint Presentation Ideas Icons
This is a revenue split by product segment template 1 ppt powerpoint presentation ideas icons. This is a four stage process. The stages in this process are business, marketing, success, bar graph, product.
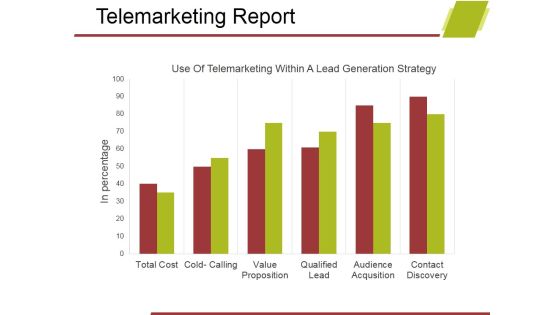
Telemarketing Report Template 1 Ppt PowerPoint Presentation Show Design Ideas
This is a telemarketing report template 1 ppt powerpoint presentation show design ideas. This is a six stage process. The stages in this process are business, bar graph, marketing, analysis, growth, strategy.

Revenue Split By Product Segment Ppt PowerPoint Presentation Ideas Graphics
This is a revenue split by product segment ppt powerpoint presentation ideas graphics. This is a four stage process. The stages in this process are business, marketing, bar graph, success.

Gap Between Current And Required Staff Ppt PowerPoint Presentation Infographic Template Microsoft
This is a gap between current and required staff ppt powerpoint presentation infographic template microsoft. This is a five stage process. The stages in this process are business, bar graph, finance, marketing, strategy, analysis.

Competitors Analysis Template Ppt PowerPoint Presentation Infographic Template Rules
This is a competitors analysis template ppt powerpoint presentation infographic template rules. This is a four stage process. The stages in this process are net profit margin, finance, marketing, bar, success.

Competitors Analysis Ppt PowerPoint Presentation Inspiration Layout Ideas
This is a competitors analysis ppt powerpoint presentation inspiration layout ideas. This is a four stage process. The stages in this process are cost of goods sold, bar, finance, business, marketing, success.

Financial Projection Graph Template 1 Ppt PowerPoint Presentation Professional Example Introduction
This is a financial projection graph template 1 ppt powerpoint presentation professional example introduction. This is a three stage process. The stages in this process are business, bar graph, finance, marketing, strategy, analysis.

Types Of Channel Promotion Used Ppt PowerPoint Presentation Outline Display
This is a types of channel promotion used ppt powerpoint presentation outline display. This is a ten stage process. The stages in this process are bar graph, business, marketing, strategy, charts.

Revenue Split By Product Segment Template 1 Ppt PowerPoint Presentation Summary Example
This is a revenue split by product segment template 1 ppt powerpoint presentation summary example. This is a four stage process. The stages in this process are bar, business, marketing, finance, analysis.
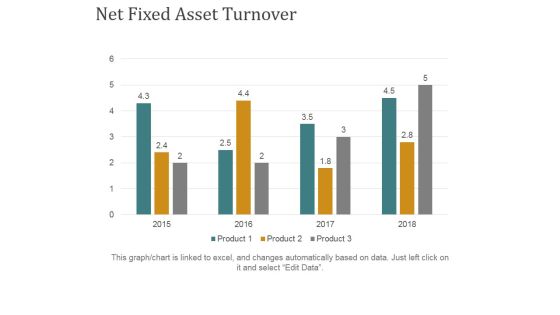
Net Fixed Asset Turnover Ppt PowerPoint Presentation Ideas Grid
This is a net fixed asset turnover ppt powerpoint presentation ideas grid. This is a four stage process. The stages in this process are business, finance, marketing, bar graph, strategy.

World Sector Growth Ppt PowerPoint Presentation Gallery Template
This is a world sector growth ppt powerpoint presentation gallery template. This is a four stage process. The stages in this process are business, bar graph, finance, marketing, strategy.

Staff Acquisition Cost Cost Per Hire Ppt PowerPoint Presentation Styles Guidelines
This is a staff acquisition cost cost per hire ppt powerpoint presentation styles guidelines. This is a seven stage process. The stages in this process are cost per hire, bar graph, business, marketing, planning.
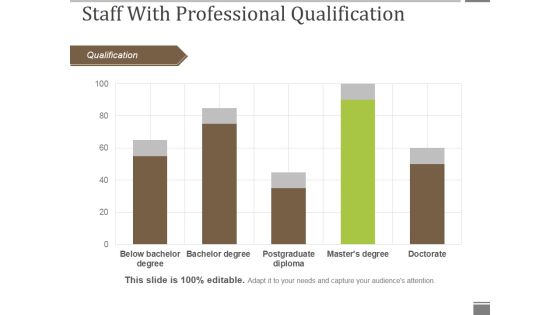
Staff With Professional Qualification Ppt PowerPoint Presentation Gallery Graphics Pictures
This is a staff with professional qualification ppt powerpoint presentation gallery graphics pictures. This is a five stage process. The stages in this process are qualification, bar graph, business, marketing, success.

Workforce Diversity By Age Group Ppt PowerPoint Presentation Visual Aids Gallery
This is a workforce diversity by age group ppt powerpoint presentation visual aids gallery. This is a three stage process. The stages in this process are by age group, bar graph, business, marketing, presentation.
Workforce Diversity By Region Ppt PowerPoint Presentation Icon Graphics Pictures
This is a workforce diversity by region ppt powerpoint presentation icon graphics pictures. This is a four stage process. The stages in this process are by region, bar graph, business, presentation, marketing.

Clustered Column Line Chart Ppt PowerPoint Presentation Professional Slides
This is a clustered column line chart ppt powerpoint presentation professional slides. This is a four stage process. The stages in this process are bar, finance, business, marketing, growth.

Column Chart Ppt PowerPoint Presentation Styles Graphic Tips
This is a column chart ppt powerpoint presentation styles graphic tips. This is a six stage process. The stages in this process are slide bar, business, marketing, strategy, finance.

Current Staff Profile Years Of Experience Ppt PowerPoint Presentation File Graphics Tutorials
This is a current staff profile years of experience ppt powerpoint presentation file graphics tutorials. This is a four stage process. The stages in this process are business, marketing, strategy, finance, bar.
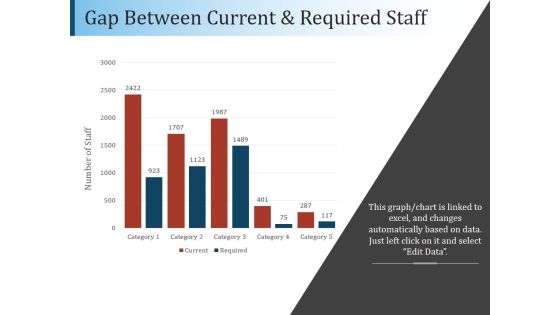
Gap Between Current And Required Staff Ppt PowerPoint Presentation File Diagrams
This is a gap between current and required staff ppt powerpoint presentation file diagrams. This is a five stage process. The stages in this process are bar, finance, analysis, planning, business.

Internal Analysis Current Levels Of Performance Ppt PowerPoint Presentation Outline Format Ideas
This is a internal analysis current levels of performance ppt powerpoint presentation outline format ideas. This is a three stage process. The stages in this process are employee performance, bar, business, success, marketing.
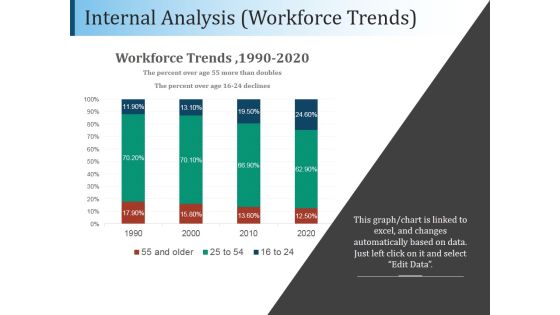
Internal Analysis Workforce Trends Ppt PowerPoint Presentation Example
This is a internal analysis workforce trends ppt powerpoint presentation example. This is a four stage process. The stages in this process are workforce trends, business, marketing, bar, finance.

Competitor Analysis Graph Ppt PowerPoint Presentation Slides Elements
This is a competitor analysis graph ppt powerpoint presentation slides elements. This is a five stage process. The stages in this process are bar graph, finance, marketing, strategy, business.

 Home
Home