2 Sections

Stacked Bar Template 1 Ppt PowerPoint Presentation Infographic Template Format
This is a stacked bar template 1 ppt powerpoint presentation infographic template format. This is a four stage process. The stages in this process are product, stacked bar, business, marketing, bar graph.

Bar Graph Ppt PowerPoint Presentation Layouts Design Templates
This is a bar graph ppt powerpoint presentation layouts design templates. This is a four stage process. The stages in this process are bar graph, planning, business, management, strategy.

Bar Graph Ppt PowerPoint Presentation Outline Design Templates
This is a bar graph ppt powerpoint presentation outline design templates. This is a nine stage process. The stages in this process are bar graph, management, planning, strategy, marketing.

Bar Chart Ppt PowerPoint Presentation Slides Design Ideas
This is a bar chart ppt powerpoint presentation slides design ideas. This is a six stage process. The stages in this process are product, bar chart, sales in percentage.
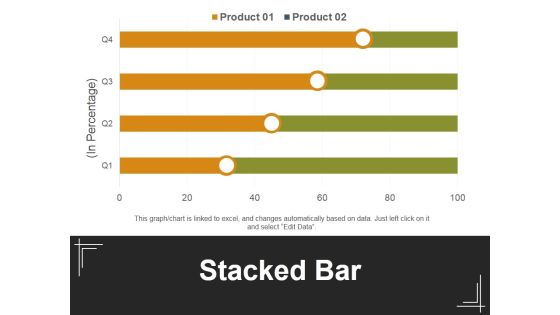
Stacked Bar Template 1 Ppt PowerPoint Presentation Inspiration Background Designs
This is a stacked bar template 1 ppt powerpoint presentation inspiration background designs. This is a four stage process. The stages in this process are in percentage, stacked bar, product, business, marketing.

Bar Graph Ppt PowerPoint Presentation Infographic Template Template
This is a bar graph ppt powerpoint presentation infographic template template. This is a three stage process. The stages in this process are bar graph, sales in percentage, product, planning, business.

Bar Chart Ppt PowerPoint Presentation Infographic Template Brochure
This is a bar chart ppt powerpoint presentation infographic template brochure. This is a seven stage process. The stages in this process are bar graph, finance, marketing, strategy, analysis, business.

Bar Graph Ppt PowerPoint Presentation Slides Visual Aids
This is a bar graph ppt powerpoint presentation slides visual aids. This is a three stage process. The stages in this process are sales in percentage, bar graph, business, marketing, success.

Infographic Bar Chart For Business Practices Powerpoint Template
The PowerPoint template displays infographic of bar chart. This diagram has been professionally designed to display business practices. Grab centre stage with this diagram slide.

Bar Graph For Financial Statements Ppt PowerPoint Presentation Example
This is a bar graph for financial statements ppt powerpoint presentation example. This is a four stage process. The stages in this process are product version, finance, year.
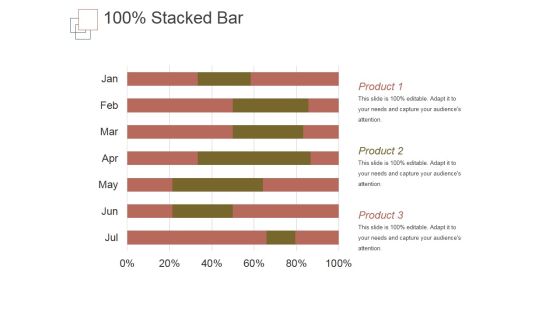
Stacked Bar Template 1 Ppt PowerPoint Presentation Themes
This is a stacked bar template 1 ppt powerpoint presentation themes. This is a six stage process. The stages in this process are product, business, marketing, success, management.

Bar Graph Ppt PowerPoint Presentation File Graphic Images
This is a bar graph ppt powerpoint presentation file graphic images. This is a three stage process. The stages in this process are business, marketing, chart, finance, product.

Growth Arrow On Bar Graph Infographics Powerpoint Template
This PowerPoint template has been designed with growth arrow on bar graph. You may download this diagram slide to display growth and progress concepts. Illustrate your plans to your listeners with this impressive template.

Dollar Coins Money Growth Bar Graph Powerpoint Template
Use this PowerPoint template, in your corporate presentations. It contains bar graph of dollar coins. This business slide may be used to exhibit money growth. Make wonderful presentations using this diagram.

Bar Graph With Plant For Growth Powerpoint Template
This PowerPoint template has been designed with diagram of bar graph with plant. This infographic template may be used to display growth and progress. Accelerate the impact of your ideas using this template.
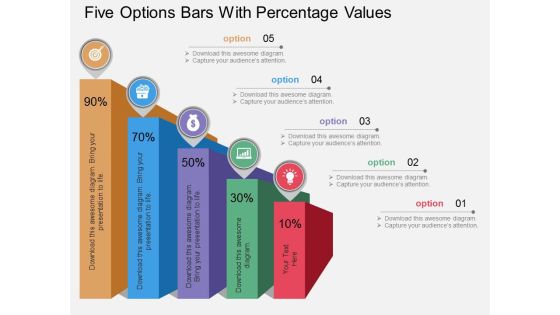
Five Options Bars With Percentage Values Powerpoint Template
Our professionally designed business diagram is as an effective tool for communicating ideas and planning. It contains five options bars with percentage values. Convey your views with this diagram slide. It will amplify the strength of your logic.
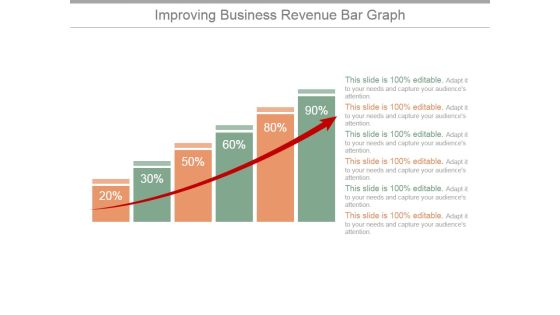
Improving Business Revenue Bar Graph Ppt PowerPoint Presentation Infographic Template
This is a improving business revenue bar graph ppt powerpoint presentation infographic template. This is a six stage process. The stages in this process are graph, arrow, finance, percentage, success.
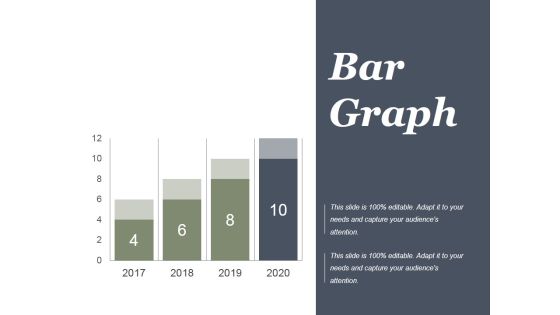
Project Performance Bar Graph Ppt PowerPoint Presentation Outline
This is a project performance bar graph ppt powerpoint presentation outline. This is a four stage process. The stages in this process are finance, year, business, marketing, future, marketing.
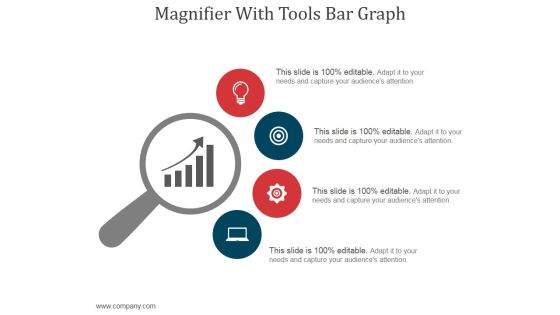
Magnifier With Tools Bar Graph Ppt PowerPoint Presentation Professional
This is a magnifier with tools bar graph ppt powerpoint presentation professional. This is a four stage process. The stages in this process are magnifier, business, marketing, strategy, icons.

Clustered Bar Template 1 Ppt PowerPoint Presentation Icon Gallery
This is a clustered bar template 1 ppt powerpoint presentation icon gallery. This is a four stage process. The stages in this process are finance, management, planning, strategy, marketing.

Tablet With Bar Graph And Pie Chart Powerpoint Templates
This business slide has been designed with business graphs on computer tablet. You may download this PPT slide to display statistical analysis. This slide will help you to sequence your thoughts.
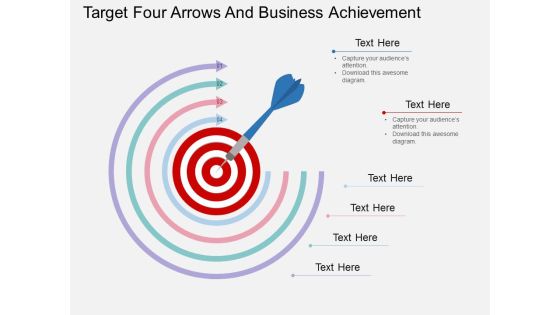
Target Four Arrows And Business Achievement Powerpoint Template
Download this exclusive business diagram to present strategy for target achievement. This PPT diagram slide contains the graphic of target board with arrow and icons. This diagram can be used for business presentations.

Bar Graph With Arrow For Career Planning Ppt PowerPoint Presentation Gallery
This is a bar graph with arrow for career planning ppt powerpoint presentation gallery. This is a six stage process. The stages in this process are business, finance, marketing, strategy, planning, success, arrow.

Campaign Performance Ppt PowerPoint Presentation Deck
This is a campaign performance ppt powerpoint presentation deck. This is a four stage process. The stages in this process are business, bar graph, strategy, growth, success.

Stacked Column Ppt PowerPoint Presentation Files
This is a stacked column ppt powerpoint presentation files. This is a nine stage process. The stages in this process are bar graph, finance, marketing, analysis, business.

Competitive Analysis Ppt PowerPoint Presentation Sample
This is a competitive analysis ppt powerpoint presentation sample. This is a six stage process. The stages in this process are business, marketing, success, bar graph, management.

Pareto Chart Ppt PowerPoint Presentation Ideas
This is a pareto chart ppt powerpoint presentation ideas. This is a four stage process. The stages in this process are bar graph, finance, marketing, strategy, analysis, business.

Bubble Ppt PowerPoint Presentation Guidelines
This is a bubble ppt powerpoint presentation guidelines. This is a five stage process. The stages in this process are bubble, business, bar graph, marketing, presentation.

Financial Report Ppt PowerPoint Presentation Styles Skills
This is a financial report ppt powerpoint presentation styles skills. This is a four stage process. The stages in this process are bar graph, business, marketing, success, growth.

Financial Strength Ppt PowerPoint Presentation Summary Ideas
This is a financial strength ppt powerpoint presentation summary ideas. This is a four stage process. The stages in this process are bar graph, business, marketing, success, growth.
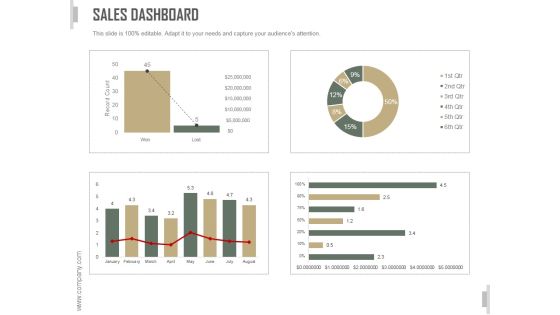
Sales Dashboard Slide Ppt PowerPoint Presentation Template
This is a sales dashboard slide ppt powerpoint presentation template. This is a three stage process. The stages in this process are business, strategy, marketing, analysis, bar graph, growth strategy.
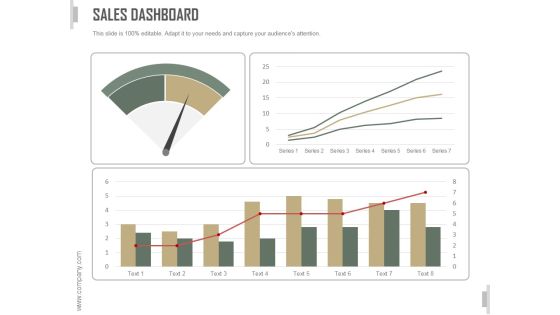
Sales Dashboard Ppt PowerPoint Presentation Design Templates
This is a sales dashboard ppt powerpoint presentation design templates. This is a four stage process. The stages in this process are business, strategy, marketing, analysis, bar graph, growth strategy.
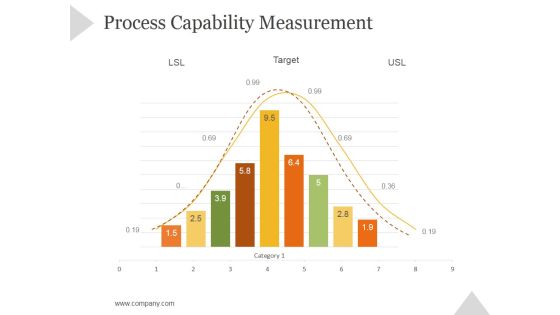
Process Capability Measurement Ppt PowerPoint Presentation Rules
This is a process capability measurement ppt powerpoint presentation rules. This is a nine stage process. The stages in this process are business, strategy, marketing, success, bar graph, growth strategy.

Budgeting Planned Actual Comparison Ppt PowerPoint Presentation Portfolio
This is a budgeting planned actual comparison ppt powerpoint presentation portfolio. This is a three stage process. The stages in this process are business, strategy, marketing, analysis, success, bar graph.

Clustered Column Template 1 Ppt PowerPoint Presentation Inspiration
This is a clustered column template 1 ppt powerpoint presentation inspiration. This is a twelve stage process. The stages in this process are bar graph, marketing, strategy, analysis, business, success.

Customer Trends Template 1 Ppt PowerPoint Presentation Diagrams
This is a customer trends template 1 ppt powerpoint presentation diagrams. This is a five stage process. The stages in this process are business, marketing, bar graph, finance, management.
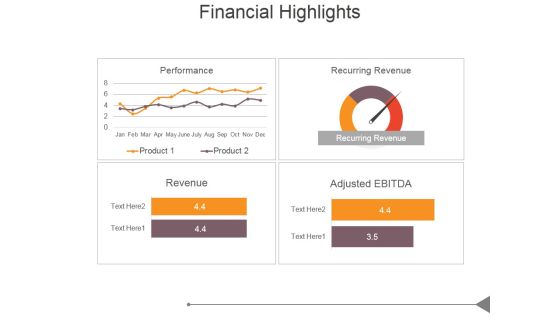
Financial Highlights Template 1 Ppt PowerPoint Presentation Model
This is a financial highlights template 1 ppt powerpoint presentation model. This is a four stage process. The stages in this process are business, marketing, success, business plan, bar graph.

Midstream Organic Growth Ppt PowerPoint Presentation Ideas Graphics Tutorials
This is a midstream organic growth ppt powerpoint presentation ideas graphics tutorials. This is a three stage process. The stages in this process are business, marketing, bar graph, management, financials.

Clustered Column Line Chart Ppt PowerPoint Presentation File Pictures
This is a clustered column line chart ppt powerpoint presentation file pictures. This is a four stage process. The stages in this process are clustered bar, product, planning, business, sales in percentage.

Gap Between Current And Required Staff Ppt PowerPoint Presentation File Tips
This is a gap between current and required staff ppt powerpoint presentation file tips. This is a five stage process. The stages in this process are number of staff, bar graph, business, marketing, success.

Clustered Column Line Ppt PowerPoint Presentation Model Images
This is a clustered column line ppt powerpoint presentation model images. This is a four stage process. The stages in this process are sales in percentage, product, business, marketing, bar graph.
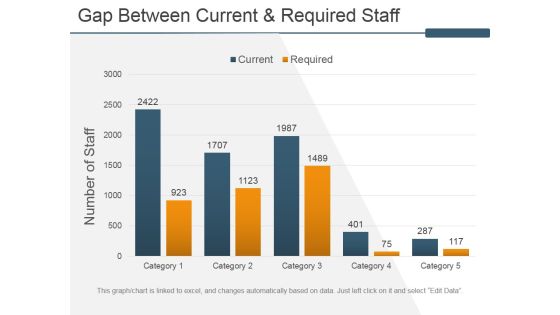
Gap Between Current And Required Staff Ppt PowerPoint Presentation Inspiration Slides
This is a gap between current and required staff ppt powerpoint presentation inspiration slides. This is a five stage process. The stages in this process are number of staff, bar graph, business, marketing, success.

Competitive Analysis Template 1 Ppt PowerPoint Presentation Icon Show
This is a competitive analysis template 1 ppt powerpoint presentation icon show. This is a six stage process. The stages in this process are competitive, analysis, business, marketing, bar graph.

Current Quarter Portfolio Template 1 Ppt PowerPoint Presentation Styles Mockup
This is a current quarter portfolio template 1 ppt powerpoint presentation styles mockup. This is a four stage process. The stages in this process are current quarter portfolio, pie chart, bar graph, business, marketing.
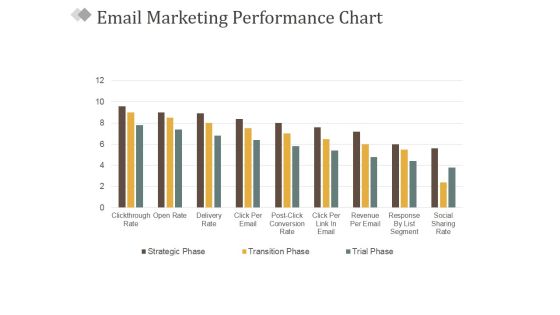
Email Marketing Performance Chart Ppt PowerPoint Presentation Gallery Elements
This is a email marketing performance chart ppt powerpoint presentation gallery elements. This is a nine stage process. The stages in this process are business, marketing, success, management, bar graph.
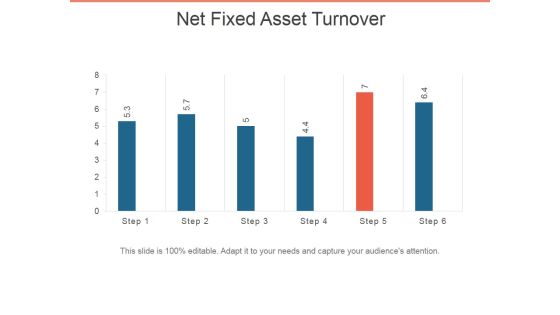
Net Fixed Asset Turnover Ppt PowerPoint Presentation Infographic Template Pictures
This is a net fixed asset turnover ppt powerpoint presentation infographic template pictures. This is a six stage process. The stages in this process are bar graph, business, marketing, presentation, success.

World Sector Growth Ppt PowerPoint Presentation Infographics Objects
This is a world sector growth ppt powerpoint presentation infographics objects. This is a four stage process. The stages in this process are bar graph, business, marketing, success, presentation.
Distribution Growth Ppt PowerPoint Presentation Slides Icons
This is a distribution growth ppt powerpoint presentation slides icons. This is a six stage process. The stages in this process are business, bar graph, finance, marketing, strategy, growth.
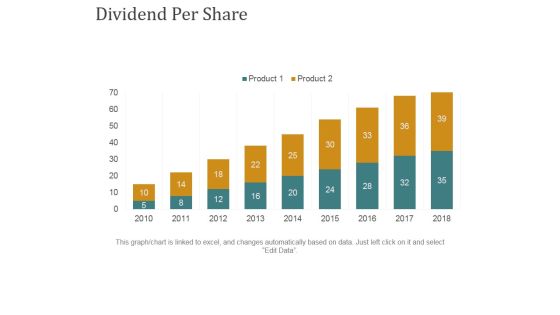
Dividend Per Share Ppt PowerPoint Presentation Summary Rules
This is a dividend per share ppt powerpoint presentation summary rules. This is a nine stage process. The stages in this process are business, bar graph, finance, marketing, strategy, growth.

Competency Rating Template 1 Ppt PowerPoint Presentation Outline Smartart
This is a competency rating template 1 ppt powerpoint presentation outline smartart. This is a eight stage process. The stages in this process are job related competencies, competency rating, bar graph, business, marketing.

Employee Turnover Rate Formula Ppt PowerPoint Presentation Pictures Aids
This is a employee turnover rate formula ppt powerpoint presentation pictures aids. This is a five stage process. The stages in this process are employee turnover, rate of tune over, business, marketing, bar graph.
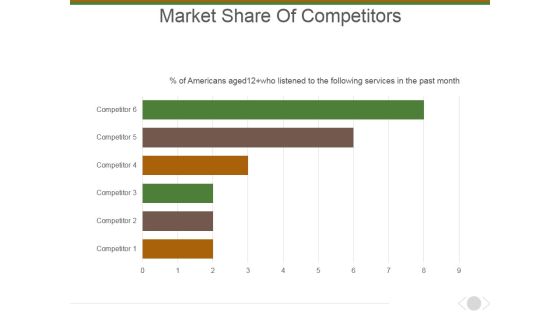
Market Share Of Competitors Ppt PowerPoint Presentation Layouts Picture
This is a market share of competitors ppt powerpoint presentation layouts picture. This is a six stage process. The stages in this process are marketing, business, management, bar graph, presentation.

Market Trends Current Number Ppt PowerPoint Presentation Outline Rules
This is a market trends current number ppt powerpoint presentation outline rules. This is a seven stage process. The stages in this process are market, bar graph, business, country, planning.
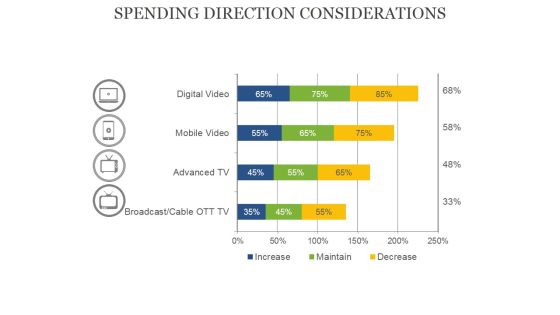
Spending Direction Considerations Ppt PowerPoint Presentation Portfolio Graphics Template
This is a spending direction considerations ppt powerpoint presentation portfolio graphics template. This is a four stage process. The stages in this process are bar graph, business, presentation, percentage, finance.

Jigsaw Puzzles With New Year Concept PowerPoint Templates Ppt Backgrounds For Slides 1112
We present our Jigsaw Puzzles With New Year Concept PowerPoint Templates PPT Backgrounds For Slides 1112.Use our Puzzles or jigsaws PowerPoint Templates because,It outlines the process with this innovative graphic to authenticate your plan of achieving the goal of added value/profit. Use our New Year PowerPoint Templates because,This is a time to reflect and retrospect on successes and failures. Use our Shapes PowerPoint Templates because,This is an excellent slide to detail and highlight your thought process, your views and your positive expectations.. Use our Success PowerPoint Templates because,You have come up with a brilliant breakthrough idea. You can also visualise the interest it will generate. Use our Business PowerPoint Templates because,You have churned your mind and come upwith solutions. Use these PowerPoint slides for presentations relating to 2013 puzzle blocks with 2, business, new year, puzzles or jigsaws, shapes, success. The prominent colors used in the PowerPoint template are Blue, Blue light, White. Customers tell us our Jigsaw Puzzles With New Year Concept PowerPoint Templates PPT Backgrounds For Slides 1112 are the best it can get when it comes to presenting. Professionals tell us our 2 PowerPoint templates and PPT Slides are Spectacular. PowerPoint presentation experts tell us our Jigsaw Puzzles With New Year Concept PowerPoint Templates PPT Backgrounds For Slides 1112 are Precious. PowerPoint presentation experts tell us our puzzles PowerPoint templates and PPT Slides are Detailed. Presenters tell us our Jigsaw Puzzles With New Year Concept PowerPoint Templates PPT Backgrounds For Slides 1112 are Handsome. Professionals tell us our with PowerPoint templates and PPT Slides are Liberated.

Bar Graph Ppt PowerPoint Presentation Layouts Pictures
This is a bar graph ppt powerpoint presentation layouts pictures. This is a four stage process. The stages in this process are fire, earthquake, axis title, in percentage.

Financial Crisis Bar Graphs Ppt PowerPoint Presentation Background Images
This is a financial crisis bar graphs ppt powerpoint presentation background images. This is a twelve stage process. The stages in this process are business, analysis, strategy, finance, success, management.

Financial Strength Ppt PowerPoint Presentation Shapes
This is a financial strength ppt powerpoint presentation shapes. This is a four stage process. The stages in this process are business, marketing, success, business plan, bar graph.
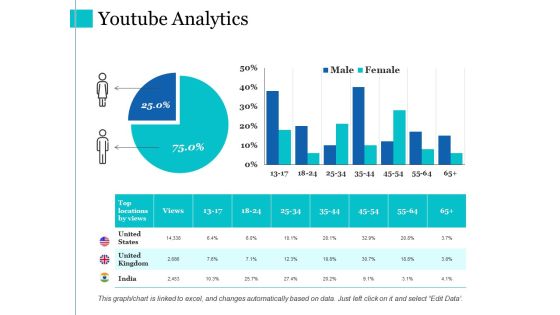
Youtube Analytics Ppt PowerPoint Presentation Layouts Graphic Images
This is a youtube analytics ppt powerpoint presentation layouts graphic images. This is a three stage process. The stages in this process are youtube analytics, finance, percentage, bar graph.

Business Framework Leadership Behavior PowerPoint Presentation
This PowerPoint diagram provides framework for leadership behavior. It contains graphics of box divided into two sections. This diagram depicts how a manager defines limits, asks group to make decision. Use this professional and customized business diagram in your PowerPoint presentations.

 Home
Home