2 Phases

Circle Chart For Financial Planning Process PowerPoint Slides
This PowerPoint template has been created by professionals keeping in mind the need of light slides with more information. The slide uses minimalistic yet impactful visuals to explain a 4 step process. The reducing size of the circles can be creatively used to show that the process or the steps are getting an organization or a business firm closer to its targets or goals. There is ample space available to write text describe the steps involved in the process. This can be an ideal presentation for a company to show its financial plan or sales strategy to its investors or clients to gain their confidence. The icons and colors of the slide are customizable and can be edited to match the theme of the slide or the topic of the presentation.

Circle Chart With Chat Bubble Vector Icon Ppt PowerPoint Presentation Ideas Design Ideas PDF
Presenting this set of slides with name circle chart with chat bubble vector icon ppt powerpoint presentation ideas design ideas pdf. This is a three stage process. The stages in this process are circle chart with chat bubble vector icon. This is a completely editable PowerPoint presentation and is available for immediate download. Download now and impress your audience.
Retail Shop With Pie Chart Vector Icon Ppt PowerPoint Presentation Slides Portfolio PDF
Presenting this set of slides with name retail shop with pie chart vector icon ppt powerpoint presentation slides portfolio pdf. This is a three stage process. The stages in this process are retail shop with pie chart vector icon. This is a completely editable PowerPoint presentation and is available for immediate download. Download now and impress your audience.
Pie Chart Showing Business Statistics Vector Icon Ppt PowerPoint Presentation Infographics Design Ideas PDF
Presenting this set of slides with name pie chart showing business statistics vector icon ppt powerpoint presentation infographics design ideas pdf. This is a three stage process. The stages in this process are pie chart showing business statistics vector icon. This is a completely editable PowerPoint presentation and is available for immediate download. Download now and impress your audience.
Pie Chart With Magnifying Glass Vector Icon Ppt PowerPoint Presentation File Summary PDF
Presenting this set of slides with name pie chart with magnifying glass vector icon ppt powerpoint presentation file summary pdf. This is a three stage process. The stages in this process are pie chart with magnifying glass vector icon. This is a completely editable PowerPoint presentation and is available for immediate download. Download now and impress your audience.
Trading And Investment Business Chart Vector Icon Ppt PowerPoint Presentation Portfolio Visuals PDF
Presenting this set of slides with name trading and investment business chart vector icon ppt powerpoint presentation portfolio visuals pdf. This is a three stage process. The stages in this process are trading and investment business chart vector icon. This is a completely editable PowerPoint presentation and is available for immediate download. Download now and impress your audience.

Data Analysis With Bar Chart In Magnifying Glass Vector Icon Ppt PowerPoint Presentation File Model PDF
Presenting this set of slides with name data analysis with bar chart in magnifying glass vector icon ppt powerpoint presentation file model pdf. This is a one stage process. The stages in this process is data analysis with bar chart in magnifying glass vector icon. This is a completely editable PowerPoint presentation and is available for immediate download. Download now and impress your audience.
Workflow Chart In Magnifying Glass Vector Icon Ppt PowerPoint Presentation Gallery Portfolio PDF
Presenting this set of slides with name workflow chart in magnifying glass vector icon ppt powerpoint presentation gallery portfolio pdf. This is a three stage process. The stages in this process are workflow chart in magnifying glass vector icon. This is a completely editable PowerPoint presentation and is available for immediate download. Download now and impress your audience.
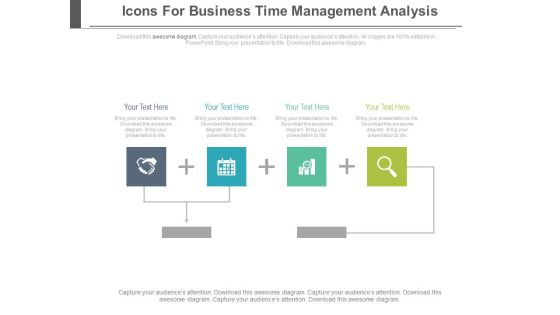
Linear Infographic Compare Chart Powerpoint Slides
This PowerPoint template has been designed with infographic chart. You may download this PPT slide to depict linear flow of steps. Add this slide to your presentation and impress your superiors.

Clustered Combo Chart Ppt PowerPoint Presentation Show
This is a clustered combo chart ppt powerpoint presentation show. This is a eigth stage process. The stages in this process are clustered combo chart, finance, marketing, strategy, investment, business.

Bar Chart Ppt PowerPoint Presentation Slide Download
This is a bar chart ppt powerpoint presentation slide download. This is a three stage process. The stages in this process are chart, in years, unit count, business, marketing.

Combo Chart Ppt PowerPoint Presentation Inspiration Vector
This is a combo chart ppt powerpoint presentation inspiration vector. This is a three stage process. The stages in this process are combo chart, finance, marketing, strategy, analysis, business.
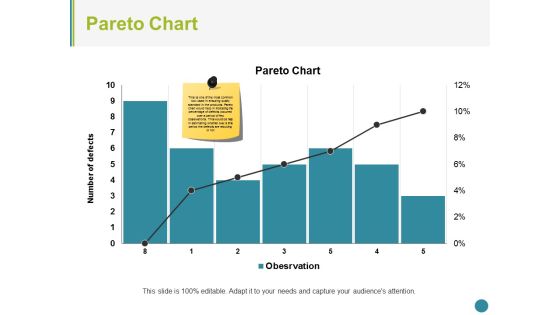
Pareto Chart Ppt PowerPoint Presentation Summary Structure
This is a pareto chart ppt powerpoint presentation summary structure. This is a seven stage process. The stages in this process are pareto chart, finance, marketing, strategy, analysis, business.

Combo Chart Ppt PowerPoint Presentation Infographics Sample
This is a combo chart ppt powerpoint presentation infographics sample. This is a three stage process. The stages in this process are combo chart, finance, analysis, marketing, strategy, business.

Scatter Bubble Chart Ppt PowerPoint Presentation Professional
This is a scatter bubble chart ppt powerpoint presentation professional. This is a three stage process. The stages in this process are scatter bubble chart, product, in price, percentage, business.

Business Target Achievement Hexagon Chart Powerpoint Slides
This PowerPoint template has been designed with graphics of hexagon chart. You may use this PPT slide to display strategy for target achievement. Impress your audiences by using this PPT slide.
Investment Fund Evaluation With Dollar Symbol And Pie Chart Vector Icon Ppt PowerPoint Presentation Icon Files PDF
Presenting this set of slides with name investment fund evaluation with dollar symbol and pie chart vector icon ppt powerpoint presentation icon files pdf. This is a three stage process. The stages in this process are investment fund evaluation with dollar symbol and pie chart vector icon. This is a completely editable PowerPoint presentation and is available for immediate download. Download now and impress your audience.

Competitive Analysis Template 6 Scatter Chart Ppt PowerPoint Presentation Icon Example Topics
This is a competitive analysis template 6 scatter chart ppt powerpoint presentation icon example topics. This is a eight stage process. The stages in this process are users interface, data import, example, pricing, support, update, tutorials, easy to use.

Clustered Bar Chart Yearly Operating Plan Ppt PowerPoint Presentation Styles Icon
This is a clustered bar chart yearly operating plan ppt powerpoint presentation styles icon. This is a four stage process. The stages in this process are business, management, strategy, analysis, marketing.
Gantt Chart For Task Planning And Management Ppt PowerPoint Presentation Icon Mockup
This is a gantt chart for task planning and management ppt powerpoint presentation icon mockup. This is a three stage process. The stages in this process are project management software, project management tools, project management techniques.

Business Trends Bar Chart Vector Icon Ppt PowerPoint Presentation Inspiration Graphic Images PDF
Persuade your audience using this business trends bar chart vector icon ppt powerpoint presentation inspiration graphic images pdf. This PPT design covers three stages, thus making it a great tool to use. It also caters to a variety of topics including business trends bar chart vector icon. Download this PPT design now to present a convincing pitch that not only emphasizes the topic but also showcases your presentation skills.
Pie Chart With Dollar Symbol For Market Share Vector Icon Ppt PowerPoint Presentation File Show PDF
Persuade your audience using this pie chart with dollar symbol for market share vector icon ppt powerpoint presentation file show pdf. This PPT design covers three stages, thus making it a great tool to use. It also caters to a variety of topics including pie chart with dollar symbol for market share vector icon. Download this PPT design now to present a convincing pitch that not only emphasizes the topic but also showcases your presentation skills.
Money Investment Growth Chart Vector Icon Ppt PowerPoint Presentation Slides Influencers PDF
Persuade your audience using this money investment growth chart vector icon ppt powerpoint presentation slides influencers pdf. This PPT design covers three stages, thus making it a great tool to use. It also caters to a variety of topics including money investment growth chart vector icon. Download this PPT design now to present a convincing pitch that not only emphasizes the topic but also showcases your presentation skills.

Business Trend Assessment Chart With Gear Vector Icon Ppt PowerPoint Presentation Styles Vector PDF
Persuade your audience using this business trend assessment chart with gear vector icon ppt powerpoint presentation styles vector pdf. This PPT design covers three stages, thus making it a great tool to use. It also caters to a variety of topics including business trend assessment chart with gear vector icon. Download this PPT design now to present a convincing pitch that not only emphasizes the topic but also showcases your presentation skills.
Three Column Chart With Various Solutions And Icons Ppt PowerPoint Presentation Infographic Template Graphics Design PDF
Pitch your topic with ease and precision using this three column chart with various solutions and icons ppt powerpoint presentation infographic template graphics design pdf. This layout presents information on three column chart with various solutions and icons. It is also available for immediate download and adjustment. So, changes can be made in the color, design, graphics or any other component to create a unique layout.
Statistical Assessment Scatter Chart Icon Ppt PowerPoint Presentation Infographic Template PDF
Persuade your audience using this statistical assessment scatter chart icon ppt powerpoint presentation infographic template pdf. This PPT design covers three stages, thus making it a great tool to use. It also caters to a variety of topics including statistical assessment scatter chart icon. Download this PPT design now to present a convincing pitch that not only emphasizes the topic but also showcases your presentation skills.

Business Stakeholder With Finance Chart Vector Icon Ppt PowerPoint Presentation File Portfolio PDF
Persuade your audience using this business stakeholder with finance chart vector icon ppt powerpoint presentation file portfolio pdf. This PPT design covers one stages, thus making it a great tool to use. It also caters to a variety of topics including business stakeholder with finance chart vector icon. Download this PPT design now to present a convincing pitch that not only emphasizes the topic but also showcases your presentation skills.

Business Economics With Currency Sign And Chart Vector Icon Ppt PowerPoint Presentation Gallery Structure PDF
Persuade your audience using this business economics with currency sign and chart vector icon ppt powerpoint presentation gallery structure pdf. This PPT design covers three stages, thus making it a great tool to use. It also caters to a variety of topics including business economics with currency sign and chart vector icon. Download this PPT design now to present a convincing pitch that not only emphasizes the topic but also showcases your presentation skills.
Economics With Business Growth Chart Vector Icon Ppt PowerPoint Presentation File Rules PDF
Persuade your audience using this economics with business growth chart vector icon ppt powerpoint presentation file rules pdf. This PPT design covers three stages, thus making it a great tool to use. It also caters to a variety of topics including economics with business growth chart vector icon. Download this PPT design now to present a convincing pitch that not only emphasizes the topic but also showcases your presentation skills.
Performance Statistics Chart With Magnifying Glass Vector Icon Ppt Show Shapes PDF
Presenting performance statistics chart with magnifying glass vector icon ppt show shapes pdf to provide visual cues and insights. Share and navigate important information on four stages that need your due attention. This template can be used to pitch topics like performance statistics chart with magnifying glass vector icon. In addition, this PPT design contains high-resolution images, graphics, etc, that are easily editable and available for immediate download.
Manager Analyzing Trends From Financial Modelling Chart Vector Icon Portrait PDF
Persuade your audience using this manager analyzing trends from financial modelling chart vector icon portrait pdf. This PPT design covers three stages, thus making it a great tool to use. It also caters to a variety of topics including manager analyzing trends from financial modelling chart vector icon. Download this PPT design now to present a convincing pitch that not only emphasizes the topic but also showcases your presentation skills.

Accounting Ratio Assessment With Growth Chart Icon Ppt PowerPoint Presentation Show Inspiration PDF
Persuade your audience using this Accounting Ratio Assessment With Growth Chart Icon Ppt PowerPoint Presentation Show Inspiration PDF. This PPT design covers three stages, thus making it a great tool to use. It also caters to a variety of topics including Accounting Ratio, Assessment Growth, Chart Icon. Download this PPT design now to present a convincing pitch that not only emphasizes the topic but also showcases your presentation skills.

5 Years Mutual Funds Performance Comparative Analysis Chart Icon Ppt Show Gridlines PDF
Persuade your audience using this 5 Years Mutual Funds Performance Comparative Analysis Chart Icon Ppt Show Gridlines PDF. This PPT design covers three stages, thus making it a great tool to use. It also caters to a variety of topics including 5 Years, Mutual Funds, Performance Comparative, Analysis, Chart Icon. Download this PPT design now to present a convincing pitch that not only emphasizes the topic but also showcases your presentation skills.

Big Data Business Benefits Pie Charts Ppt PowerPoint Presentation Backgrounds
This is a big data business benefits pie charts ppt powerpoint presentation backgrounds. This is a four stage process. The stages in this process are business, marketing, icons, strategy, management.

Pie Chart Ppt PowerPoint Presentation Template
This is a pie chart ppt powerpoint presentation template. This is a three stage process. The stages in this process are business, strategy, marketing, analysis, finance.

Stock Chart Ppt PowerPoint Presentation Information
This is a stock chart ppt powerpoint presentation information. This is a five stage process. The stages in this process are projects, marketing, high, volume, low.
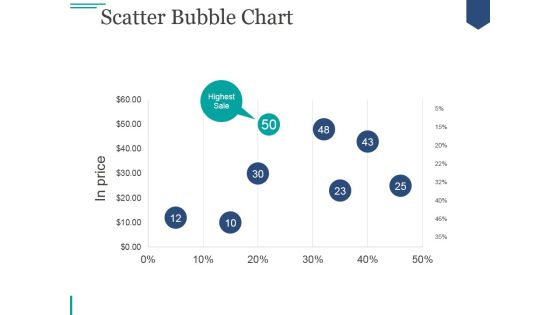
Scatter Bubble Chart Ppt PowerPoint Presentation Ideas
This is a scatter bubble chart ppt powerpoint presentation ideas. This is a five stage process. The stages in this process are highest sale, business, marketing, strategy, price.

Stock Chart Ppt PowerPoint Presentation Professional Maker
This is a stock chart ppt powerpoint presentation professional maker. This is a five stage process. The stages in this process are close, high, volume, low, open.
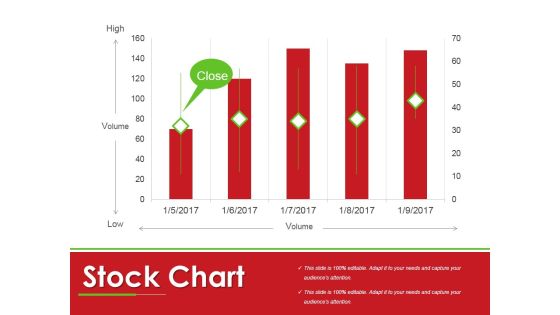
Stock Chart Ppt PowerPoint Presentation Professional Backgrounds
This is a stock chart ppt powerpoint presentation professional backgrounds. This is a five stage process. The stages in this process are business, marketing, graph, management, planning.

Column Chart Ppt PowerPoint Presentation Show Pictures
This is a column chart ppt powerpoint presentation show pictures. This is a six stage process. The stages in this process are business, finance, planning, years, marketing.

Bar Chart Ppt PowerPoint Presentation Model Good
This is a bar chart ppt powerpoint presentation model good. This is a seven stage process. The stages in this process are business, marketing, bar, success, finance.

Bar Chart Ppt PowerPoint Presentation Infographics Skills
This is a bar chart ppt powerpoint presentation infographics skills. This is a seven stage process. The stages in this process are business, marketing, strategy, finance, bar.

Column Chart Ppt PowerPoint Presentation Gallery
This is a column chart ppt powerpoint presentation gallery. This is a six stage process. The stages in this process are business, finance, years, product, graph.

Bar Chart Ppt PowerPoint Presentation Pictures Inspiration
This is a bar chart ppt powerpoint presentation pictures inspiration. This is a seven stage process. The stages in this process are in percentage, business, marketing, finance, graph.

Combo Chart Ppt PowerPoint Presentation Ideas Portrait
This is a combo chart ppt powerpoint presentation ideas portrait. This is a three stage process. The stages in this process are product, business, finance, growth.
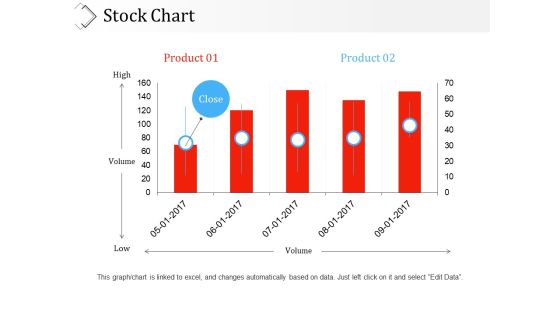
Stock Chart Ppt PowerPoint Presentation Ideas Sample
This is a stock chart ppt powerpoint presentation ideas sample. This is a five stage process. The stages in this process are product, high, low, volume, business.
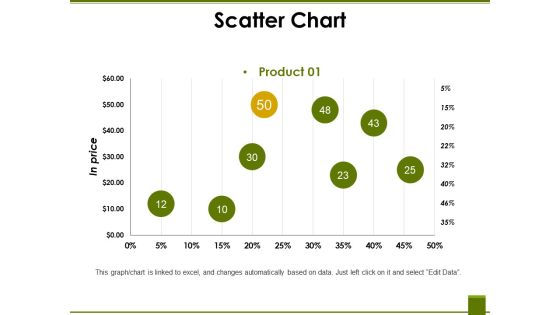
Scatter Chart Ppt PowerPoint Presentation File Display
This is a scatter chart ppt powerpoint presentation file display. This is a eight stage process. The stages in this process are product, business, marketing, finance, in price.
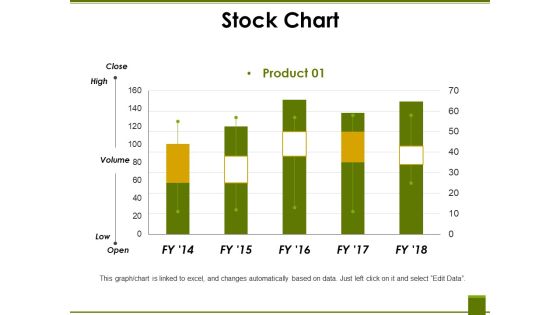
Stock Chart Ppt PowerPoint Presentation Summary Pictures
This is a stock chart ppt powerpoint presentation summary pictures. This is a five stage process. The stages in this process are high, volume, low, product, graph.
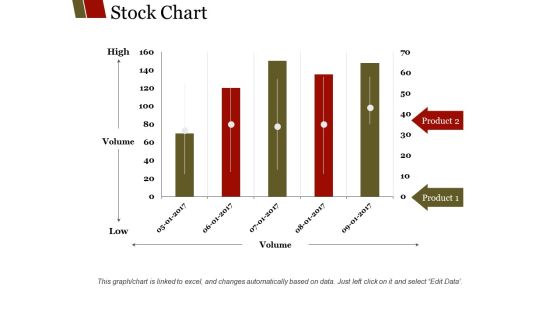
Stock Chart Ppt PowerPoint Presentation Outline Slideshow
This is a stock chart ppt powerpoint presentation outline slideshow. This is a five stage process. The stages in this process are high, volume, low, product, finance.
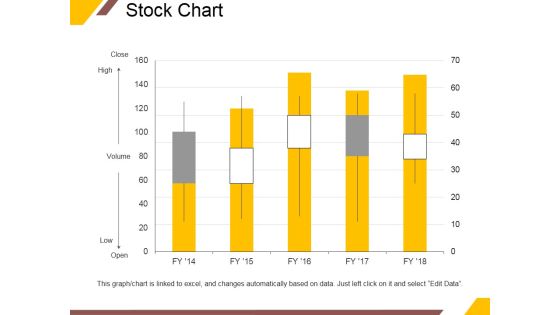
Stock Chart Ppt PowerPoint Presentation Professional Pictures
This is a stock chart ppt powerpoint presentation professional pictures. This is a five stage process. The stages in this process are close, high, volume, low, open.
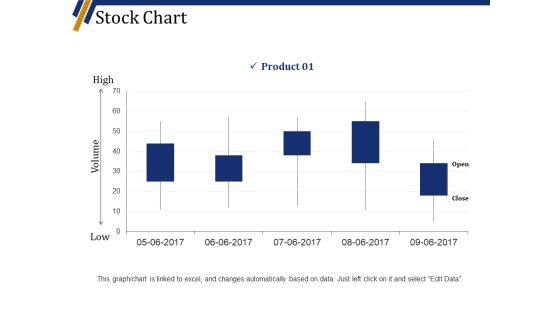
Stock Chart Ppt PowerPoint Presentation Slides Maker
This is a stock chart ppt powerpoint presentation slides maker. This is a five stage process. The stages in this process are high, volume, low, product, business, graph.
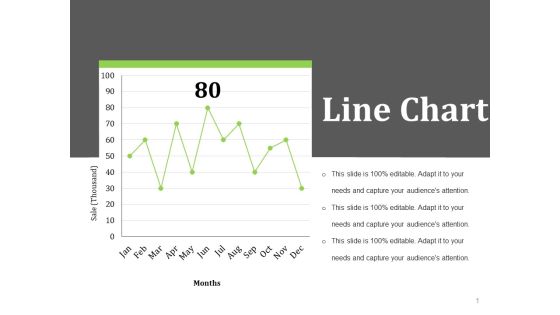
Line Chart Ppt PowerPoint Presentation Slides Template
This is a line chart ppt powerpoint presentation slides template. This is a one stage process. The stages in this process are months, sale thousand, business, marketing, finance.

Pie Chart Ppt PowerPoint Presentation Layouts Topics
This is a pie chart ppt powerpoint presentation layouts topics. This is a three stage process. The stages in this process are pie, process, percentage, finance, business.
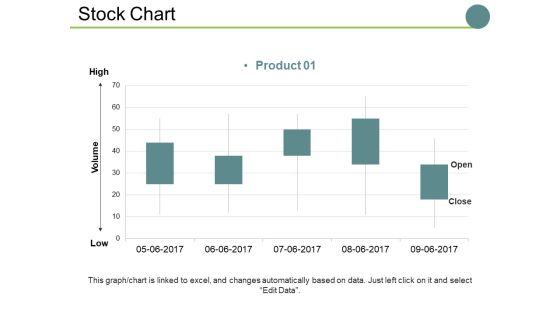
Stock Chart Ppt PowerPoint Presentation Show Sample
This is a stock chart ppt powerpoint presentation show sample. This is a one stage process. The stages in this process are high, volume, low, business, graph, marketing.

Bubble Chart Ppt PowerPoint Presentation Show Graphics
This is a bubble chart ppt powerpoint presentation show graphics. This is a four stage process. The stages in this process are business, marketing, graph, finance, strategy.
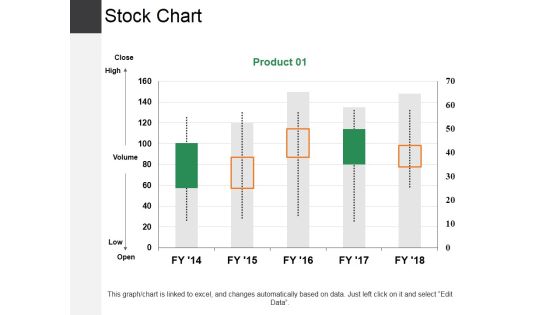
Stock Chart Ppt PowerPoint Presentation Slides Outline
This is a stock chart ppt powerpoint presentation slides outline. This is a one stage process. The stages in this process are high, low, business, marketing, graph.

Stock Chart Ppt PowerPoint Presentation Show Backgrounds
This is a stock chart ppt powerpoint presentation show backgrounds. This is a one stage process. The stages in this process are high, volume, low, business, marketing.

Column Chart Ppt PowerPoint Presentation Show Model
This is a column chart ppt powerpoint presentation show model. This is a six stage process. The stages in this process are business, marketing, bar, planning, strategy.
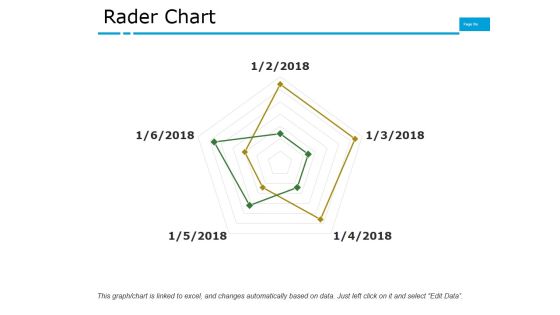
Rader Chart Ppt PowerPoint Presentation Professional Display
This is a rader chart ppt powerpoint presentation professional display. This is a five stage process. The stages in this process are business, marketing, finance, strategy, planning.
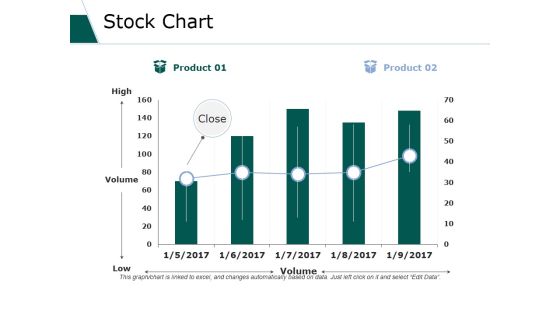
Stock Chart Ppt PowerPoint Presentation Layouts Professional
This is a stock chart ppt powerpoint presentation layouts professional. This is a five stage process. The stages in this process are business, marketing, strategy, planning, finance.
 Home
Home