2 Phases
Environmental Analysis For Strategy Formulation And Implementation Ppt PowerPoint Presentation Inspiration Icons
This is a environmental analysis for strategy formulation and implementation ppt powerpoint presentation inspiration icons. This is a three stage process. The stages in this process are environmental scan, environmental study, environmental examine.
Environmental Planning And Research Vector Icon Ppt PowerPoint Presentation Inspiration Example
This is a environmental planning and research vector icon ppt powerpoint presentation inspiration example. This is a four stage process. The stages in this process are environmental scan, environmental study, environmental examine.
Functional Framework Application Development Operational Management Ppt Powerpoint Presentation Styles Icon
This is a functional framework application development operational management ppt powerpoint presentation styles icon. This is a four stage process. The stages in this process are functional architecture, functional planning, functional designing.
Members List With Name Delegation And Mentor Name Ppt Powerpoint Presentation Icon Show
This is a members list with name delegation and mentor name ppt powerpoint presentation icon show. This is a six stage process. The stages in this process are list of participants, list of members, list of contributors.
Data Research And Analysis For Mobile Users Ppt PowerPoint Presentation Icon Inspiration
This is a data research and analysis for mobile users ppt powerpoint presentation icon inspiration. This is a four stage process. The stages in this process are mobile analytics, mobile tracking, mobile web analytics.
Disruption Enablers Technology Business Value Government Ppt Powerpoint Presentation Icon Templates
This is a disruption enablers technology business value government ppt powerpoint presentation icon templates. This is a four stage process. The stages in this process are innovation, disruptive innovation, disruptive technology.
Staff Management Plan Department Branch And Status Ppt PowerPoint Presentation Icon Slides
This is a staff management plan department branch and status ppt powerpoint presentation icon slides. This is a seven stage process. The stages in this process are employee information system, staff management system.
Agenda Points With Icons Integrated Approach And Better Regulation Ppt PowerPoint Presentation Layouts Example Topics
This is a agenda points with icons integrated approach and better regulation ppt powerpoint presentation layouts example topics. This is a eight stage process. The stages in this process are agenda infographics, meeting activities infographics, list of items infographics.
Falling Money Raining Cash Under Umbrella Ppt PowerPoint Presentation Icon Inspiration
This is a falling money raining cash under umbrella ppt powerpoint presentation icon inspiration. This is a four stage process. The stages in this process are raining money, raining currency, raining dollar.
Quarterly Financial Report With Expenses And Gross Profit Ppt PowerPoint Presentation Ideas Icons
This is a quarterly financial report with expenses and gross profit ppt powerpoint presentation ideas icons. This is a five stage process. The stages in this process are accounting review, accounting report, accounting statement.
Spinning Wheel With Dollar Sign Vector Icon Ppt PowerPoint Presentation Portfolio Deck Cpb
This is a spinning wheel with dollar sign vector icon ppt powerpoint presentation portfolio deck cpb. This is a four stage process. The stages in this process are wheel of fortune, american game, wheel watchers.
Investment Savings Financial Management Vector Icon Ppt Powerpoint Presentation Infographics Layouts
This is a investment savings financial management vector icon ppt powerpoint presentation infographics layouts. This is a one stage process. The stages in this process are earn money, earn cash, earn funds.
Make Money Piles Of Coins Image Ppt Powerpoint Presentation Icon Outline
This is a make money piles of coins image ppt powerpoint presentation icon outline. This is a one stage process. The stages in this process are earn money, earn cash, earn funds.
KPI Dashboard With Pen Vector Icon Ppt PowerPoint Presentation Professional Infographics PDF
Persuade your audience using this kpi dashboard with pen vector icon ppt powerpoint presentation professional infographics pdf. This PPT design covers three stages, thus making it a great tool to use. It also caters to a variety of topics including kpi dashboard with pen vector icon. Download this PPT design now to present a convincing pitch that not only emphasizes the topic but also showcases your presentation skills.

Four Steps For Organizational Learning Methods Powerpoint Slides
Four text boxes have been displayed in this business slide. This PowerPoint template helps to exhibit organizational learning methods. Use this diagram slide to build an exclusive presentation.
Students Sitting In Classroom Vector Icon Ppt PowerPoint Presentation Styles Outfit
Presenting this set of slides with name students sitting in classroom vector icon ppt powerpoint presentation styles outfit. This is a one process. The stages in this process are Classroom, Management, Strategy, Planning, Business. This is a completely editable PowerPoint presentation and is available for immediate download. Download now and impress your audience.

Table For Total Sales Analysis Powerpoint Slides
This PowerPoint template has been designed with four steps table chart. Use this PPT slide to display total sales analysis. Download this template to leave permanent impression on your audience.

Column Chart Ppt PowerPoint Presentation Summary Icon
This is a column chart ppt powerpoint presentation summary icon. This is a two stage process. The stages in this process are column chart, dollars, product.

Dollar And Percentage Sign On Scale Ppt PowerPoint Presentation Inspiration Guidelines
This is a dollar and percentage sign on scale ppt powerpoint presentation inspiration guidelines. This is a three stage process. The stages in this process are percentage icon, dividend icon, portion icon.

Percentage Symbol With Text Holders Ppt PowerPoint Presentation Example 2015
This is a percentage symbol with text holders ppt powerpoint presentation example 2015. This is a three stage process. The stages in this process are percentage icon, dividend icon, portion icon.
White Percentage Sign In Green Circle Ppt PowerPoint Presentation Outline Templates
This is a white percentage sign in green circle ppt powerpoint presentation outline templates. This is a three stage process. The stages in this process are percentage icon, dividend icon, portion icon.

Green Red Right Wrong Signs With Checklist Ppt Powerpoint Presentation Summary Files
This is a green red right wrong signs with checklist ppt powerpoint presentation summary files. This is a six stage process. The stages in this process are correct incorrect icon, dos and do not icon, right and wrong icon.
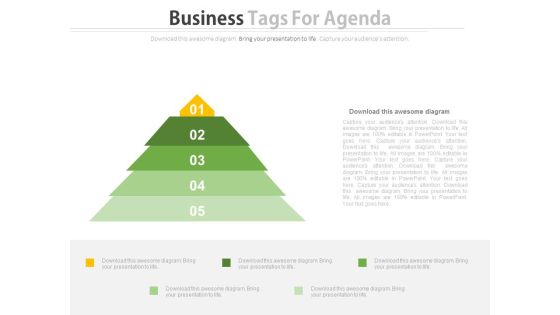
Triangle Of Five Business Steps Powerpoint Slides
This PowerPoint template has been designed with five steps triangle diagram. This PPT slide can be used to display five points of marketing agenda. You can download finance PowerPoint template to prepare awesome presentations.
Line Chart Ppt PowerPoint Presentation Ideas Icon
This is a line chart ppt powerpoint presentation ideas icon. This is a two stage process. The stages in this process are profit, product, line chart.
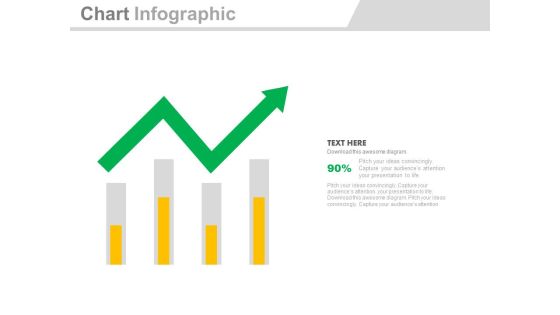
Four Bars With Green Growth Arrow Powerpoint Slides
Four bars with green arrow have been displayed in this business slide. This business diagram helps to exhibit process of business planning. Use this diagram to build an exclusive presentation.
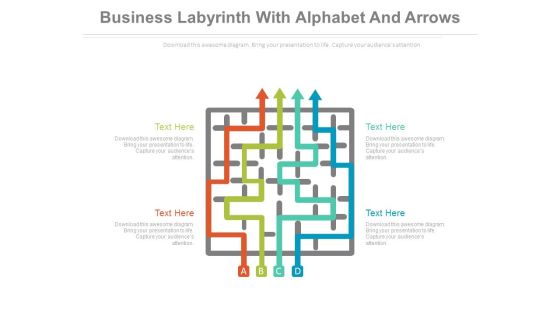
Maze With Alphabets And Arrows For Solution Powerpoint Template
Our above business diagram has been designed with maze diagram. This slide is suitable to present concept of strategic process management. This template offers an excellent background to build impressive presentation.

Bar Graph For Profit Growth Analysis Powerpoint Slides
This PowerPoint template has been designed with bar graph with percentage values. This diagram is useful to exhibit profit growth analysis. This diagram slide can be used to make impressive presentations.

Bar Graph For Yearly Statistical Analysis Powerpoint Slides
This PowerPoint template has been designed with bar graph. This PowerPoint diagram is useful to exhibit yearly statistical analysis. This diagram slide can be used to make impressive presentations.
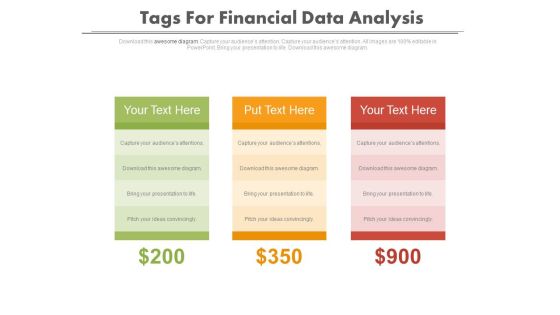
Tags For Financial Data Comparison Powerpoint Slides
Graphic of three text tag with dollar values has been used to design this power point template. This diagram may be used for financial data comparison. Use this diagram to build a professional presentation.

Bar Graph For Data Distribution And Analysis Powerpoint Slides
This PowerPoint template has been designed with bar graph. This PowerPoint diagram is useful for data distribution and analysis This diagram slide can be used to make impressive presentations.

Financial Reporting Manager With Data Powerpoint Slides
This PowerPoint template has been designed with graphics of finance manager and percentage data. This diagram is useful to exhibit financial management. This diagram slide can be used to make impressive presentations.
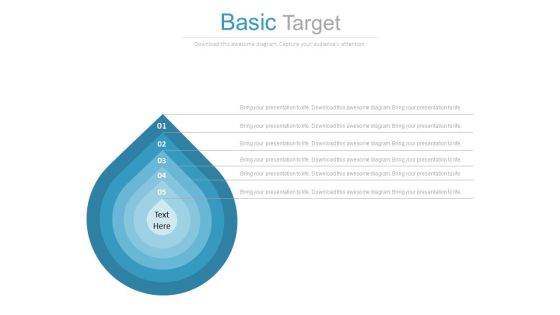
Five Steps Concentric Drops For Target Planning Powerpoint Slides
This PowerPoint template has been designed with graphics of concentric steps in water drop shape. Download this PPT slide to define and achieve goals with more success. This diagram may be used for goal planning related topics.

Area Chart Ppt PowerPoint Presentation Icon Good
This is a area chart ppt powerpoint presentation icon good. This is a two stage process. The stages in this process are business, marketing, growth, planning, strategy.

Twitter Google Plus Facebook Social Media Powerpoint Slides
This professional slide contains graphics of Twitter, Google plus and Face book social media logos. You may use this chart for comparison of social media sites. Add this slide to your presentation and impress your superiors.

Bar Graph For Statistical Analysis Powerpoint Slides
This PowerPoint template has been designed with bar chart and percentage values. You may download this PPT slide to depict statistical analysis. Add this slide to your presentation and impress your superiors.

Dashboard With Increasing Values Powerpoint Slides
This innovative, stunningly beautiful dashboard has been designed for data visualization. It contains pie charts with increasing percentage values. This PowerPoint template helps to display your information in a useful, simple and uncluttered way.
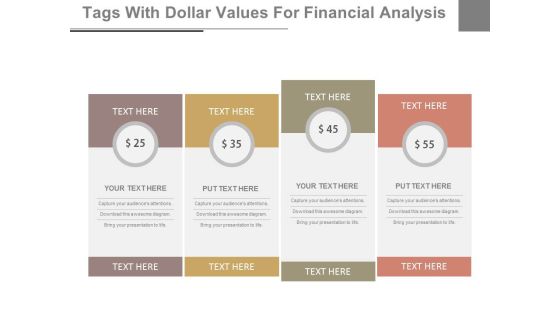
Dollar Value Pricing Table Powerpoint Slides
This PowerPoint template has been designed with dollar value pricing table chart. This PPT slide may be used for sample marketing proposal. Download this slide to build unique presentation.
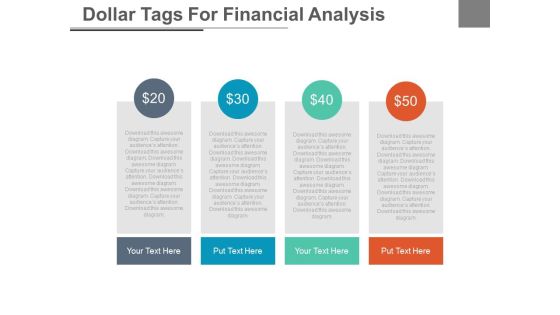
Four Tags With Dollar Values For Financial Analysis Powerpoint Slides
This PowerPoint template has been designed with dollar value pricing table chart. This PPT slide may be used for sample marketing proposal. Download this slide to build unique presentation.
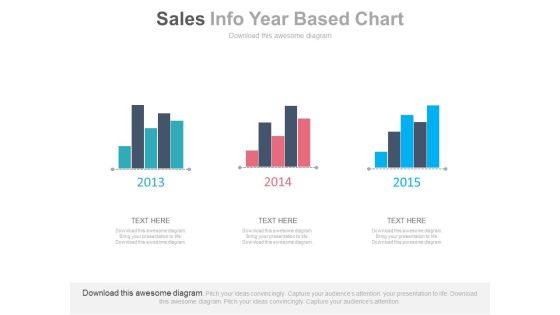
Three Years Sales Data Bar Graph Powerpoint Slides
This PowerPoint template has been designed with bar charts. This business slide may be used to display three years sales data for comparison. Present your views and ideas with this impressive design.
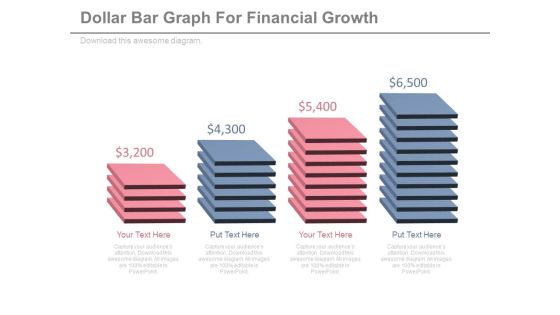
Illustration Of Dollar Value Slabs Powerpoint Slides
Pricing slabs have been displayed in this business slide. This PowerPoint template helps to exhibit financial growth process. Use this diagram slide to build an exclusive presentation.
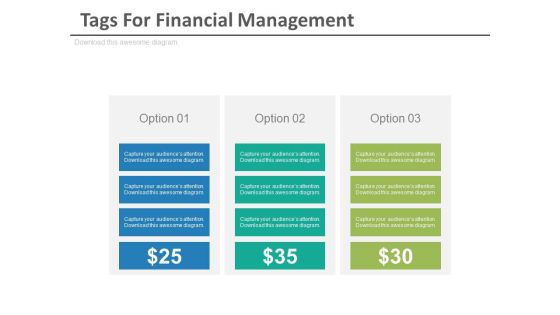
Three Options Tags For Financial Management Powerpoint Slides
Create dynamic presentations with our professional template containing three options tags. Use this diagram to exhibit financial management. Download this template to leave permanent impression on your audience.

Urban Development Tall Buildings Ppt PowerPoint Presentation Summary Deck
Presenting this set of slides with name urban development tall buildings ppt powerpoint presentation summary deck. This is a three stage process. The stages in this process are infrastructure icon, organizational structures icon, physical systems icon. This is a completely editable PowerPoint presentation and is available for immediate download. Download now and impress your audience.

About Us Ppt PowerPoint Presentation Styles Graphics
This is a about us ppt powerpoint presentation styles graphics. This is a three stage process. The stages in this process are about us, business, management, icons.

Financial Ppt PowerPoint Presentation Gallery Slides
This is a financial ppt powerpoint presentation gallery slides. This is a three stage process. The stages in this process are dollar, business, finance, marketing, icons.

Modes Of Finance Ppt PowerPoint Presentation Gallery Designs
This is a modes of finance ppt powerpoint presentation gallery designs. This is a four stage process. The stages in this process are business, finance, marketing, icons, strategy.
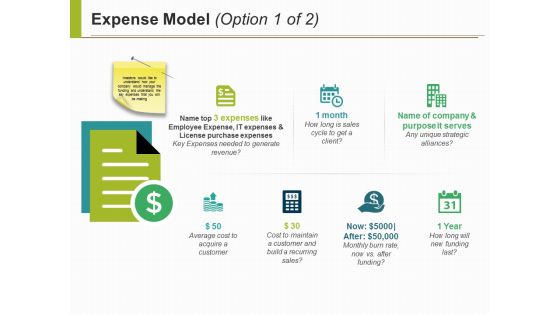
Expense Model Ppt PowerPoint Presentation Slides Ideas
This is a expense model ppt powerpoint presentation slides ideas. This is a seven stage process. The stages in this process are icons, marketing, strategy, finance, planning.
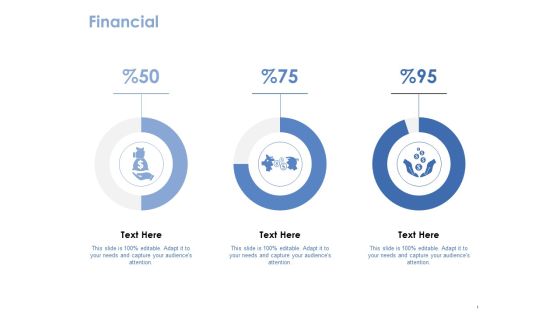
Financial Template 1 Ppt PowerPoint Presentation Pictures Files
This is a financial template 1 ppt powerpoint presentation pictures files. This is a three stage process. The stages in this process are business, finance, marketing, icons, strategy.
Post It Ppt PowerPoint Presentation Pictures Introduction
This is a post it ppt powerpoint presentation pictures introduction. This is a four stage process. The stages in this process are business, management, post it, icons, strategy.

Template 4 Ppt PowerPoint Presentation Infographic Template Images
This is a template 4 ppt powerpoint presentation infographic template images. This is a four stage process. The stages in this process are business, finance, marketing, icons, strategy.

Finance Talent Mapping Ppt PowerPoint Presentation Portfolio Template
This is a finance talent mapping ppt powerpoint presentation portfolio template. This is a three stage process. The stages in this process are business, management, strategy, finance, icons.

Bar Graph For Marketing Research Data Powerpoint Slides
This PowerPoint template has been designed with diagram of bar graph. This PPT slide can be used to prepare presentations for profit growth report and also for financial data analysis. You can download finance PowerPoint template to prepare awesome presentations.

Bar Graph For Marketing Research Process Powerpoint Slides
This PowerPoint template has been designed with diagram of bar graph. This PPT slide can be used to prepare presentations for profit growth report and also for financial data analysis. You can download finance PowerPoint template to prepare awesome presentations.
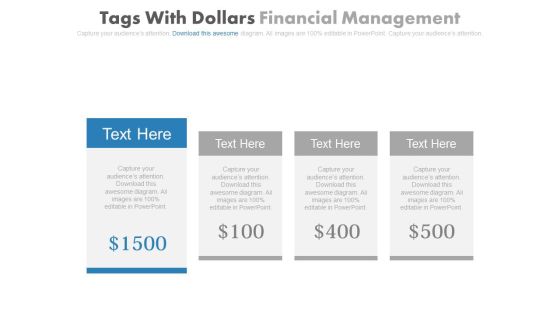
Four Dollar Tags For Corporate Entrepreneurship Powerpoint Slides
This PowerPoint template has been designed with diagram of four text tags with dollar price. This PPT slide can be used to prepare presentations for personal finances and tax planning. You can download finance PowerPoint template to prepare awesome presentations.

Bar Graph For Year Based Analysis Powerpoint Slides
This PowerPoint template has been designed with year based bar graph. This diagram may be used to display yearly statistical analysis. Use this PPT slide design to make impressive presentations.

Four Tags For Financial Review And Analysis Powerpoint Slides
This PowerPoint template has been designed with four tags and financial values. This PowerPoint template helps to exhibit financial review and analysis. Use this diagram slide to build an exclusive presentation.

Parameters Of Growth And Development Powerpoint Slides
Dashboard design has been displayed in this business slide. This business diagram helps to exhibit parameters of growth and development. Download this PowerPoint template to build an exclusive presentation.
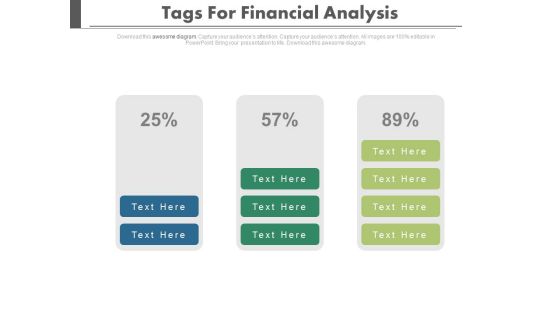
Three Stages Of Financial Growth Powerpoint Slides
Three stages of financial growth have been displayed in this power point template. This diagram helps to portray the concept of financial planning and analysis. Download this template to leave permanent impression on your audience.

Bar Graph With Increasing Percentage Flow Powerpoint Slides
This PowerPoint slide has been designed with bar graph and increasing percentage values. This diagram slide may be used to display profit growth. Prove the viability of your ideas with this professional slide.

Board With Bar Graph For Financial Analysis Powerpoint Slides
You can download this PowerPoint template to display statistical data and analysis. This PPT slide contains display board with bar graph. Draw an innovative business idea using this professional diagram.
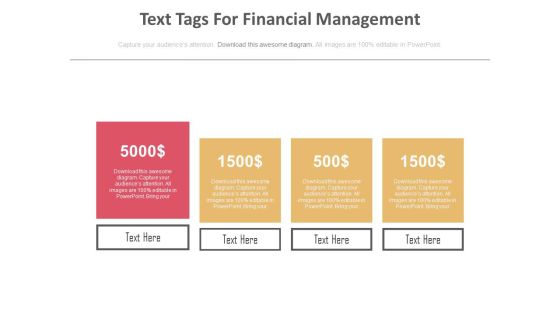
Four Text Tags For Financial Management Powerpoint Slides
Our professionally designed business diagram is as an effective tool for communicating concept of financial management. It contains graphics of four text tags. Above slide is also suitable to display financial planning and strategy.
 Home
Home