 AI PPT Maker
 Templates
 PPT Bundles
 Design Services
 Business PPTs
 Business Plan
 Management
 Strategy
 Introduction PPT
 Roadmap
 Self Introduction
 Timelines
 Process
 Marketing
 Agenda
 Technology
 Medical
 Startup Business Plan
 Cyber Security
 Dashboards
 SWOT
SWOT Proposals
 Education
 Pitch Deck
 Digital Marketing
 KPIs
KPIs Project Management
 Product Management
 Artificial Intelligence
 Target Market
 Communication
 Supply Chain
 Google Slides
 Research Services
 One Pagers
 All Categories
Visualization research implementation PowerPoint Presentation Templates and Google Slides
6 Item(s)


This slide depicts the dashboard for sales performance after the implementation of visualization research based on revenue, quantity, regional sales. Welcome to our selection of the Sales Performance Dashboard After Visualization Research Implementation Introduction PDF. These are designed to help you showcase your creativity and bring your sphere to life. Planning and Innovation are essential for any business that is just starting out. This collection contains the designs that you need for your everyday presentations. All of our PowerPoints are 100 percent editable, so you can customize them to suit your needs. This multi purpose template can be used in various situations. Grab these presentation templates today.


Retrieve professionally designed 30 60 90 Days Plan For Visualization Research Implementation Ppt Professional Show PDF to effectively convey your message and captivate your listeners. Save time by selecting pre-made slideshows that are appropriate for various topics, from business to educational purposes. These themes come in many different styles, from creative to corporate, and all of them are easily adjustable and can be edited quickly. Access them as PowerPoint templates or as Google Slides themes. You dont have to go on a hunt for the perfect presentation because Slidegeeks got you covered from everywhere.


This slide explains the roadmap for implementing visualization research in the company, including understanding and collecting the data, categorizing it, analyzing and visualizing the data. This Roadmap For Visualization Research Implementation In Company Ppt Inspiration Summary PDF from Slidegeeks makes it easy to present information on your topic with precision. It provides customization options, so you can make changes to the colors, design, graphics, or any other component to create a unique layout. It is also available for immediate download, so you can begin using it right away. Slidegeeks has done good research to ensure that you have everything you need to make your presentation stand out. Make a name out there for a brilliant performance.


This slide explains the roadmap for implementing visualization research in the company, including understanding and collecting the data, categorizing it, analyzing and visualizing the data. This Roadmap For Visualization Research Implementation In Company Background PDF is perfect for any presentation, be it in front of clients or colleagues. It is a versatile and stylish solution for organizing your meetings. The product features a modern design for your presentation meetings. The adjustable and customizable slides provide unlimited possibilities for acing up your presentation. Slidegeeks has done all the homework before launching the product for you. So, do not wait, grab the presentation templates today.


This slide shows the 30 60 90 days plan for visualization research, such as knowing and sorting the data, analyzing the information, and different tools required. If you are looking for a format to display your unique thoughts, then the professionally designed 30 60 90 Days Plan For Visualization Research Implementation Themes PDF is the one for you. You can use it as a Google Slides template or a PowerPoint template. Incorporate impressive visuals, symbols, images, and other charts. Modify or reorganize the text boxes as you desire. Experiment with shade schemes and font pairings. Alter, share or cooperate with other people on your work. Download 30 60 90 Days Plan For Visualization Research Implementation Themes PDF and find out how to give a successful presentation. Present a perfect display to your team and make your presentation unforgettable.
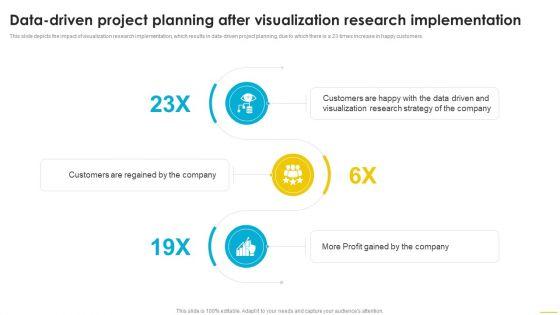


This slide depicts the impact of visualization research implementation, which results in data-driven project planning, due to which there is a 23 times increase in happy customers. Want to ace your presentation in front of a live audience Our Data Driven Project Planning After Visualization Research Implementation Diagrams PDF can help you do that by engaging all the users towards you. Slidegeeks experts have put their efforts and expertise into creating these impeccable powerpoint presentations so that you can communicate your ideas clearly. Moreover, all the templates are customizable, and easy to edit and downloadable. Use these for both personal and commercial use.
6 Item(s)