 AI PPT Maker
 Templates
 PPT Bundles
 Design Services
 Business PPTs
 Business Plan
 Management
 Strategy
 Introduction PPT
 Roadmap
 Self Introduction
 Timelines
 Process
 Marketing
 Agenda
 Technology
 Medical
 Startup Business Plan
 Cyber Security
 Dashboards
 SWOT
SWOT Proposals
 Education
 Pitch Deck
 Digital Marketing
 KPIs
KPIs Project Management
 Product Management
 Artificial Intelligence
 Target Market
 Communication
 Supply Chain
 Google Slides
 Research Services
 One Pagers
 All Categories
Visual performance PowerPoint Presentation Templates and Google Slides
SHOW
- 60
- 120
- 180
DISPLAYING: 60 of 127 Item(s)
Page


Looking for a predesigned Corporate Performance Report Visual First Summary One Pager Documents. Here is the perfect piece for you It has everything that a well-structured Annual Report PowerPoint Deck should have. Besides, it is 100 percent editable, which offers you the cushion to make adjustments according to your preferences. Grab this Corporate Performance Report Visual First Summary One Pager Documents A4 One-pager now.


This managing solutions performing visual ppt powerpoint presentation complete deck with slides acts as backup support for your ideas, vision, thoughts, etc. Use it to present a thorough understanding of the topic. This PPT slideshow can be utilized for both in-house and outside presentations depending upon your needs and business demands. Entailing twelve slides with a consistent design and theme, this template will make a solid use case. As it is intuitively designed, it suits every business vertical and industry. All you have to do is make a few tweaks in the content or any other component to design unique presentations. The biggest advantage of this complete deck is that it can be personalized multiple times once downloaded. The color, design, shapes, and other elements are free to modify to add personal touches. You can also insert your logo design in this PPT layout. Therefore a well-thought and crafted presentation can be delivered with ease and precision by downloading this managing solutions performing visual ppt powerpoint presentation complete deck with slides PPT slideshow.


Presenting this set of slides with name marketing dashboard for visualizing performance ppt powerpoint presentation summary slide download. The topics discussed in these slides are financial targets, financial goals, growth profitability. This is a completely editable PowerPoint presentation and is available for immediate download. Download now and impress your audience.


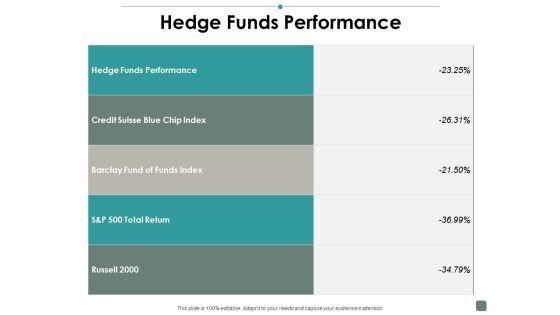
Presenting this set of slides with name performance benchmarks cont analysis ppt powerpoint presentation inspiration visual aids. The topics discussed in these slides are finance, marketing, management, investment, analysis. This is a completely editable PowerPoint presentation and is available for immediate download. Download now and impress your audience.


Presenting this set of slides with name sales performance marketing ppt powerpoint presentation professional visuals. The topics discussed in these slides are finance, marketing, management, investment, analysis. This is a completely editable PowerPoint presentation and is available for immediate download. Download now and impress your audience.


Presenting this set of slides with name metrics to measure brand performance quantitative and qualitative research ppt powerpoint presentation styles visuals. The topics discussed in these slides are brand tracking, brand awareness research, brand equity. This is a completely editable PowerPoint presentation and is available for immediate download. Download now and impress your audience.

Presenting this set of slides with name assess employee performance ppt powerpoint presentation visual aids ideas cpb. This is an editable Powerpoint five stages graphic that deals with topics like assess employee performance to help convey your message better graphically. This product is a premium product available for immediate download and is 100 percent editable in Powerpoint. Download this now and use it in your presentations to impress your audience.


Presenting this set of slides with name work performance data ppt powerpoint presentation show visual aids cpb. This is an editable Powerpoint three stages graphic that deals with topics like work performance data to help convey your message better graphically. This product is a premium product available for immediate download and is 100 percent editable in Powerpoint. Download this now and use it in your presentations to impress your audience.


Presenting this set of slides with name high performance display ads ppt powerpoint presentation visual aids background images cpb. This is a three stage process. The stages in this process are high performance display ads. This is a completely editable PowerPoint presentation and is available for immediate download. Download now and impress your audience.


This slide showcases dashboard to review business activities strategically for continual growth in company revenue and profits. It further includes KPIs such as sales, new consumers, actual and targets met, etc. Showcasing this set of slides titled Organization Performance Strategic Evaluation Dashboard Ppt Slides Visual Aids PDF. The topics addressed in these templates are Average Revenue Per Unit, Customer Lifetime Value, Customer Acquisition Cost. All the content presented in this PPT design is completely editable. Download it and make adjustments in color, background, font etc. as per your unique business setting.


Presenting you a fantastic Table Of Contents For Corporate Performance Report Visual First Summary One Pager Documents. This piece is crafted on hours of research and professional design efforts to ensure you have the best resource. It is completely editable and its design allow you to rehash its elements to suit your needs. Get this Table Of Contents For Corporate Performance Report Visual First Summary One Pager Documents A4 One-pager now.


This one page shows the information related to the corporate company report mobile first presentation which includes company details, message from the CEO, core values, objectives, financial results, mobile app strategy, etc. Presenting you an exemplary One Page Summary Corporate Performance Report Visual First Summary One Pager Documents. Our one-pager comprises all the must-have essentials of an inclusive document. You can edit it with ease, as its layout is completely editable. With such freedom, you can tweak its design and other elements to your requirements. Download this One Page Summary Corporate Performance Report Visual First Summary One Pager Documents brilliant piece now.
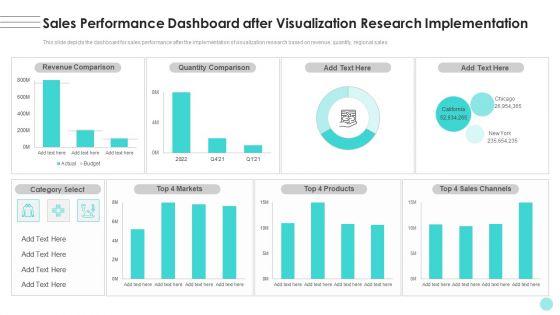

This slide depicts the dashboard for sales performance after the implementation of visualization research based on revenue, quantity, regional sales. Crafting an eye-catching presentation has never been more straightforward. Let your presentation shine with this tasteful yet straightforward Branches For Visualization Research And Development Sales Performance Dashboard After Infographics PDF template. It offers a minimalistic and classy look that is great for making a statement. The colors have been employed intelligently to add a bit of playfulness while still remaining professional. Construct the ideal Branches For Visualization Research And Development Sales Performance Dashboard After Infographics PDF that effortlessly grabs the attention of your audience Begin now and be certain to wow your customers.


This slide provides information regarding checklist utilized by firm in order to maintain visual identity of brand. The checklist tracks logo that highlights brand personality, colors to build flexible palette, typography that act as logo extension, etc. Make sure to capture your audiences attention in your business displays with our gratis customizable Instructions For Brand Performance Management Team Checklist To Track Visual Identity Building Infographics PDF. These are great for business strategies, office conferences, capital raising or task suggestions. If you desire to acquire more customers for your tech business and ensure they stay satisfied, create your own sales presentation with these plain slides.


This slide depicts the dashboard for sales performance after the implementation of visualization research based on revenue, quantity, regional sales. Welcome to our selection of the Sales Performance Dashboard After Visualization Research Implementation Introduction PDF. These are designed to help you showcase your creativity and bring your sphere to life. Planning and Innovation are essential for any business that is just starting out. This collection contains the designs that you need for your everyday presentations. All of our PowerPoints are 100 percent editable, so you can customize them to suit your needs. This multi purpose template can be used in various situations. Grab these presentation templates today.


This slide covers customer referral program performance evaluating dashboard. It involves participation rate by referrals, number of referred customers, conversion rate and total revenue generated. Pitch your topic with ease and precision using this Customer Client Referral Program Performance Dashboard Ppt File Visual Aids PDF. This layout presents information on Participation Rate Referrals, Number Referred Customers, Referral Conversion Rate. It is also available for immediate download and adjustment. So, changes can be made in the color, design, graphics or any other component to create a unique layout.


This graph or chart is linked to excel, and changes automatically based on data. Just left click on it and select Edit Data. Pitch your topic with ease and precision using this Firm KPI Dashboard With Schedule Performance Index Ppt Visual Aids PDF. This layout presents information on Project Cost Performance, Project Planning Stage, Monitor And Control. It is also available for immediate download and adjustment. So, changes can be made in the color, design, graphics or any other component to create a unique layout.


This slide depicts the dashboard for sales performance after the implementation of visualization research based on revenue, quantity, regional sales.Deliver an awe inspiring pitch with this creative Departments Of Visualization Research Sales Performance Dashboard After Visualization Sample PDF bundle. Topics like Revenue Comparison, Quantity Comparison, Category Select can be discussed with this completely editable template. It is available for immediate download depending on the needs and requirements of the user.
Persuade your audience using this managing time technology for performance measurement icon ppt powerpoint presentation file visuals pdf. This PPT design covers three stages, thus making it a great tool to use. It also caters to a variety of topics including managing time technology for performance measurement icon. Download this PPT design now to present a convincing pitch that not only emphasizes the topic but also showcases your presentation skills.

This slide represents the working of the Rational Unified Process Model , including phases, iterations, disciplines, workflows, roles, activities, and artifacts. Presenting rup model how rational unified process model works performs ppt visual aids backgrounds pdf to provide visual cues and insights. Share and navigate important information on one stages that need your due attention. This template can be used to pitch topics like iteration, model element, references, performs. In addtion, this PPT design contains high resolution images, graphics, etc, that are easily editable and available for immediate download.
SHOW
- 60
- 120
- 180
DISPLAYING: 60 of 127 Item(s)
Page