 AI PPT Maker
 Templates
 PPT Bundles
 Design Services
 Business PPTs
 Business Plan
 Management
 Strategy
 Introduction PPT
 Roadmap
 Self Introduction
 Timelines
 Process
 Marketing
 Agenda
 Technology
 Medical
 Startup Business Plan
 Cyber Security
 Dashboards
 SWOT
SWOT Proposals
 Education
 Pitch Deck
 Digital Marketing
 KPIs
KPIs Project Management
 Product Management
 Artificial Intelligence
 Target Market
 Communication
 Supply Chain
 Google Slides
 Research Services
 One Pagers
 All Categories
Visual dashboards PowerPoint Presentation Templates and Google Slides
SHOW
- 60
- 120
- 180
DISPLAYING: 60 of 92 Item(s)
Page


This is a visual mining dashboard analysis ppt example. This is a seven stage process. The stages in this process are data sources, preprocess data, data warehouse or mapping scheme, machining learning, statistics and others, analysis reviews outputs, revise refine queries, report finding, interpret result, take action based on findings.


Presenting this set of slides with name marketing dashboard for visualizing performance ppt powerpoint presentation summary slide download. The topics discussed in these slides are financial targets, financial goals, growth profitability. This is a completely editable PowerPoint presentation and is available for immediate download. Download now and impress your audience.


Presenting this set of slides with name dashboard meausrement ppt powerpoint presentation portfolio visual aids. This is a stage process. The stages in this process are dashboard, marketing, management, investment, analysis. This is a completely editable PowerPoint presentation and is available for immediate download. Download now and impress your audience.


Presenting this set of slides with name display advertising dashboard ppt powerpoint presentation file visual aids. The topics discussed in these slides are finance, marketing, management, investment, analysis. This is a completely editable PowerPoint presentation and is available for immediate download. Download now and impress your audience.


This is a portfolio management dashboard ppt powerpoint presentation summary visual aids. The topics discussed in this diagram are portfolio management dashboard, management, marketing, business, strategy. This is a completely editable PowerPoint presentation, and is available for immediate download.


Presenting this set of slides with name statistics dashboard vector icon ppt powerpoint presentation pictures visual aids. This is a one stage process. The stages in this process are data visualization icon, research analysis, business focus. This is a completely editable PowerPoint presentation and is available for immediate download. Download now and impress your audience.


Presenting this set of slides with name seo dashboard funnel metrics ppt powerpoint presentation visual aids layouts cpb. This is a six stage process. The stages in this process are seo dashboard funnel metrics. This is a completely editable PowerPoint presentation and is available for immediate download. Download now and impress your audience.


This slide showcases dashboard to review business activities strategically for continual growth in company revenue and profits. It further includes KPIs such as sales, new consumers, actual and targets met, etc. Showcasing this set of slides titled Organization Performance Strategic Evaluation Dashboard Ppt Slides Visual Aids PDF. The topics addressed in these templates are Average Revenue Per Unit, Customer Lifetime Value, Customer Acquisition Cost. All the content presented in this PPT design is completely editable. Download it and make adjustments in color, background, font etc. as per your unique business setting.
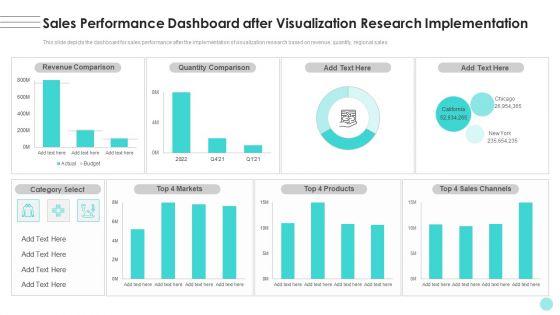

This slide depicts the dashboard for sales performance after the implementation of visualization research based on revenue, quantity, regional sales. Crafting an eye-catching presentation has never been more straightforward. Let your presentation shine with this tasteful yet straightforward Branches For Visualization Research And Development Sales Performance Dashboard After Infographics PDF template. It offers a minimalistic and classy look that is great for making a statement. The colors have been employed intelligently to add a bit of playfulness while still remaining professional. Construct the ideal Branches For Visualization Research And Development Sales Performance Dashboard After Infographics PDF that effortlessly grabs the attention of your audience Begin now and be certain to wow your customers.


This slide illustrates graphical representation of visualization abilities of artificial intelligence on social media. It includes total impressions, total clicks, performance review etc. Pitch your topic with ease and precision using this Social Media Artificial Intelligence Data Visualization Capabilities Dashboard Inspiration PDF. This layout presents information on Artificial Intelligence, Data Visualization Capabilities. It is also available for immediate download and adjustment. So, changes can be made in the color, design, graphics or any other component to create a unique layout.


This slide covers dashboard for estimation of customer satisfaction with success metrics. It includes KPIs such as average CSAT, average response time , service level agreement compliance, top companys accounts, etc. Pitch your topic with ease and precision using this Customer Success And Satisfaction KPIS Dashboard Ppt PowerPoint Presentation Outline Visuals PDF. This layout presents information on Customer Success, Satisfaction KPIs Dashboard. It is also available for immediate download and adjustment. So, changes can be made in the color, design, graphics or any other component to create a unique layout.


This slide describes the data quality dashboard for linked data by covering details of account information quality, contact details quality, financial data quality, and missing account information. Create an editable Linked Data Visualization Data Quality Dashboard For Linked Data Pictures PDF that communicates your idea and engages your audience. Whether youre presenting a business or an educational presentation, pre-designed presentation templates help save time. Linked Data Visualization Data Quality Dashboard For Linked Data Pictures PDF is highly customizable and very easy to edit, covering many different styles from creative to business presentations. Slidegeeks has creative team members who have crafted amazing templates. So, go and get them without any delay.


This slide depicts the dashboard for sales performance after the implementation of visualization research based on revenue, quantity, regional sales. Welcome to our selection of the Sales Performance Dashboard After Visualization Research Implementation Introduction PDF. These are designed to help you showcase your creativity and bring your sphere to life. Planning and Innovation are essential for any business that is just starting out. This collection contains the designs that you need for your everyday presentations. All of our PowerPoints are 100 percent editable, so you can customize them to suit your needs. This multi purpose template can be used in various situations. Grab these presentation templates today.
Showcasing this set of slides titled Annual Financial Performance Administration Dashboard With Key Metrics Ppt PowerPoint Presentation Icon Visual Aids PDF. The topics addressed in these templates are Accounts Receivable, Accounts Payable, Planned Profit Margin. All the content presented in this PPT design is completely editable. Download it and make adjustments in color, background, font etc. as per your unique business setting.


This slide covers customer referral program performance evaluating dashboard. It involves participation rate by referrals, number of referred customers, conversion rate and total revenue generated. Pitch your topic with ease and precision using this Customer Client Referral Program Performance Dashboard Ppt File Visual Aids PDF. This layout presents information on Participation Rate Referrals, Number Referred Customers, Referral Conversion Rate. It is also available for immediate download and adjustment. So, changes can be made in the color, design, graphics or any other component to create a unique layout.
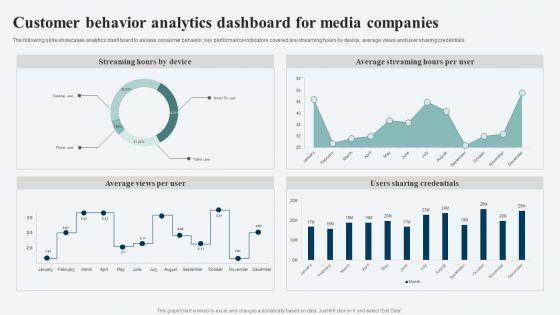

The following slide showcases analytics dashboard to assess consumer behavior. key performance indicators covered are streaming hours by device, average views and user sharing credentials. Showcasing this set of slides titled Customer Behavior Analytics Dashboard For Media Companies Ppt Ideas Visuals PDF. The topics addressed in these templates are Streaming Hours Device, Average Streaming Hours, Per User, Users Sharing Credentials. All the content presented in this PPT design is completely editable. Download it and make adjustments in color, background, font etc. as per your unique business setting.
This slide provides information regarding virtual agents essential activities dashboard in terms of daily number of new conversation, unique users weekly conversations by channel, etc. Deliver and pitch your topic in the best possible manner with this Cognitive Visualizations Computing Strategy Tracking Essential Virtual Agents Activities Dashboard Demonstration PDF. Use them to share invaluable insights on New Conversation, Completed Conver, Faulted Conversation and impress your audience. This template can be altered and modified as per your expectations. So, grab it now.
This slide provides information regarding customer data insights dashboard in terms of average churn risk, segments, high earner, highly engaged customers, etc. Deliver an awe inspiring pitch with this creative Cognitive Visualizations Computing Strategy Tracking Customer Data Insights Dashboard Brochure PDF bundle. Topics like Median Lifetime, Engaged Customers, Return Customers can be discussed with this completely editable template. It is available for immediate download depending on the needs and requirements of the user.


This graph or chart is linked to excel, and changes automatically based on data. Just left click on it and select Edit Data. Pitch your topic with ease and precision using this Firm KPI Dashboard With Schedule Performance Index Ppt Visual Aids PDF. This layout presents information on Project Cost Performance, Project Planning Stage, Monitor And Control. It is also available for immediate download and adjustment. So, changes can be made in the color, design, graphics or any other component to create a unique layout.


This graph or chart is linked to excel, and changes automatically based on data. Just left click on it and select Edit Data. Showcasing this set of slides titled Client Helpline Dashboard Average Time To Solve Issue Ppt Portfolio Visuals PDF. The topics addressed in these templates are Cost Per Support, Customer Satisfaction, Costs To Revenue. All the content presented in this PPT design is completely editable. Download it and make adjustments in color, background, font etc. as per your unique business setting.
Pitch your topic with ease and precision using this Social Media Tracking Dashboard With User Engagement Ppt Summary Visuals PDF. This layout presents information on Social Media, Tracking Dashboard. It is also available for immediate download and adjustment. So, changes can be made in the color, design, graphics or any other component to create a unique layout.


This slide covers the details of price optimization which focuses on price changes, leader, distribution, and benchmark. Deliver and pitch your topic in the best possible manner with this Price Optimization Dashboard Product Pricing Strategies Analysis Ppt Infographic Template Visuals PDF. Use them to share invaluable insights on Price Changes Sep, Price Leader Accessories, Per Price Range and impress your audience. This template can be altered and modified as per your expectations. So, grab it now.


Pitch your topic with ease and precision using this Visual Analytical KPI Dashboard For Data Warehouse Template PDF This layout presents information on Machine Learning Based, Volume Change, Revenue Change It is also available for immediate download and adjustment. So, changes can be made in the color, design, graphics or any other component to create a unique layout.


This slide depicts the dashboard for sales performance after the implementation of visualization research based on revenue, quantity, regional sales.Deliver an awe inspiring pitch with this creative Departments Of Visualization Research Sales Performance Dashboard After Visualization Sample PDF bundle. Topics like Revenue Comparison, Quantity Comparison, Category Select can be discussed with this completely editable template. It is available for immediate download depending on the needs and requirements of the user.


This template covers lean visual product management status dashboard including different stages Deliver and pitch your topic in the best possible manner with this hoshin kanri pitch deck lean visual product management dashboard rules pdf. Use them to share invaluable insights on lean visual product management dashboard and impress your audience. This template can be altered and modified as per your expectations. So, grab it now.


Deliver and pitch your topic in the best possible manner with this human resource service dashboard for strategic decisions of hr department ppt slides visuals pdf. Use them to share invaluable insights on dashboard for strategic decisions of hr department and impress your audience. This template can be altered and modified as per your expectations. So, grab it now.
picts the edge computing dashboard to monitor the security of networks and devices in the organization by covering threat prevention and detection details. Deliver an awe inspiring pitch with this creative dashboard for concurrent computing tracking ppt visual aids ideas pdf bundle. Topics like dashboard for concurrent computing tracking can be discussed with this completely editable template. It is available for immediate download depending on the needs and requirements of the user.


This slide represents the dashboard for data warehouse implementation in the organization, including transactions per hour and value, total value by the day, and location. Deliver an awe inspiring pitch with this creative data warehousing it dashboard for data warehouse implementation ppt summary visual aids pdf bundle. Topics like transactions, value, location can be discussed with this completely editable template. It is available for immediate download depending on the needs and requirements of the user.


Deliver and pitch your topic in the best possible manner with this real estate finance dashboard with monthly sales and properties listed ppt gallery visual aids pdf. Use them to share invaluable insights on average, market, sales and impress your audience. This template can be altered and modified as per your expectations. So, grab it now.
SHOW
- 60
- 120
- 180
DISPLAYING: 60 of 92 Item(s)
Page