AI PPT Maker
Templates
PPT Bundles
Design Services
Business PPTs
Business Plan
Management
Strategy
Introduction PPT
Roadmap
Self Introduction
Timelines
Process
Marketing
Agenda
Technology
Medical
Startup Business Plan
Cyber Security
Dashboards
SWOT
Proposals
Education
Pitch Deck
Digital Marketing
KPIs
Project Management
Product Management
Artificial Intelligence
Target Market
Communication
Supply Chain
Google Slides
Research Services
One Pagers
All Categories
Values Percentage PowerPoint Presentation Templates and Google Slides
SHOW
- 60
- 120
- 180
DISPLAYING: 60 of 66 Item(s)
Page


Slide 1 of 6
This is a Four Phases Of Task Completion With Percentage Values Ppt PowerPoint Presentation Outline Clipart Images. This is a four stage process. The stages in this process are methods phases, methods parts, techniques phases.


Slide 1 of 6
This is a 3d bar chart for percentage values comparison ppt powerpoint presentation professional visual aids. This is a five stage process. The stages in this process are art, colouring, paint brush.


Slide 1 of 5
This is a iceberg icon with four percentage values and text holders ppt powerpoint presentation outline example file. This is a four stage process. The stages in this process are iceberg, glacier, ice shelf.


Slide 1 of 5
This is a percentage value comparison pie chart icon ppt powerpoint presentation model clipart images. This is a three stage process. The stages in this process are percentage icon, dividend icon, portion icon.


Slide 1 of 5
This is a map of country belarus with percentage values ppt powerpoint presentation slides introduction. This is a six stage process. The stages in this process are belarus, countries, geographical.


Slide 1 of 5
This is a pie chart with multiple percentage values ppt powerpoint presentation show. This is a six stage process. The stages in this process are pie, finance, people, silhouettes, communication.


Slide 1 of 5
This PowerPoint template has been designed with graphics of America map. You may use this map diagram to display sales territories, business and new office locations, travel planning etc in your presentations. Any text can be entered at any point in the PowerPoint map slide.


Slide 1 of 4
This PowerPoint template has been designed with three circles and percentage values. This PPT slide may be used to display financial analysis for business. Download this slide to build unique presentation.


Slide 1 of 4
This PowerPoint timeline template has been designed with three trucks with percentage values. This timeline template may be used to display three years growth planning. Download this PowerPoint timeline template to make impressive presentations.


Slide 1 of 4
This PowerPoint timeline slide design can be used to display timeline operations. It contains sequential timeline diagram with percentage values. This timeline template can be used in presentations where you need to display time planning and analysis.


Slide 1 of 4
This PowerPoint template displays map diagram with highlighted areas and percentage values. You may use this PPT slide to exhibit area wise financial growth. Download this PowerPoint map diagram to build impressive presentations.


Slide 1 of 4
This PowerPoint template contains graphics of triangle with two segments and percentage values. You may use this PPT slide for financial planning. The color coding of this template is specifically designed to highlight you points.


Slide 1 of 4
This PowerPoint template has been designed with graphics of text tags, icons and percentage values. Download this business diagram to outline business plan. Present your views and ideas with this impressive design.


Slide 1 of 4
Our above PPT slide displays graphics of Pie charts. This PowerPoint template may be used to display percentage value analysis. Download this template to leave permanent impression on your audience.


Slide 1 of 4
This PowerPoint template has been designed with two percentage values You may download this PPT slide to use as comparison chart. Add this slide to your presentation and impress your superiors.


Slide 1 of 4
This PPT slide displays graphics of four trucks with percentage values. Use this PPT design to display logistics compare chart. This PowerPoint template can be customized as per requirements of business presentation.


Slide 1 of 4
This PowerPoint template has been designed with about us design with percentage values. Download this PPT slide display companies facts and figures. You can easily customize this template to make it more unique as per your need.


Slide 1 of 4
This PowerPoint template has been designed with three dashboards. Use this PPT slide to depict rise in business profit. This professional diagram slide will help you express your views to target audience.


Slide 1 of 4
This PowerPoint template displays info graphic diagram of linear circles. This diagram may be used to exhibit financial growth and analysis. Grab center stage with this slide and capture the attention of your audience.


Slide 1 of 4
This PowerPoint template has been designed with text boxes and percentage data. You may download this PPT slide to display data comparison and analysis. Add this slide to your presentation and impress your superiors.


Slide 1 of 4
This professionally designed PowerPoint template displays diagram of world map. You can download this diagram to exhibit global business analysis. Above PPT slide is suitable for business presentation.


Slide 1 of 4
This PowerPoint template displays graphics of Ecuador map with six different locations and percentage values. This Map template can be used in business presentations to depict economic analysis. This slide can also be used by school students for educational projects.


Slide 1 of 4
This diagram contains graphics of linear circles timeline diagram. Download this diagram slide to display business planning and management. This diagram is editable you can edit text, color, shade and style as per you need.


Slide 1 of 4
This PowerPoint template has been designed with circular process diagram. This business diagram helps to exhibit financial process control and analysis. Use this diagram to visually support your content.


Slide 1 of 4
This PowerPoint template has been designed with Saudi Arabia Map with percentage values and icons. You may use this slide to display financial strategy analysis. This diagram provides an effective way of displaying information you can edit text, color, shade and style as per you need.


Slide 1 of 4
This PowerPoint template has been designed with six circles and percentage values. This PPT slide can be used to display financial ratio analysis. You can download finance PowerPoint template to prepare awesome presentations.


Slide 1 of 4
This PowerPoint template has been designed with diagram of pie chart with increasing percentage values. This PPT slide can be used to prepare presentations for profit growth report and also for financial data analysis. You can download finance PowerPoint template to prepare awesome presentations.


Slide 1 of 4
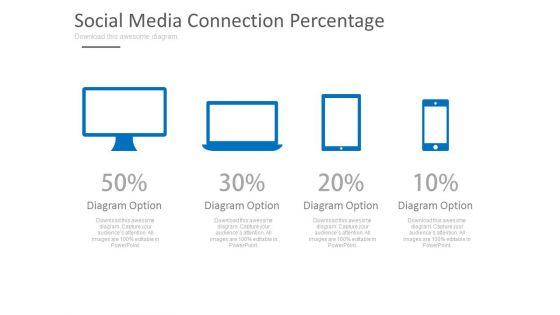
This slide which shows a mobile, a tablet and a laptop / TV screen can be perfectly used to demonstrate compatibility of an application or a website on different kind of devices, operating systems and screen sizes. This slide can be used by business and organizations dealing with technology in any manner. The slide can be used to demonstrate the usage experience on different screen sizes. It can be used to demonstrate the number of users of a website or an app or a particular platform. It can also easily depict the ratio of users on the based on their usage patterns and preferences of devise. This can be an effective way to compare one gadget with another. The slide is customizable and can be used with different icons and colors as per the convenience and needs of the user.


Slide 1 of 4
This PPT slide displays graphics of computer, laptop, tablet and mobile. Use this PPT design to display comparison of computer devices. This PowerPoint template can be customized as per requirements of business education or any other theme.


Slide 1 of 4
Circle Chart with Increasing Percentage Values power point Slides: - Show your achievements and targets with the ideal background. Above is the diagram to display how your business has been growing or your achievements. The slide is of the three circles having water at different levels in them. Therefore it becomes easy to show that in the first circle, the growth is at this much percent, then the second one and in the last circle, completed 85% of the targets. This PowerPoint template is easy to use to show the progress, and comparisons. All icons are editable. Choose them as per your need.


Slide 1 of 4
This year?s sales has matched up with your expectations. Now match this slide with your presentation to show the same. Show your company?s performance or business growth with this four staged battery chart PowerPoint template. With this slide, you can easily convince your colleagues how your company gave a tremendous growth over the years or months. Perfect illustration to show that the targets are achieved. This PPT template is easy to edit. You can choose the color of your choice. Your colleagues are already impressed with the sales growth. Now impress others and choose this PPT innovative designed template.


Slide 1 of 4
This PowerPoint template contains graphics of balloons steps with percentage growth values. You may download this slide to display strategy steps for financial growth. You can easily customize this template to make it more unique as per your need.


Slide 1 of 3
The above template displays a diagram of stopwatch with percentage value. This diagram has been professionally designed to emphasize on time management. Grab center stage with this slide and capture the attention of your audience.


Slide 1 of 3
Our professionally designed business diagram is as an effective tool for communicating ideas and planning. It contains five options bars with percentage values. Convey your views with this diagram slide. It will amplify the strength of your logic.


Slide 1 of 3
This PPT slide contains Venn business chart with percentage values. This PPT diagram is suitable to present data comparison and analysis. Enlighten others on the process with this innovative PowerPoint template.


Slide 1 of 3
Our compelling template consists with truck design with percentage values. This PPT slide has been professionally designed to exhibit transport and logistics concepts. This template offers an excellent background to build impressive presentation.


Slide 1 of 3
This PowerPoint template has been designed with graphics of semicircle with five percentage values. This business design can be used for financial ratio analysis. Capture the attention of your audience with this slide.


Slide 1 of 3
Visually support your presentation with our above template containing infographic diagram with percentage values. This diagram is excellent visual tools for explaining huge amounts of information where complex data needs to be explained immediately and clearly.


Slide 1 of 3
This PowerPoint template displays circles with percentage values. This business diagram is suitable for financial data analysis. Use this business diagram slide to highlight the key issues of your presentation.


Slide 1 of 3
Growth analysis for business can be defined with this business diagram. This slide depicts text boxes in increasing flow. Present your views using this innovative slide and be assured of leaving a lasting impression


Slide 1 of 3
Growth analysis for business can be defined with this business diagram. This slide depicts text boxes in increasing flow. Present your views using this innovative slide and be assured of leaving a lasting impression


Slide 1 of 3
This business slide has been designed with circular arrows. You may download this diagram to display percentage growth data. This template is innovatively designed to highlight your worthy views


Slide 1 of 3
Four staged pie chart and percentage values are used to design this business slide. Download this diagram to make business and financial reports. Use our above diagram to express information in a visual way.


Slide 1 of 3
This business diagram has been designed with graphic of four water drops and percentage values. This slide may be used to display percentage values for business analysis. Use this editable diagram for finance and business related presentations.


Slide 1 of 3
This business diagram displays set of pie charts. This Power Point template has been designed to compare and present business data. Download this diagram to represent stages of business growth.


Slide 1 of 3
Four staged bar graph with percentage value has been used to craft this power point template. This PPT contains the concept of making financial timeline and result analysis. This PPT can be used for business and finance related presentations.


Slide 1 of 3
This power point template has been designed with graphic of 3d circular process and percentage value. This PPT contains the concept of business and marketing process flow. Use this PPT for your business and marketing presentations.


Slide 1 of 3
This Power Point template has been designed with graphic of 3d home with percentage values. This image slide contains the concept of real-estate investment and growth. Use this editable slide to build an exclusive presentation for your viewers.


Slide 1 of 3
This image slide has been designed with graphic of percent symbol coming out of box. Use this image in your business presentations to portray concepts of surprise gift. Concept of value, profit may also be explained with this innovative image slide.


Slide 1 of 3
Touch Base With Our business management strategy dollar value percentage clipart images Powerpoint Templates. Review Your Growth With Your Audience.


Slide 1 of 2
This slide shows a fall in the On-time Shipping Percentage of HCL Plus Logistics Company. Reasons for the fall is due to factors such as Lack of Real-Time Data, Loading Mistakes and Vessel Damages, Poor Warehouse Process Functioning, etc. Deliver and pitch your topic in the best possible manner with this generating logistics value business on time shipping percentage of hcl plus logistics company for 5 years rules pdf. Use them to share invaluable insights on on time shipping percentage of hcl plus logistics company for 5 years and impress your audience. This template can be altered and modified as per your expectations. So, grab it now.


Slide 1 of 2
This slide shows a fall in the On Time Pickup Percentage of HCL Plus Logistics Company. Reasons for the fall is due to factors such as Complex Shipping Operations, Poor Fright Carrier Performance, Lack of Expertise and Updated Technologies in Logistic Operations, Faulty Scheduling Procedures and Softwares etc. Deliver and pitch your topic in the best possible manner with this generating logistics value business fall in on time pickup percentage of hcl plus logistics company slides pdf. Use them to share invaluable insights on fall in on time pickup percentage of hcl plus logistics company for 5 years and impress your audience. This template can be altered and modified as per your expectations. So, grab it now.


Slide 1 of 2
This slide shows a fall in the On-time Delivery Percentage of HCL Plus Logistics Company. Reasons for the fall is due to factors such as Poor Production Efficiency, Poor Fright Carrier Performance, Faulty Material Handling Procedures, Faulty Scheduling Procedures and Softwares etc. Deliver an awe inspiring pitch with this creative generating logistics value business fall in on time delivery percentage of hcl plus logistics company mockup pdf bundle. Topics like fall in on time delivery percentage of hcl plus logistics company can be discussed with this completely editable template. It is available for immediate download depending on the needs and requirements of the user.


Slide 1 of 2
Pitch your topic with ease and precision using this various banking contribution chart with percentage values ppt powerpoint presentation visual aids deck pdf This layout presents information on various banking contribution chart with percentage values. It is also available for immediate download and adjustment. So, changes can be made in the color, design, graphics or any other component to create a unique layout.


Slide 1 of 2
Various Team Performance Circles With Percentage Values Ppt PowerPoint Presentation Gallery Good PDF
Presenting various team performance circles with percentage values ppt powerpoint presentation gallery good pdf to dispense important information. This template comprises five stages. It also presents valuable insights into the topics including design team, development team, product team. This is a completely customizable PowerPoint theme that can be put to use immediately. So, download it and address the topic impactfully.


Slide 1 of 2
Showcasing this set of slides titled pie chart with various percentage values ppt powerpoint presentation gallery graphics template pdf. The topics addressed in these templates are pie chart with various percentage values. All the content presented in this PPT design is completely editable. Download it and make adjustments in color, background, font etc. as per your unique business setting.


Slide 1 of 2
Showcasing this set of slides titled business progress circle with percentage values ppt powerpoint presentation file backgrounds pdf. The topics addressed in these templates are business progress circle with percentage values. All the content presented in this PPT design is completely editable. Download it and make adjustments in color, background, font etc. as per your unique business setting.


Slide 1 of 2
Showcasing this set of slides titled chart showing features of products with percentage values ppt powerpoint presentation icon example file pdf. The topics addressed in these templates are chart showing features of products with percentage values. All the content presented in this PPT design is completely editable. Download it and make adjustments in color, background, font etc. as per your unique business setting.


Slide 1 of 2
Persuade your audience using this objective key results with percentage values ppt powerpoint presentation gallery guide pdf. This PPT design covers four stages, thus making it a great tool to use. It also caters to a variety of topics including objective key results with percentage values. Download this PPT design now to present a convincing pitch that not only emphasizes the topic but also showcases your presentation skills.


Slide 1 of 2
ABC Analysis Chart With Percentage Of Dollar Value Ppt PowerPoint Presentation Gallery Portfolio PDF
Pitch your topic with ease and precision using this abc analysis chart with percentage of dollar value ppt powerpoint presentation gallery portfolio pdf. This layout presents information on abc analysis chart with percentage of dollar value. It is also available for immediate download and adjustment. So, changes can be made in the color, design, graphics or any other component to create a unique layout.
SHOW
- 60
- 120
- 180
DISPLAYING: 60 of 66 Item(s)
Page