- Sign up
- Sign In
 AI PPT Maker
 Templates
 PPT Bundles
 Design Services
 Business PPTs
 Business Plan
 Management
 Strategy
 Introduction PPT
 Roadmap
 Self Introduction
 Timelines
 Process
 Marketing
 Agenda
 Technology
 Medical
 Startup Business Plan
 Cyber Security
 Dashboards
 SWOT
SWOT Proposals
 Education
 Pitch Deck
 Digital Marketing
 KPIs
KPIs Project Management
 Product Management
 Artificial Intelligence
 Target Market
 Communication
 Supply Chain
 Google Slides
 Research Services
 One Pagers
 All Categories
Utilization dashboard PowerPoint Presentation Templates and Google Slides
31 Item(s)
This slide provides glimpse about claim activities tracking by insurance agency in terms of claim amount collected, number of claims, claims by product line, claim status assessment, claim expense by product line, etc. If you are looking for a format to display your unique thoughts, then the professionally designed Claims Tracking Dashboard Utilized By Insurance Agency Diagrams PDF is the one for you. You can use it as a Google Slides template or a PowerPoint template. Incorporate impressive visuals, symbols, images, and other charts. Modify or reorganize the text boxes as you desire. Experiment with shade schemes and font pairings. Alter, share or cooperate with other people on your work. Download Claims Tracking Dashboard Utilized By Insurance Agency Diagrams PDF and find out how to give a successful presentation. Present a perfect display to your team and make your presentation unforgettable.


This slide represents the dashboard to analysis the performance of twitter advertising campaign. It provides information regarding total followers gained and lost, impressions, engagement rate. It also covers details of top five used and best performing hashtags performance. Want to ace your presentation in front of a live audience Our Utilizing Twitter For Social Media Performance Analysis Dashboard For Twitter Marketing Themes PDF can help you do that by engaging all the users towards you.. Slidegeeks experts have put their efforts and expertise into creating these impeccable powerpoint presentations so that you can communicate your ideas clearly. Moreover, all the templates are customizable, and easy-to-edit and downloadable. Use these for both personal and commercial use.


This slide depicts the dashboard for twitter marketing campaign providing information regarding average engagement rate, hashtag and links clicks, impressions and followers gained. Formulating a presentation can take up a lot of effort and time, so the content and message should always be the primary focus. The visuals of the PowerPoint can enhance the presenters message, so our Utilizing Twitter For Social Media Dashboard For Twitter Marketing Campaign Mockup PDF was created to help save time. Instead of worrying about the design, the presenter can concentrate on the message while our designers work on creating the ideal templates for whatever situation is needed. Slidegeeks has experts for everything from amazing designs to valuable content, we have put everything into Utilizing Twitter For Social Media Dashboard For Twitter Marketing Campaign Mockup PDF.


This slide represents the dashboard for twitter competition analysis providing information regarding published tweets in terms of original, links, pictures, videos etc. It also covers details of tweet likes, retweets, mentions, replies etc. Make sure to capture your audiences attention in your business displays with our gratis customizable Utilizing Twitter For Social Media Dashboard For Twitter Competition Analysis Structure PDF. These are great for business strategies, office conferences, capital raising or task suggestions. If you desire to acquire more customers for your tech business and ensure they stay satisfied, create your own sales presentation with these plain slides.


The following slide highlights the maintenance KPIs to assess and gauge performance. It includes elements such as average downtime, average utilization, error wise downtime, daily average utilization, week wise average utilization etc. Showcasing this set of slides titled Maintenance Metrics Dashboard With Downtime And Utilization Pictures PDF. The topics addressed in these templates are Maintenance Metrics Dashboard, Downtime And Utilization. All the content presented in this PPT design is completely editable. Download it and make adjustments in color, background, font etc. as per your unique business setting.


This template shows the dashboard for RPA utilization breakdown management. The purpose of this slide to evaluate the robotics errors. It includes such as RPA utilization, attended, unattended, etc. Pitch your topic with ease and precision using this Robotic Process Automation Solutions Management Utilization Breakdown Management Dashboard Pictures PDF. This layout presents information on Robots With Errors, Utilization, Unattended. It is also available for immediate download and adjustment. So, changes can be made in the color, design, graphics or any other component to create a unique layout.


The following slide depicts dashboard for observing project resource utilization. It provides information about billable utilization, company target, project hours, over hours, project allocations, etc. Take your projects to the next level with our ultimate collection of Dashboard For Monitoring Project Team Workload And Capacity Utilization Topics PDF. Slidegeeks has designed a range of layouts that are perfect for representing task or activity duration, keeping track of all your deadlines at a glance. Tailor these designs to your exact needs and give them a truly corporate look with your own brand colors they will make your projects stand out from the rest.


The following slide depicts dashboard for observing project resource utilization. It provides information about billable utilization, company target, project hours, over hours, project allocations, etc.Present like a pro with Dashboard For Monitoring Project Team Workload And Capacity Utilization Background PDF Create beautiful presentations together with your team, using our easy-to-use presentation slides. Share your ideas in real-time and make changes on the fly by downloading our templates. So whether you are in the office, on the go, or in a remote location, you can stay in sync with your team and present your ideas with confidence. With Slidegeeks presentation got a whole lot easier. Grab these presentations today.


This slide consists of a Dashboard which can be used by managers to depict robot utilization in attended automation. Key performance indicators relate to total utilization, robot types, hours saved etc. Pitch your topic with ease and precision using this Dashboard To Depict Robot Utilization In Robotic Desktop Automation Download PDF. This layout presents information on Dashboard, Depict Robot Utilization, Robotic Desktop Automation. It is also available for immediate download and adjustment. So, changes can be made in the color, design, graphics or any other component to create a unique layout.


This slide showcases metrics tracker for managing robot utilization. It also include KPIs for analysis such as total utilization, robot types, average utilization per robot, robots with error, etc. Pitch your topic with ease and precision using this Robotic Process Automation Metrics Dashboard With Robot Utilization Kpis Background PDF. This layout presents information on Average Utilization, Robot Utilization, Automation Metrics Dashboard. It is also available for immediate download and adjustment. So, changes can be made in the color, design, graphics or any other component to create a unique layout.
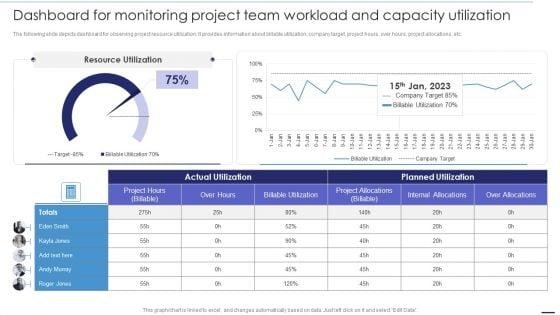

The following slide depicts dashboard for observing project resource utilization. It provides information about billable utilization, company target, project hours, over hours, project allocations, etc. Slidegeeks is here to make your presentations a breeze with Deploying Cloud Technology Dashboard For Monitoring Project Team Workload And Capacity Utilization Ppt Show Background Designs PDF With our easy-to-use and customizable templates, you can focus on delivering your ideas rather than worrying about formatting. With a variety of designs to choose from, you are sure to find one that suits your needs. And with animations and unique photos, illustrations, and fonts, you can make your presentation pop. So whether you are giving a sales pitch or presenting to the board, make sure to check out Slidegeeks first.
The purpose of this slide is to outline mobile search engine optimization SEO reporting dashboard. It covers different metrics such as web traffic overview, total views, content overview, goal value and conversion etc. Take your projects to the next level with our ultimate collection of Utilizing SEO To Boost Customer SEO Reporting Dashboard To Evaluate Website Rank Background PDF. Slidegeeks has designed a range of layouts that are perfect for representing task or activity duration, keeping track of all your deadlines at a glance. Tailor these designs to your exact needs and give them a truly corporate look with your own brand colors theyll make your projects stand out from the rest.


Utilizing SEO To Boost Customer KPI Metrics Dashboard To Monitor Mobile Seo Performance Download PDF
The purpose of this slide is to outline key performance indicator KPI dashboard which will assist the marketer to analyze mobile search engine optimization SEO performance. The key metrics mentioned in the slide are total sessions, search engine rankings etc. Coming up with a presentation necessitates that the majority of the effort goes into the content and the message you intend to convey. The visuals of a PowerPoint presentation can only be effective if it supplements and supports the story that is being told. Keeping this in mind our experts created Utilizing SEO To Boost Customer KPI Metrics Dashboard To Monitor Mobile Seo Performance Download PDF to reduce the time that goes into designing the presentation. This way, you can concentrate on the message while our designers take care of providing you with the right template for the situation.


This slide covers real time utilization dashboard covering logged time such as billable, non-billable, estimated time and scheduled. It also include details of allotted hours to each employee and weekly hours for the assignment. Deliver an awe inspiring pitch with this creative Real Time Utilization Dashboard Company Performance Evaluation Using KPI Clipart PDF bundle. Topics like Real Time, Utilization Dashboard can be discussed with this completely editable template. It is available for immediate download depending on the needs and requirements of the user.


This slide covers real time utilization dashboard covering logged time such as billable, non-billable, estimated time and scheduled. It also include details of allotted hours to each employee and weekly hours for the assignment. Deliver an awe inspiring pitch with this creative Kpis For Evaluating Business Sustainability Real Time Utilization Dashboard Portrait PDF bundle. Topics like Logged Time, Employee, Albert Rudolf can be discussed with this completely editable template. It is available for immediate download depending on the needs and requirements of the user.


This slide covers real time utilization dashboard covering logged time such as billable, non-billable, estimated time and scheduled. It also include details of allotted hours to each employee and weekly hours for the assignment.Deliver and pitch your topic in the best possible manner with this Enterprise Sustainability Performance Metrics Real Time Utilization Dashboard Portrait PDF. Use them to share invaluable insights on Real Time, Utilization Dashboard and impress your audience. This template can be altered and modified as per your expectations. So, grab it now.


This slide covers real time utilization dashboard covering logged time such as billable, non-billable, estimated time and scheduled. It also include details of allotted hours to each employee and weekly hours for the assignment. Deliver an awe inspiring pitch with this creative Metrics To Measure Business Performance Real Time Utilization Dashboard Topics PDF bundle. Topics like Weekly Hours, Employee, Estimated Time can be discussed with this completely editable template. It is available for immediate download depending on the needs and requirements of the user.


This slide shows the resourcing plan dashboard which focuses on the over and under utilization, trend by team, data by team which includes resource and utilization time of software developer, web designer and project manager. Pitch your topic with ease and precision using this Resource Planning Management Dashboard With Effective Utilization Mockup PDF. This layout presents information on Web Designer, Software Developer, Team. It is also available for immediate download and adjustment. So, changes can be made in the color, design, graphics or any other component to create a unique layout.


Mentioned slide portrays KPI dashboard for monitoring project progress. KPIS covered here are planned versus actual hours, risks and issues. Deliver and pitch your topic in the best possible manner with this utilizing agile methodology in data transformation project it kpi dashboard for monitoring template pdf. Use them to share invaluable insights on risk, planned, project and impress your audience. This template can be altered and modified as per your expectations. So, grab it now.


This slide covers real time utilization dashboard covering logged time such as billable, non billable, estimated time and scheduled. It also include details of allotted hours to each employee and weekly hours for the assignment. Deliver and pitch your topic in the best possible manner with this sustainability calculation with kpi real time utilization dashboard inspiration pdf. Use them to share invaluable insights on real time utilization dashboard and impress your audience. This template can be altered and modified as per your expectations. So, grab it now.


Deliver an awe-inspiring pitch with this creative utilizing infrastructure management using latest methods infrastructure kpi dashboard showing cost reduction and procurement rules pdf bundle. Topics like cost reduction, procurement roi, avoidance, cost savings, cost avoidance, procurement roi, cost purchase, cost reduction can be discussed with this completely editable template. It is available for immediate download depending on the needs and requirements of the user.

This is a utilizing infrastructure management using latest methods kpi metrics and dashboard topics pdf template with various stages. Focus and dispense information on two stages using this creative set, that comes with editable features. It contains large content boxes to add your information on topics like kpi metrics, kpi dashboards. You can also showcase facts, figures, and other relevant content using this PPT layout. Grab it now.


Deliver an awe-inspiring pitch with this creative utilizing infrastructure management using latest methods infrastructure kpi dashboard showing resource allocation demonstration pdf bundle. Topics like days per project, resource allocation, project financial, delivery timeline and resources can be discussed with this completely editable template. It is available for immediate download depending on the needs and requirements of the user.


Deliver an awe-inspiring pitch with this creative utilizing infrastructure management using latest methods infrastructure kpi dashboard showing project revenue background pdf bundle. Topics like net project revenue per employee, construction and demolition west recycled, dollars million, square meter price, project can be discussed with this completely editable template. It is available for immediate download depending on the needs and requirements of the user.


Deliver and pitch your topic in the best possible manner with this utilizing cyber technology for change process marketing dashboard topics pdf.Use them to share invaluable insights on marketing dashboard and impress your audience.This template can be altered and modified as per your expectations. So, grab it now.


Use a scorecard or dashboard to measure the success of digital transformation. Deliver an awe-inspiring pitch with this creative utilizing cyber technology for change process digital vitality dashboard guidelines pdf. bundle. Topics like organizational alignment, ecommerce, digital team or coe, customer service, marketing and communications, product teams, infrastructure can be discussed with this completely editable template. It is available for immediate download depending on the needs and requirements of the user.
Showcasing this set of slides titled vector illustration of capacity utilization dashboard vector icon ppt powerpoint presentation file mockup pdf. The topics addressed in these templates are vector illustration of capacity utilization dashboard vector icon. All the content presented in this PPT design is completely editable. Download it and make adjustments in color, background, font etc. as per your unique business setting.
This slide represents a dashboard providing an enterprise-level view of warehouse capacity and utilization to enable process improvements. It monitors KPIs such as shelf capacity used by inventory type, storage device, honeycomb percentage, days on hand by inventory type, and by items. Create an editable Dashboard Tracking Warehouse Capacity And Utilization Metrics Icons PDF that communicates your idea and engages your audience. Whether you are presenting a business or an educational presentation, pre-designed presentation templates help save time. Dashboard Tracking Warehouse Capacity And Utilization Metrics Icons PDF is highly customizable and very easy to edit, covering many different styles from creative to business presentations. Slidegeeks has creative team members who have crafted amazing templates. So, go and get them without any delay.


The following slide showcases some KPIs to measure effectiveness of logistics and supply chain management. It includes KPAs such as fleet analysis, order delivery state, location wise delivery status, yearly loading time etc. Pitch your topic with ease and precision using this Logistics KPI Dashboard With Loading Time Utilization Analysis Download PDF. This layout presents information on Fleet Analysis, Order Delivery State, Location Wise Delivery Status. It is also available for immediate download and adjustment. So, changes can be made in the color, design, graphics or any other component to create a unique layout.


The following slide showcases the key performance indicators of digital marketing to measure progress. It includes KPAs such as no. of visits, bounce rate, converted goals, website traffic etc. Pitch your topic with ease and precision using this Digital Marketing Kpi Dashboard With Bounce Time Utilization Analysis Graphics PDF. This layout presents information on Digital Marketing, KPI Dashboard, Bounce Time Utilization Analysis. It is also available for immediate download and adjustment. So, changes can be made in the color, design, graphics or any other component to create a unique layout.


The following slide highlights the time that customer expects e-mail response to enhance loyal customer base. It includes elements of response time immediate, less than one hr., within a day, two day etc. Showcasing this set of slides titled Customer Service Time Utilization Analysis Kpi Dashboard Designs PDF. The topics addressed in these templates are Customer Service, Time Utilization Analysis, KPI Dashboard. All the content presented in this PPT design is completely editable. Download it and make adjustments in color, background, font etc. as per your unique business setting.
31 Item(s)