 AI PPT Maker
 Templates
 PPT Bundles
 Design Services
 Business PPTs
 Business Plan
 Management
 Strategy
 Introduction PPT
 Roadmap
 Self Introduction
 Timelines
 Process
 Marketing
 Agenda
 Technology
 Medical
 Startup Business Plan
 Cyber Security
 Dashboards
 SWOT
SWOT Proposals
 Education
 Pitch Deck
 Digital Marketing
 KPIs
KPIs Project Management
 Product Management
 Artificial Intelligence
 Target Market
 Communication
 Supply Chain
 Google Slides
 Research Services
 One Pagers
 All Categories
System dashboards PowerPoint Presentation Templates and Google Slides
SHOW
- 60
- 120
- 180
DISPLAYING: 60 of 203 Item(s)
Page


This slide shows the dashboard to keep a regular track of the performance of industrial robots. the purpose of this slide is to provide a graphical representation of robots performance to enhance the accuracy and effectiveness of these machines. This modern and well-arranged Industrial Robots System Industrial Robots System Performance Tracking Dashboard Diagrams PDF provides lots of creative possibilities. It is very simple to customize and edit with the Powerpoint Software. Just drag and drop your pictures into the shapes. All facets of this template can be edited with Powerpoint, no extra software is necessary. Add your own material, put your images in the places assigned for them, adjust the colors, and then you can show your slides to the world, with an animated slide included.


This slide covers the dashboard which can be used to monitor the server count, geo activity, processor, memory space, network security, etc.Crafting an eye-catching presentation has never been more straightforward. Let your presentation shine with this tasteful yet straightforward Infrastructure Monitoring Dashboard Information Tech System Maintenance Pictures PDF template. It offers a minimalistic and classy look that is great for making a statement. The colors have been employed intelligently to add a bit of playfulness while still remaining professional. Construct the ideal Infrastructure Monitoring Dashboard Information Tech System Maintenance Pictures PDF that effortlessly grabs the attention of your audience Begin now and be certain to wow your customers.


This slide represents the key metrics dashboard of CRM system of an organization. It includes details related to KPIs such as new contacts, campaign emails sent, emails opened, revenue graph etc. This modern and well arranged Integrating CRM Solution To Acquire Potential Customers Customer Relationship Management System Dashboard Brochure PDF provides lots of creative possibilities. It is very simple to customize and edit with the Powerpoint Software. Just drag and drop your pictures into the shapes. All facets of this template can be edited with Powerpoint no extra software is necessary. Add your own material, put your images in the places assigned for them, adjust the colors, and then you can show your slides to the world, with an animated slide included.


This slide covers KPI dashboard to analyze improved performance after implementing health information technology system in organization. It involves details such as outpatient trends, average waiting time and overall patient satisfaction. Create an editable Incorporating HIS To Enhance Healthcare Services Dashboard To Assess Performance Of Integrating Health IT System Diagrams PDF that communicates your idea and engages your audience. Whether youre presenting a business or an educational presentation, pre designed presentation templates help save time. Incorporating HIS To Enhance Healthcare Services Dashboard To Assess Performance Of Integrating Health IT System Diagrams PDF is highly customizable and very easy to edit, covering many different styles from creative to business presentations. Slidegeeks has creative team members who have crafted amazing templates. So, go and get them without any delay.


This slide represents the dashboard to track the AMRs performance in the warehouse. It covers various AMRs status reports, energy consumption, battery level, total working hours, and time to return. Find highly impressive Types Of Independent Robotic System Dashboard To Track Autonomous Mobile Robot Performance Designs PDF on Slidegeeks to deliver a meaningful presentation. You can save an ample amount of time using these presentation templates. No need to worry to prepare everything from scratch because Slidegeeks experts have already done a huge research and work for you. You need to download Types Of Independent Robotic System Dashboard To Track Autonomous Mobile Robot Performance Designs PDF for your upcoming presentation. All the presentation templates are 100 percent editable and you can change the color and personalize the content accordingly. Download now.


This slide covers hospital management system KPI dashboard with clinical trials. It involves details such as phase trials, trials by year and trials by status. Take your projects to the next level with our ultimate collection of Hospital Management System Dashboard With Clinical Trials Background PDF. Slidegeeks has designed a range of layouts that are perfect for representing task or activity duration, keeping track of all your deadlines at a glance. Tailor these designs to your exact needs and give them a truly corporate look with your own brand colors they will make your projects stand out from the rest.


This side showcase the dashboard of security system management for tracking and forecasting matrices for better functioning of devices. It include the statistic data such as temperature, power consumed, devices working, and list of devices connected. Showcasing this set of slides titled Dashboard For Technological Smart Homes Security System Management Designs PDF. The topics addressed in these templates are Smart Light, Smart Heating, Smart Cooling. All the content presented in this PPT design is completely editable. Download it and make adjustments in color, background, font etc. as per your unique business setting.


This slide showcases manufacturing dashboard to track KPIs defined under lean and kaizen process improvement plans. Key performance metrics included here are TEEP, OEE, loading time, production quality, losses by hours, losses by categories etc. Pitch your topic with ease and precision using this Lean Operational Excellence Strategy Manufacturing Dashboard To Check Production System Efficiency Pictures PDF. This layout presents information on Loading, Availability, Performance. It is also available for immediate download and adjustment. So, changes can be made in the color, design, graphics or any other component to create a unique layout.


This slide covers dashboard providing an insight related to how subscribers and resonating with email marketing campaign. It key performance metrics such as sessions from email, sessions from email by campaign, sessions by email by date etc. This Implementing Management System To Enhance Ecommerce Processes Email Campaign Performance KPI Dashboard Download PDF from Slidegeeks makes it easy to present information on your topic with precision. It provides customization options, so you can make changes to the colors, design, graphics, or any other component to create a unique layout. It is also available for immediate download, so you can begin using it right away. Slidegeeks has done good research to ensure that you have everything you need to make your presentation stand out. Make a name out there for a brilliant performance.


This slide represents the dashboard to analyze and monitor the performance of ecommerce website. It includes key metrics such as transactions, revenue, users and sessions, ecommerce rate, revenue by channels etc. Here you can discover an assortment of the finest PowerPoint and Google Slides templates. With these templates, you can create presentations for a variety of purposes while simultaneously providing your audience with an eye catching visual experience. Download Implementing Management System To Enhance Ecommerce Processes Ecommerce Website Performance Overview Dashboard Slides PDF to deliver an impeccable presentation. These templates will make your job of preparing presentations much quicker, yet still, maintain a high level of quality. Slidegeeks has experienced researchers who prepare these templates and write high quality content for you. Later on, you can personalize the content by editing the Implementing Management System To Enhance Ecommerce Processes Ecommerce Website Performance Overview Dashboard Slides PDF.


This slide covers stock and inventory management KPI dashboard. It involves details such as percentage of out of stock, inventory and cost, stock days of supply and product details. This KPI Dashboard To Optimize Inventory Management System Structure PDF from Slidegeeks makes it easy to present information on your topic with precision. It provides customization options, so you can make changes to the colors, design, graphics, or any other component to create a unique layout. It is also available for immediate download, so you can begin using it right away. Slidegeeks has done good research to ensure that you have everything you need to make your presentation stand out. Make a name out there for a brilliant performance.


The following slide showcases dashboard outlining companys revenue and expenses along with customer growth. It presents information related to payment status, growth , etc. Pitch your topic with ease and precision using this Profit And Loss Dashboard For Managing Accounting Control System Information PDF. This layout presents information on Consumer Growth, Expenses By Category, Overall Outstanding Revenue. It is also available for immediate download and adjustment. So, changes can be made in the color, design, graphics or any other component to create a unique layout.


The following slide showcases model for enabling control of accounts. It presents information related to long term planning, investment plans, profit estimated, etc. Pitch your topic with ease and precision using this Accounting KPI Dashboard To Control System Financial Performance Formats PDF. This layout presents information on Sales Outstanding, Payable Outstanding, Sales Inventory. It is also available for immediate download and adjustment. So, changes can be made in the color, design, graphics or any other component to create a unique layout.


This slide shows the dashboard of product information management system. It highlights information related to profit and loss, net income, expenses etc. along with order status of products. Showcasing this set of slides titled Product Overview Management System Dashboard Showing Profit And Loss Themes PDF. The topics addressed in these templates are Profit Loss, Order Status, Expenses. All the content presented in this PPT design is completely editable. Download it and make adjustments in color, background, font etc. as per your unique business setting.


This slide showcases dashboard that can help organization to track the major information security risks and resolve them in timely manner. Its key components are risk rating breakdown, heat map, action plan and top 5 vulnerabilities. The best PPT templates are a great way to save time, energy, and resources. Slidegeeks have 100 percent editable powerpoint slides making them incredibly versatile. With these quality presentation templates, you can create a captivating and memorable presentation by combining visually appealing slides and effectively communicating your message. Download Information Systems Security And Risk Management Plan Risk Management Dashboard For Information Security Pictures PDF from Slidegeeks and deliver a wonderful presentation.


This slide showcases dashboard that can help organization in managing the data security risks. Its key elements are enterprise risk, risk by objectives, data protection finding and overdue actions by status. If you are looking for a format to display your unique thoughts, then the professionally designed Information Systems Security And Risk Management Plan Dashboard For Data Security Risk Management Information PDF is the one for you. You can use it as a Google Slides template or a PowerPoint template. Incorporate impressive visuals, symbols, images, and other charts. Modify or reorganize the text boxes as you desire. Experiment with shade schemes and font pairings. Alter, share or cooperate with other people on your work. Download Information Systems Security And Risk Management Plan Dashboard For Data Security Risk Management Information PDF and find out how to give a successful presentation. Present a perfect display to your team and make your presentation unforgettable.


This slide showcases the KPIs that would help a business organization to evaluate improvements in the new production planning and control system. It includes total production, defective production, production rate, average cycle duration, etc. Here you can discover an assortment of the finest PowerPoint and Google Slides templates. With these templates, you can create presentations for a variety of purposes while simultaneously providing your audience with an eye-catching visual experience. Download Effective Manufacturing Planning And Control Administration System Dashboard To Measure Product Pictures PDF to deliver an impeccable presentation. These templates will make your job of preparing presentations much quicker, yet still, maintain a high level of quality. Slidegeeks has experienced researchers who prepare these templates and write high-quality content for you. Later on, you can personalize the content by editing the Effective Manufacturing Planning And Control Administration System Dashboard To Measure Product Pictures PDF.


This slide covers KPI dashboard to track system performance. It involves detail such as total number of assets, value of assets and purchases in fiscal year. Get a simple yet stunning designed ATS Administration To Improve Asset Management Dashboard To Track System Guidelines PDF. It is the best one to establish the tone in your meetings. It is an excellent way to make your presentations highly effective. So, download this PPT today from Slidegeeks and see the positive impacts. Our easy-to-edit ATS Administration To Improve Asset Management Dashboard To Track System Guidelines PDF can be your go-to option for all upcoming conferences and meetings. So, what are you waiting for Grab this template today.
This slide showcases a dashboard for managing and tracking warehouse productivity to optimize operational process. It includes key components such as user registered, subscribers request, orders, sales, transaction summary and top profiles. Showcasing this set of slides titled Storage Facility Productivity Tracking And Management System Dashboard Diagrams PDF. The topics addressed in these templates are Transaction Summary, Registered Users, Tracking Management. All the content presented in this PPT design is completely editable. Download it and make adjustments in color, background, font etc. as per your unique business setting.


This slide showcases dashboard to review bank transactions and activities. It provides information about credit, check, ATM, debit card, transaction volume, decline rate, visa, maestro, network end points, etc. This KYC Transaction Monitoring System Business Security Dashboard To Monitor Bank Transactions Mockup PDF from Slidegeeks makes it easy to present information on your topic with precision. It provides customization options, so you can make changes to the colors, design, graphics, or any other component to create a unique layout. It is also available for immediate download, so you can begin using it right away. Slidegeeks has done good research to ensure that you have everything you need to make your presentation stand out. Make a name out there for a brilliant performance.
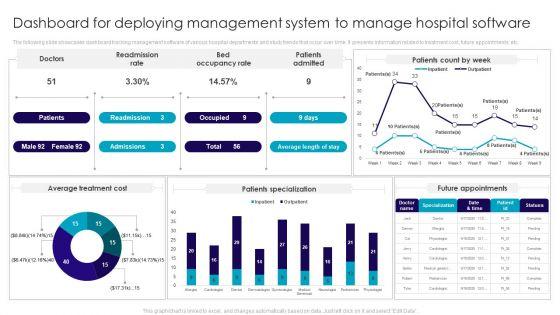
The following slide showcases dashboard tracking management software of various hospital departments and study trends that occur over time. It presents information related to treatment cost, future appointments, etc. Showcasing this set of slides titled Dashboard For Deploying Management System To Manage Hospital Software Inspiration PDF. The topics addressed in these templates are Average Treatment Cost, Patients Specialization, Future Appointments. All the content presented in this PPT design is completely editable. Download it and make adjustments in color, background, font etc. as per your unique business setting.
This slide shows the dashboard to keep a track of the performance of recommender systems. The purpose of this slide is to provide a graphical representation of recommendation engines performance to enhance the accuracy and effectiveness of the system.Find highly impressive Recommender Systems Performance Tracking Dashboard Integrating Recommender System To Enhance Guidelines PDF on Slidegeeks to deliver a meaningful presentation. You can save an ample amount of time using these presentation templates. No need to worry to prepare everything from scratch because Slidegeeks experts have already done a huge research and work for you. You need to download Recommender Systems Performance Tracking Dashboard Integrating Recommender System To Enhance Guidelines PDF for your upcoming presentation. All the presentation templates are 100 precent editable and you can change the color and personalize the content accordingly. Download now.


This slide covers the dashboards to measure performance of various distribution strategies of the organization. This includes partner performance dashboards, top products by revenue, sales by location etc. Present like a pro with Omnichannel Distribution System To Satisfy Customer Needs Dashboards To Measure Performance Of Distribution Channels Brochure PDF Create beautiful presentations together with your team, using our easy-to-use presentation slides. Share your ideas in real-time and make changes on the fly by downloading our templates. So whether you are in the office, on the go, or in a remote location, you can stay in sync with your team and present your ideas with confidence. With Slidegeeks presentation got a whole lot easier. Grab these presentations today.


If you are looking for a format to display your unique thoughts, then the professionally designed Risk Evaluation Of Information Technology Systems IT Risk Management Dashboard Highlighting Network Devices Server Status Professional PDF is the one for you. You can use it as a Google Slides template or a PowerPoint template. Incorporate impressive visuals, symbols, images, and other charts. Modify or reorganize the text boxes as you desire. Experiment with shade schemes and font pairings. Alter, share or cooperate with other people on your work. Download Risk Evaluation Of Information Technology Systems IT Risk Management Dashboard Highlighting Network Devices Server Status Professional PDF and find out how to give a successful presentation. Present a perfect display to your team and make your presentation unforgettable.


This slide highlights the enterprise information technology risk management reporting dashboard which includes risk rating breakdown risk heat map, action plan breakdown and thresholds. From laying roadmaps to briefing everything in detail, our templates are perfect for you. You can set the stage with your presentation slides. All you have to do is download these easy-to-edit and customizable templates. Risk Evaluation Of Information Technology Systems Enterprise IT Risk Management Reporting Dashboard Formats PDF will help you deliver an outstanding performance that everyone would remember and praise you for. Do download this presentation today.


This slide represents the dashboard for the parallel processing system. It includes the monitoring of the processor by covering details of CPU utilization by devices, processes, processes by CPU utilization, heatmap, and the maximum number of minimum, maximum and average CPU utilizes. Crafting an eye catching presentation has never been more straightforward. Let your presentation shine with this tasteful yet straightforward Dashboard For Parallel Processing System Ppt PowerPoint Presentation File Pictures PDF template. It offers a minimalistic and classy look that is great for making a statement. The colors have been employed intelligently to add a bit of playfulness while still remaining professional. Construct the ideal Dashboard For Parallel Processing System Ppt PowerPoint Presentation File Pictures PDF that effortlessly grabs the attention of your audience Begin now and be certain to wow your customers.


This slide represents the dashboard for the parallel processing system. It includes the monitoring of the processor by covering details of CPU utilization by devices, processes, processes by CPU utilization, heatmap, and the maximum number of minimum, maximum and average CPU utilizes. Crafting an eye catching presentation has never been more straightforward. Let your presentation shine with this tasteful yet straightforward Dashboard For Parallel Processing System Ppt PowerPoint Presentation File Portfolio PDF template. It offers a minimalistic and classy look that is great for making a statement. The colors have been employed intelligently to add a bit of playfulness while still remaining professional. Construct the ideal Dashboard For Parallel Processing System Ppt PowerPoint Presentation File Portfolio PDF that effortlessly grabs the attention of your audience Begin now and be certain to wow your customers.


This slide covers cost analysis for implementing automation procurement tools in logistics and supply chain management. It involves optimization tools, cost involved on monthly basis and its impact on operations. Get a simple yet stunning designed Dashboard To Analyze Impact Of Warehouse Management System Infographics PDF. It is the best one to establish the tone in your meetings. It is an excellent way to make your presentations highly effective. So, download this PPT today from Slidegeeks and see the positive impacts. Our easy-to-edit Dashboard To Analyze Impact Of Warehouse Management System Infographics PDF can be your go-to option for all upcoming conferences and meetings. So, what are you waiting for. Grab this template today.
This slide showcases dashboard which can assists HRs in tracking application status of multiple candidates. It provides details about active jobs, lead generation, referrals, acceptance status, interviews taken, offers granted, hire source, etc. Do you have to make sure that everyone on your team knows about any specific topic I yes, then you should give Improving Technology Based Candidate Application Tracking System Dashboard Download PDF a try. Our experts have put a lot of knowledge and effort into creating this impeccable Improving Technology Based Candidate Application Tracking System Dashboard Download PDF. You can use this template for your upcoming presentations, as the slides are perfect to represent even the tiniest detail. You can download these templates from the Slidegeeks website and these are easy to edit. So grab these today.


This slide illustrates information technology IT service desk management dashboard. It provides information about active incidents by state, service level management, applications, hardware, computers by site, customer satisfaction, etc. Welcome to our selection of the Help Desk Ticketing IT Service Desk Ticket Management System Dashboard Microsoft PDF. These are designed to help you showcase your creativity and bring your sphere to life. Planning and Innovation are essential for any business that is just starting out. This collection contains the designs that you need for your everyday presentations. All of our PowerPoints are 100 percent editable, so you can customize them to suit your needs. This multi-purpose template can be used in various situations. Grab these presentation templates today.


This slide displays security metrics for company which includes number of critical incidents, cost, type, days since last accident to keep a track of Improvement needed in security performance. Pitch your topic with ease and precision using this Safety Risk Management System Dashboard With Severity And Injury Consequence Clipart PDF. This layout presents information on Severity, Type Of Incident, Injury Consequence . It is also available for immediate download and adjustment. So, changes can be made in the color, design, graphics or any other component to create a unique layout.


This slide depicts the dashboard for the software-defined network by covering details of bandwidth administrator, traffic quality, active flows, development tools, completed tasks, wide-area network bandwidth, and G drive. There are so many reasons you need a Deploying SDN System Dashboard For Software Defined Networking SDN Brochure PDF. The first reason is you cant spend time making everything from scratch, Thus, Slidegeeks has made presentation templates for you too. You can easily download these templates from our website easily.


This slide shows the dashboard of financial asset management representing total accounts receivable and payable, equity and debt ratio, profit and loss summary, net working capital etc. Showcasing this set of slides titled Financial Asset Management System Dashboard Showing Debt And Equity Ratio Graphics PDF. The topics addressed in these templates are Financial Asset, Management System, Debt And Equity Ratio. All the content presented in this PPT design is completely editable. Download it and make adjustments in color, background, font etc. as per your unique business setting.

This slide represents the financial asset management dashboard showing quick and current ratio, cash balance, days sales outstanding and payables with the help of bar graphs. Pitch your topic with ease and precision using this Financial Asset Management System Dashboard Showing Cash Balance Download PDF. This layout presents information on Financial Asset, Management System, Dashboard Showing, Cash Balance. It is also available for immediate download and adjustment. So, changes can be made in the color, design, graphics or any other component to create a unique layout.
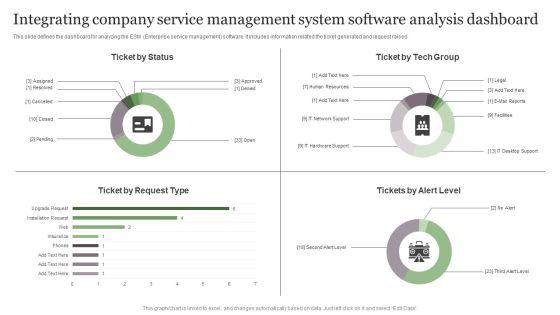

This slide defines the dashboard for analyzing the ESM Enterprise service management software. It includes information related the ticket generated and request raised. Showcasing this set of slides titled Integrating Company Service Management System Software Analysis Dashboard Graphics PDF. The topics addressed in these templates are Ticket By Status, Ticket Request Type, Ticket Tech Group. All the content presented in this PPT design is completely editable. Download it and make adjustments in color, background, font etc. as per your unique business setting.


This slide represents the dashboard showing the key performance indicators related to the profit and loss incurred in fleet management. Showcasing this set of slides titled Vehicle Management System Profit And Loss Dashboard Brochure PDF. The topics addressed in these templates are Vehicle Management System, Profit And Loss Dashboard. All the content presented in this PPT design is completely editable. Download it and make adjustments in color, background, font etc. as per your unique business setting.


This slide represents the dashboard showing real time data of fleet management to cut down operational costs and improve efficiency. It includes key metrics such as vehicles with errors, warnings, deviation from route, total vehicles, vehicles condition etc. Pitch your topic with ease and precision using this Vehicle Management System KPI Dashboard Introduction PDF. This layout presents information on Vehicle Management System, KPI Dashboard. It is also available for immediate download and adjustment. So, changes can be made in the color, design, graphics or any other component to create a unique layout.


This slide represents the dashboard to help fleet managers to monitor the vehicles and the drivers in real-time. It represents KPIs such as vehicle status, service reminders, open issues, inspections summary, service costs etc. Pitch your topic with ease and precision using this Vehicle Management System Dashboard Graphics PDF. This layout presents information on Vehicle Management System, Representing Maintenance Status. It is also available for immediate download and adjustment. So, changes can be made in the color, design, graphics or any other component to create a unique layout.


This slide represents the dashboard representing the key metrics of the vehicle management system to monitor the vehicles and drivers in real-time. It includes key metrics such as service reminders, fuel costs, open issues, recent comments etc. Pitch your topic with ease and precision using this Vehicle Management System Dashboard Representing Maintenance Status Template PDF This layout presents information on Fuel Costs, Total Cost, Service Reminder, Recent Comments. It is also available for immediate download and adjustment. So, changes can be made in the color, design, graphics or any other component to create a unique layout.


This slide represents the dashboard for the parallel processing system. It includes the monitoring of the processor by covering details of CPU utilization by devices, processes, processes by CPU utilization, heatmap, and the maximum number of minimum, maximum and average CPU utilizes. Want to ace your presentation in front of a live audience Our Integrating Parallel Processor System Dashboard For Parallel Processing System Brochure PDF can help you do that by engaging all the users towards you.. Slidegeeks experts have put their efforts and expertise into creating these impeccable powerpoint presentations so that you can communicate your ideas clearly. Moreover, all the templates are customizable, and easy-to-edit and downloadable. Use these for both personal and commercial use.


This slide shows the dashboard which can be used by organization to monitor cloud security. It includes metrics overall progress, risk identified, number of critical incidents, initiatives, incident and threat management etc. Showcasing this set of slides titled KPI Dashboard To Track Performance Of Security For Cloud Based Systems Clipart PDF. The topics addressed in these templates are Kpi Dashboard To Track, Performance Of Security, Cloud Based Systems . All the content presented in this PPT design is completely editable. Download it and make adjustments in color, background, font etc. as per your unique business setting.
This slide represents the dashboard to track the progress of software implementation project. It includes details related to health, tasks, project, time, cost and workload of software implementation project. Take your projects to the next level with our ultimate collection of System Deployment Project Software Implementation Project Progress Tracking Dashboard Structure PDF. Slidegeeks has designed a range of layouts that are perfect for representing task or activity duration, keeping track of all your deadlines at a glance. Tailor these designs to your exact needs and give them a truly corporate look with your own brand colors theyll make your projects stand out from the rest


This slide represents the dashboard to track and measure the performance of sales dashboard. It includes details related to KPIs such as sales activity, product details, purchase order etc. Welcome to our selection of the System Deployment Project Sales Software Performance Measurement Dashboard Summary PDF. These are designed to help you showcase your creativity and bring your sphere to life. Planning and Innovation are essential for any business that is just starting out. This collection contains the designs that you need for your everyday presentations. All of our PowerPoints are 100 percent editable, so you can customize them to suit your needs. This multi-purpose template can be used in various situations. Grab these presentation templates today.


This slide represents the dashboard to track and measure the performance and efficiency of digital marketing software. It includes details related to KPIs such as social media followers, Facebook demographics etc. If you are looking for a format to display your unique thoughts, then the professionally designed System Deployment Project Digital Marketing Software Key Metrics Dashboard Graphics PDF is the one for you. You can use it as a Google Slides template or a PowerPoint template. Incorporate impressive visuals, symbols, images, and other charts. Modify or reorganize the text boxes as you desire. Experiment with shade schemes and font pairings. Alter, share or cooperate with other people on your work. Download System Deployment Project Digital Marketing Software Key Metrics Dashboard Graphics PDF and find out how to give a successful presentation. Present a perfect display to your team and make your presentation unforgettable.


This slide represents the dashboard showing details related to customer relationship management software. It includes details related to outbound sales, contracts closed, average contract value etc. Present like a pro with System Deployment Project Customer Relationship Management Software Kpi Dashboard Rules PDF Create beautiful presentations together with your team, using our easy-to-use presentation slides. Share your ideas in real-time and make changes on the fly by downloading our templates. So whether youre in the office, on the go, or in a remote location, you can stay in sync with your team and present your ideas with confidence. With Slidegeeks presentation got a whole lot easier. Grab these presentations today.


This slide depicts the dashboard for content delivery network which projects the usage of resources, increase in data transfer and usage of CDN. Find highly impressive Deploying Content Distribution Network System Dashboard For Content Delivery Network Mockup PDF on Slidegeeks to deliver a meaningful presentation. You can save an ample amount of time using these presentation templates. No need to worry to prepare everything from scratch because Slidegeeks experts have already done a huge research and work for you. You need to download Deploying Content Distribution Network System Dashboard For Content Delivery Network Mockup PDF for your upcoming presentation. All the presentation templates are 100 percent editable and you can change the color and personalize the content accordingly. Download now


The following slide showcases vendor risk assessment and headcount dashboard. It provides information about vendor onboarding, high risk vendors, vendor spend, active vendors, vendor risk rating, etc. Do you have to make sure that everyone on your team knows about any specific topic I yes, then you should give Vendor Risk Assessment And Headcount Dashboard Vendor Management System Deployment Elements PDF a try. Our experts have put a lot of knowledge and effort into creating this impeccable Vendor Risk Assessment And Headcount Dashboard Vendor Management System Deployment Elements PDF. You can use this template for your upcoming presentations, as the slides are perfect to represent even the tiniest detail. You can download these templates from the Slidegeeks website and these are easy to edit. So grab these today


The following slide showcases vendor risk assessment and headcount dashboard. It provides information about vendor onboarding, high risk vendors, vendor spend, active vendors, vendor risk rating, etc. Retrieve professionally designed Vendor Contracts And Compliance Management Dashboard Vendor Management System Deployment Portrait PDF to effectively convey your message and captivate your listeners. Save time by selecting pre-made slideshows that are appropriate for various topics, from business to educational purposes. These themes come in many different styles, from creative to corporate, and all of them are easily adjustable and can be edited quickly. Access them as PowerPoint templates or as Google Slides themes. You do not have to go on a hunt for the perfect presentation because Slidegeeks got you covered from everywhere.
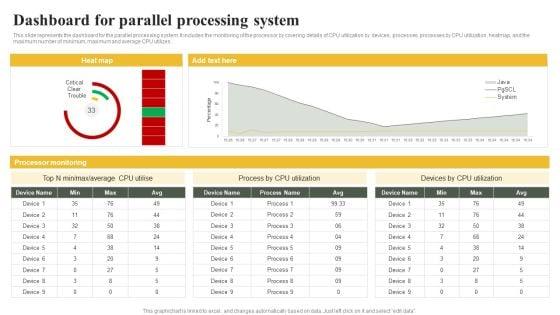
This slide represents the dashboard for the parallel processing system. It includes the monitoring of the processor by covering details of CPU utilization by devices, processes, processes by CPU utilization, heatmap, and the maximum number of minimum, maximum and average CPU utilizes.Create an editable Parallel Computing System To Enhance Process Efficiency Dashboard For Parallel Processing System Graphics PDF that communicates your idea and engages your audience. Whether you are presenting a business or an educational presentation, pre-designed presentation templates help save time. Parallel Computing System To Enhance Process Efficiency Dashboard For Parallel Processing System Graphics PDF is highly customizable and very easy to edit, covering many different styles from creative to business presentations. Slidegeeks has creative team members who have crafted amazing templates. So, go and get them without any delay.
This slide represents the dashboard for tracking the key performance indicators of sales lead to revenue management. It includes key metrics such as leads by campaign, ratings, lead generation rate, top accounts by revenue and top owners by number of accounts. Showcasing this set of slides titled Sales L2RM System Tracking Key Metrics Dashboard Ppt Professional Format Ideas PDF. The topics addressed in these templates are Leads By Campaign, Leads By Rating, Leads Generation Rate. All the content presented in this PPT design is completely editable. Download it and make adjustments in color, background, font etc. as per your unique business setting.


This slide represents the dashboard showing the analysis of omnichannel banking performance. It includes details related to last week summary, transaction volume and value over time etc. Showcasing this set of slides titled Multichannel Banking System Performance Analysis Dashboard Ppt Pictures Background Designs PDF. The topics addressed in these templates are Last Week Summary, Transaction Volume, Over Time. All the content presented in this PPT design is completely editable. Download it and make adjustments in color, background, font etc. as per your unique business setting.


This slide defines the dashboard analyzing the human resource HR audit based on the headcount. It includes information related to the gender wise position, monthly and function based headcount. Showcasing this set of slides titled Human Resource Audit System Functional Analysis Dashboard Sample PDF. The topics addressed in these templates are Human Resource Audit System, Functional Analysis Dashboard. All the content presented in this PPT design is completely editable. Download it and make adjustments in color, background, font etc. as per your unique business setting.


This slide covers enterprise security operation incident management kpi dashboard. It involves details such as average resolution time, new incidents, incident status and new incidents by category. Pitch your topic with ease and precision using this ESO System Incident Management KPI Dashboard Ppt PowerPoint Presentation File Graphic Images PDF. This layout presents information on Average Resolution Time, Incident Status, New Incidents. It is also available for immediate download and adjustment. So, changes can be made in the color, design, graphics or any other component to create a unique layout.


This slide covers kpi dashboard for enterprise security operations. It involves details such as active alerts, active automated investigation, devices with major issues and report of daily devices. Pitch your topic with ease and precision using this KPI Dashboard For ESO System Ppt PowerPoint Presentation File Template PDF. This layout presents information on Security Health, Misconfigured, Service Operating Normally. It is also available for immediate download and adjustment. So, changes can be made in the color, design, graphics or any other component to create a unique layout.


This slide depicts dashboard post DSDM implementation that shows the growth of projects after implementing DSDM in business.Here you can discover an assortment of the finest PowerPoint and Google Slides templates. With these templates, you can create presentations for a variety of purposes while simultaneously providing your audience with an eye-catching visual experience. Download Overall Growth Dashboard Post DSDM Implementation Integration Of Dynamic System To Enhance Processes Designs PDF to deliver an impeccable presentation. These templates will make your job of preparing presentations much quicker, yet still, maintain a high level of quality. Slidegeeks has experienced researchers who prepare these templates and write high-quality content for you. Later on, you can personalize the content by editing the Overall Growth Dashboard Post DSDM Implementation Integration Of Dynamic System To Enhance Processes Designs PDF.


This slide depicts dashboard post DSDM implementation that shows the growth of projects after implementing DSDM in business.If your project calls for a presentation, then Slidegeeks is your go-to partner because we have professionally designed, easy-to-edit templates that are perfect for any presentation. After downloading, you can easily edit Overall Growth Dashboard Post DSDM Implementation Dynamic System Development Model Pictures PDF and make the changes accordingly. You can rearrange slides or fill them with different images. Check out all the handy templates.
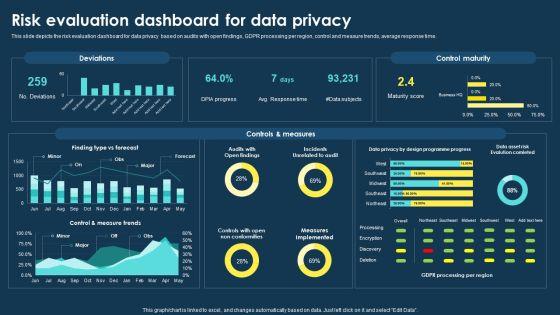
This slide depicts the risk evaluation dashboard for data privacy based on audits with open findings, GDPR processing per region, control and measure trends, average response time. Do you have to make sure that everyone on your team knows about any specific topic I yes, then you should give Integrating Data Privacy System Risk Evaluation Dashboard For Data Privacy Guidelines PDF a try. Our experts have put a lot of knowledge and effort into creating this impeccable Integrating Data Privacy System Risk Evaluation Dashboard For Data Privacy Guidelines PDF. You can use this template for your upcoming presentations, as the slides are perfect to represent even the tiniest detail. You can download these templates from the Slidegeeks website and these are easy to edit. So grab these today.
SHOW
- 60
- 120
- 180
DISPLAYING: 60 of 203 Item(s)
Page