 AI PPT Maker
 Templates
 PPT Bundles
 Design Services
 Business PPTs
 Business Plan
 Management
 Strategy
 Introduction PPT
 Roadmap
 Self Introduction
 Timelines
 Process
 Marketing
 Agenda
 Technology
 Medical
 Startup Business Plan
 Cyber Security
 Dashboards
 SWOT
SWOT Proposals
 Education
 Pitch Deck
 Digital Marketing
 KPIs
KPIs Project Management
 Product Management
 Artificial Intelligence
 Target Market
 Communication
 Supply Chain
 Google Slides
 Research Services
 One Pagers
 All Categories
Structured dashboard PowerPoint Presentation Templates and Google Slides
SHOW
- 60
- 120
- 180
DISPLAYING: 60 of 239 Item(s)
Page


Presenting this set of slides with name digital marketing summary dashboard ppt powerpoint presentation ideas structure. The topics discussed in these slides are finance, marketing, management, investment, analysis. This is a completely editable PowerPoint presentation and is available for immediate download. Download now and impress your audience.


This slide covers the dashboard which can be used to monitor the server count, geo activity, processor, memory space, network security, etc. Formulating a presentation can take up a lot of effort and time, so the content and message should always be the primary focus. The visuals of the PowerPoint can enhance the presenters message, so our Infrastructure Monitoring Dashboard Structure PDF was created to help save time. Instead of worrying about the design, the presenter can concentrate on the message while our designers work on creating the ideal templates for whatever situation is needed. Slidegeeks has experts for everything from amazing designs to valuable content, we have put everything into Infrastructure Monitoring Dashboard Structure PDF.


This slide covers the dashboard for analyzing fast food business sales by location. It includes KPIs such as the companys revenue by location, by type, top 5 expenses by account, top 5 expenses by department, cost of revenue year to date, etc. If your project calls for a presentation, then Slidegeeks is your go to partner because we have professionally designed, easy to edit templates that are perfect for any presentation. After downloading, you can easily edit Planning Transnational Technique To Improve International Scope Dashboard Tracking Post Expansion Revenue Structure PDF and make the changes accordingly. You can rearrange slides or fill them with different images. Check out all the handy templates


This slide provides information regarding dashboard to monitor critical activities related to IT in terms of incident tracker, outage report, IT spend per employee, application trends, etc. Formulating a presentation can take up a lot of effort and time, so the content and message should always be the primary focus. The visuals of the PowerPoint can enhance the presenters message, so our Deploying Corporate Aligned IT Strategy Dashboard To Track Essential Activities Associated With IT Department Structure PDF was created to help save time. Instead of worrying about the design, the presenter can concentrate on the message while our designers work on creating the ideal templates for whatever situation is needed. Slidegeeks has experts for everything from amazing designs to valuable content, we have put everything into Deploying Corporate Aligned IT Strategy Dashboard To Track Essential Activities Associated With IT Department Structure PDF


Mentioned slide demonstrates KPI showcasing email marketing performance which can be used by businesses to determine organisation future growth opportunities. It includes key performance indictors such as conversion rate, open rate, click through rate, bounce rate, and email list growth rate. Make sure to capture your audiences attention in your business displays with our gratis customizable Customer Retention With Email Advertising Campaign Plan KPI Dashboard To Monitor Email Marketing Structure PDF. These are great for business strategies, office conferences, capital raising or task suggestions. If you desire to acquire more customers for your tech business and ensure they stay satisfied, create your own sales presentation with these plain slides.


This slide represents brand promotion dashboard highlighting performance post digital marketing. It includes sales quantity, return quantity, cost of goods, return amount etc. There are so many reasons you need a Online Advertising Campaign For Brand Recognition Metric Dashboard Showcasing Brand Performance Structure PDF. The first reason is you cannot spend time making everything from scratch, Thus, Slidegeeks has made presentation templates for you too. You can easily download these templates from our website easily.


This slide showcases the dashboard to track and monitor performance of CPA marketing campaign. It incorporates metrics such as link clicks, CTR, marketing cost, overall CPA cost, website conversion rate, overall conversion rate, advertising sources, etc. Presenting this PowerPoint presentation, titled Significance Of CPA To Maximize Digital Marketing ROI Dashboard To Monitor CPA Marketing Campaign Structure PDF, with topics curated by our researchers after extensive research. This editable presentation is available for immediate download and provides attractive features when used. Download now and captivate your audience. Presenting this Significance Of CPA To Maximize Digital Marketing ROI Dashboard To Monitor CPA Marketing Campaign Structure PDF. Our researchers have carefully researched and created these slides with all aspects taken into consideration. This is a completely customizable Significance Of CPA To Maximize Digital Marketing ROI Dashboard To Monitor CPA Marketing Campaign Structure PDF that is available for immediate downloading. Download now and make an impact on your audience. Highlight the attractive features available with our PPTs.


This slide showcases dashboard which can help fleet managers in carefully monitoring their vehicle status. It provides details about vehicle conditions, free vehicles, moving vehicles, insurance, permit, license validity, trip alerts, etc. Here you can discover an assortment of the finest PowerPoint and Google Slides templates. With these templates, you can create presentations for a variety of purposes while simultaneously providing your audience with an eye-catching visual experience. Download Vehicle Maintenance Dashboard Indicating Trips And Compliances Structure PDF to deliver an impeccable presentation. These templates will make your job of preparing presentations much quicker, yet still, maintain a high level of quality. Slidegeeks has experienced researchers who prepare these templates and write high-quality content for you. Later on, you can personalize the content by editing the Vehicle Maintenance Dashboard Indicating Trips And Compliances Structure PDF.


The slide highlights the market research process results on customer satisfaction. It reflects the already-existing customers and their perception of their relationship with the brand. It includes the customer satisfaction score and net promoter score for September. Showcasing this set of slides titled Customer Demographics Dashboard After Market Research Steps Structure PDF. The topics addressed in these templates are Total, Consent, Education. All the content presented in this PPT design is completely editable. Download it and make adjustments in color, background, font etc. as per your unique business setting.


This slide covers stock and inventory management KPI dashboard. It involves details such as percentage of out of stock, inventory and cost, stock days of supply and product details. This KPI Dashboard To Optimize Inventory Management System Structure PDF from Slidegeeks makes it easy to present information on your topic with precision. It provides customization options, so you can make changes to the colors, design, graphics, or any other component to create a unique layout. It is also available for immediate download, so you can begin using it right away. Slidegeeks has done good research to ensure that you have everything you need to make your presentation stand out. Make a name out there for a brilliant performance.


Mentioned slide showcases KPI dashboard that can be used to check the financial performance of a brand. Metrics covered in the dashboard are return on assets, working capital ratio, return on equity etc. Take your projects to the next level with our ultimate collection of Comprehensive Guide To Strengthen Brand Equity Financial KPI Dashboard Measure Brand Structure PDF. Slidegeeks has designed a range of layouts that are perfect for representing task or activity duration, keeping track of all your deadlines at a glance. Tailor these designs to your exact needs and give them a truly corporate look with your own brand colors they will make your projects stand out from the rest


Following slide presents a strategic dashboard which can be used by business organizations to track the progress of drug launch in the market. The key tasks are drug development, fund generation, testing, clinical trials, promotion, launch, feedback generation among many others. Pitch your topic with ease and precision using this Strategic Dashboard To Track The Progress Of Drug Launch Structure PDF. This layout presents information on Drug Development, Fund Generation, Testing, Clinical Trials, Promotion, Launch, Feedback Generation. It is also available for immediate download and adjustment. So, changes can be made in the color, design, graphics or any other component to create a unique layout.


The following slide illustrates the project portfolio management software which showcases allocated budget and used budget with estimated and actual costs. Showcasing this set of slides titled Software Project Portfolio Management Dashboard With Budget And Costs Structure PDF. The topics addressed in these templates are Allocated Budget, Used Budget, Used Budget Percentage. All the content presented in this PPT design is completely editable. Download it and make adjustments in color, background, font etc. as per your unique business setting.
This slide provides information regarding corporate branding performance tracking dashboard in terms of leads, conversion metrics, web traffic, etc. Whether you have daily or monthly meetings, a brilliant presentation is necessary. Optimize Brand Valuation Corporate Branding Performance Tracking Dashboard Structure PDF can be your best option for delivering a presentation. Represent everything in detail using Optimize Brand Valuation Corporate Branding Performance Tracking Dashboard Structure PDF and make yourself stand out in meetings. The template is versatile and follows a structure that will cater to your requirements. All the templates prepared by Slidegeeks are easy to download and edit. Our research experts have taken care of the corporate themes as well. So, give it a try and see the results.


This slide highlights the banking operation strategy dashboard which showcases current account and saving account growth rate, savings account deposits, current account deposits and retail term deposits. Here you can discover an assortment of the finest PowerPoint and Google Slides templates. With these templates, you can create presentations for a variety of purposes while simultaneously providing your audience with an eye catching visual experience. Download Banking Operation Strategy Dashboard Highlighting Deposits And Growth Rate Structure PDF to deliver an impeccable presentation. These templates will make your job of preparing presentations much quicker, yet still, maintain a high level of quality. Slidegeeks has experienced researchers who prepare these templates and write high quality content for you. Later on, you can personalize the content by editing the Banking Operation Strategy Dashboard Highlighting Deposits And Growth Rate Structure PDF.


The following slide showcases performance key performance indicator KPI dashboard through which marketing team can measure social media campaign performance. The KPIs highlighted are YouTube channel views, Facebook daily reach, LinkedIn clicks and likes, etc. Explore a selection of the finest Comprehensive Guide To Build Marketing Marketing Analytics Dashboard To Evaluate Structure PDF here. With a plethora of professionally designed and pre-made slide templates, you can quickly and easily find the right one for your upcoming presentation. You can use our Comprehensive Guide To Build Marketing Marketing Analytics Dashboard To Evaluate Structure PDF to effectively convey your message to a wider audience. Slidegeeks has done a lot of research before preparing these presentation templates. The content can be personalized and the slides are highly editable. Grab templates today from Slidegeeks.


This slide represents the dashboard for twitter competition analysis providing information regarding published tweets in terms of original, links, pictures, videos etc. It also covers details of tweet likes, retweets, mentions, replies etc. Make sure to capture your audiences attention in your business displays with our gratis customizable Utilizing Twitter For Social Media Dashboard For Twitter Competition Analysis Structure PDF. These are great for business strategies, office conferences, capital raising or task suggestions. If you desire to acquire more customers for your tech business and ensure they stay satisfied, create your own sales presentation with these plain slides.


This slide shows statistical report to address drop in the quality of products in a company and to keep track of total defected output. It includes information about notice of improvement, work discipline, NCR classification, etc. Showcasing this set of slides titled Quality Kpis Project Management With Non Conformance Dashboard Structure PDF. The topics addressed in these templates are Quality Kpis Project Management, Non Conformance Dashboard. All the content presented in this PPT design is completely editable. Download it and make adjustments in color, background, font etc. as per your unique business setting.

This slide shows the dashboard that depicts customer service insights which includes number of solved tickets, average resolution and response time, customer feedback, total visitors and chats. There are so many reasons you need a Enhancing Client Engagement Dashboard Depicting Customer Service Insights Structure PDF. The first reason is you cant spend time making everything from scratch, Thus, Slidegeeks has made presentation templates for you too. You can easily download these templates from our website easily.


This slide represents dashboard to measure customer service performance. It includes number of issues, average time to close, average response time etc. Explore a selection of the finest Implementing Digital Customer Service Kpi Dashboard To Measure Customer Service Structure PDF here. With a plethora of professionally designed and pre-made slide templates, you can quickly and easily find the right one for your upcoming presentation. You can use our Implementing Digital Customer Service Kpi Dashboard To Measure Customer Service Structure PDF to effectively convey your message to a wider audience. Slidegeeks has done a lot of research before preparing these presentation templates. The content can be personalized and the slides are highly editable. Grab templates today from Slidegeeks.


This slide presents a dashboard for tracking and monitoring risk status in procurement process. It includes information about suppliers, contracted, unlisted, rate of contract compliance by supplier category, average procurement cycle time, average procurement cycle, total spending, savings, foregone saving, etc. Find a pre designed and impeccable Dashboard For Risk Monitoring And Control In Procurement Process Structure PDF. The templates can ace your presentation without additional effort. You can download these easy to edit presentation templates to make your presentation stand out from others. So, what are you waiting for Download the template from Slidegeeks today and give a unique touch to your presentation.


This slide showcases dashboard that can help organization to track performance of social media advertising campaigns. Its key components are cost per conversion, CTR, link clicks, impressions, conversion rate, click through rate and cost per click. Slidegeeks is one of the best resources for PowerPoint templates. You can download easily and regulate Social Media Promotional Technique Dashboard To Track Social Media Ads Campaign Structure PDF for your personal presentations from our wonderful collection. A few clicks is all it takes to discover and get the most relevant and appropriate templates. Use our Templates to add a unique zing and appeal to your presentation and meetings. All the slides are easy to edit and you can use them even for advertisement purposes.


The following slides highlights the financial kpas in summarized form to evaluate companys annual operating performance. It includes metrics such as gross, operating and net profit margin, income statement, target versus actual EBIT etc. Pitch your topic with ease and precision using this Annual Financial Data With KPI Insights Dashboard Structure PDF. This layout presents information on Gross Profit Margin, Operating Profit Margin, Net Profit Margin. It is also available for immediate download and adjustment. So, changes can be made in the color, design, graphics or any other component to create a unique layout.


This slides showcases dashboard to monitor the progress of Facebook page. It includes elements such as total likes, followers, likes by country, by age , engagement types and Facebook videos views. Pitch your topic with ease and precision using this Facebook Strategies Dashboard To Track Progress Structure PDF. This layout presents information on Followers, Engagement Type, Shares. It is also available for immediate download and adjustment. So, changes can be made in the color, design, graphics or any other component to create a unique layout.
The purpose of this slide is to outline mobile search engine optimization SEO reporting dashboard. It covers different metrics such as web traffic overview, total views, content overview, goal value and conversion etc. There are so many reasons you need a Mobile Search Engine Optimization Plan SEO Reporting Dashboard To Evaluate Website Rank Structure PDF. The first reason is you can not spend time making everything from scratch, Thus, Slidegeeks has made presentation templates for you too. You can easily download these templates from our website easily.


This slide showcases dashboard depicting major customer service KPIs. The performance metrics covered are search exit rate, CSAT, average first response time, tickets solved, etc. There are so many reasons you need a Enhancing Client Experience Dashboard Depicting Performance Metrics Of Customer Service Structure PDF. The first reason is you cant spend time making everything from scratch, Thus, Slidegeeks has made presentation templates for you too. You can easily download these templates from our website easily.


This slide represents the dashboard to monitor production plant efficiency for the multiple shifts. The multiple KPIs covered in dashboard are availability, performance of manufacturing plant machines. It also provides information regarding the total downtime along with good parts yield. There are so many reasons you need a Leveraging Predictive Maintenance To Enhance Production Process Dashboard To Monitor Production Plant Shift Efficiency Structure PDF. The first reason is you cant spend time making everything from scratch, Thus, Slidegeeks has made presentation templates for you too. You can easily download these templates from our website easily.


This slide represents the dashboard to monitor production plant efficiency for the multiple shifts. The multiple KPIs covered in dashboard are availability, performance of manufacturing plant machines. It also provides information regarding the total downtime along with good parts yield. Slidegeeks is one of the best resources for PowerPoint templates. You can download easily and regulate Machine Repairing And Servicing Dashboard To Monitor Production Plant Shift Structure PDF for your personal presentations from our wonderful collection. A few clicks is all it takes to discover and get the most relevant and appropriate templates. Use our Templates to add a unique zing and appeal to your presentation and meetings. All the slides are easy to edit and you can use them even for advertisement purposes.
This template illustrates the KPI dashboard for tracking shipment orders. It also includes shipment analysis based on different KPIs such as ongoing delivery, completed delivery, on-time delivery, actual delivery duration, and variance between expected and actual delivery time. Pitch your topic with ease and precision using this Shipping Delivery Tracking Metrics Analysis Dashboard Structure PDF. This layout presents information on Recipient Country, Completed Deliveries, Delivery Duration. It is also available for immediate download and adjustment. So, changes can be made in the color, design, graphics or any other component to create a unique layout.


This following slide displays the key metrics that can help an organization to measure effectiveness of google shopping strategies. These can be keyword quality score, clicks and conversions etc. Do you have an important presentation coming up. Are you looking for something that will make your presentation stand out from the rest. Look no further than Techniques To Enhance Customer Engagement Via Digital Platforms Dashboards To Measure Performance Of Google Shopping Ads Structure PDF. With our professional designs, you can trust that your presentation will pop and make delivering it a smooth process. And with Slidegeeks, you can trust that your presentation will be unique and memorable. So why wait. Grab Techniques To Enhance Customer Engagement Via Digital Platforms Dashboards To Measure Performance Of Google Shopping Ads Structure PDF today and make your presentation stand out from the rest.


Following slide provides dashboard that can be used by the businesses to measure the performance of digital transformation initiatives with the help of different KPIs. KPIs covered are social presence, click through rate, sales revenue, churn amount etc. The Implementing Digital Transformation Kpi Dashboard To Track Digital Transformation Initiatives Structure PDF is a compilation of the most recent design trends as a series of slides. It is suitable for any subject or industry presentation, containing attractive visuals and photo spots for businesses to clearly express their messages. This template contains a variety of slides for the user to input data, such as structures to contrast two elements, bullet points, and slides for written information. Slidegeeks is prepared to create an impression.


This following slide displays the key metrics that can help an organization to measure effectiveness of e-commerce strategies. These can be revenue generated using e-commerce platform, conversion rates etc. Slidegeeks is here to make your presentations a breeze with E Commerce Marketing Techniques To Boost Sales Dashboard To Measure Performance Of E Commerce Marketing Strategies Structure PDF With our easy-to-use and customizable templates, you can focus on delivering your ideas rather than worrying about formatting. With a variety of designs to choose from, you are sure to find one that suits your needs. And with animations and unique photos, illustrations, and fonts, you can make your presentation pop. So whether you are giving a sales pitch or presenting to the board, make sure to check out Slidegeeks first.


Are you in need of a template that can accommodate all of your creative concepts. This one is crafted professionally and can be altered to fit any style. Use it with Google Slides or PowerPoint. Include striking photographs, symbols, depictions, and other visuals. Fill, move around, or remove text boxes as desired. Test out color palettes and font mixtures. Edit and save your work, or work with colleagues. Download Sustainable Competitive Edge Strategic Management Dashboard With Strategy Assessment Structure PDFand observe how to make your presentation outstanding. Give an impeccable presentation to your group and make your presentation unforgettable.
This slide describes the performance tracking dashboard for 5G architecture by covering the details of subscribers, quality of experience, consumption, customer support, coverage, devices, and dimensions.Explore a selection of the finest Performance Tracking Dashboard For 5G Architecture 5G Network Structure Diagrams PDF here. With a plethora of professionally designed and pre-made slide templates, you can quickly and easily find the right one for your upcoming presentation. You can use our Performance Tracking Dashboard For 5G Architecture 5G Network Structure Diagrams PDF to effectively convey your message to a wider audience. Slidegeeks has done a lot of research before preparing these presentation templates. The content can be personalized and the slides are highly editable. Grab templates today from Slidegeeks.

Showcasing this set of slides titled Quality Assurance Key Performance Indicator Dashboard Structure PDF. The topics addressed in these templates are Key Performance, Indicator Dashboard. All the content presented in this PPT design is completely editable. Download it and make adjustments in color, background, font etc. as per your unique business setting.
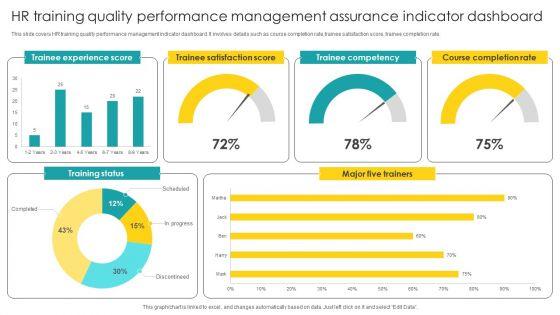

Showcasing this set of slides titled HR Training Quality Performance Management Assurance Indicator Dashboard Structure PDF. The topics addressed in these templates are Performance Management, Assurance Indicator Dashboard. All the content presented in this PPT design is completely editable. Download it and make adjustments in color, background, font etc. as per your unique business setting.


Boost your pitch with our creative Multi Cloud Infrastructure Management Cost Management Dashboard In Cloud Management Structure PDF. Deliver an awe-inspiring pitch that will mesmerize everyone. Using these presentation templates you will surely catch everyones attention. You can browse the ppts collection on our website. We have researchers who are experts at creating the right content for the templates. So you dont have to invest time in any additional work. Just grab the template now and use them.

This slide showcases dashboard which can help recruiters in managing relationships along with SMS campaign for candidates. It provides details about applications, shortlisted, on-hold, SMS activity report, SMS schedule, etc. Get a simple yet stunning designed Improving Technology Based Candidate Relationship Management Dashboard Structure PDF. It is the best one to establish the tone in your meetings. It is an excellent way to make your presentations highly effective. So, download this PPT today from Slidegeeks and see the positive impacts. Our easy-to-edit Improving Technology Based Candidate Relationship Management Dashboard Structure PDF can be your go-to option for all upcoming conferences and meetings. So, what are you waiting for Grab this template today.


The following slide highlights the project manpower planning dashboard with talent matrix illustrating supply and demand, skills, skills surplus, headcount and talent matrix showing number of skill demand, skill supply and surplus for department. Pitch your topic with ease and precision using this Project Personnel Planning Dashboard With Talent Matrix Demonstration Structure PDF. This layout presents information on Supply And Demand, Skill Surplus, Headcount. It is also available for immediate download and adjustment. So, changes can be made in the color, design, graphics or any other component to create a unique layout.


This slide provides dashboard showcasing product development project performance progress which helps managers identify areas of improvement. It provides information such as project budget overview, issue breakdown, workload management and hour spent on project. Pitch your topic with ease and precision using this Product Management Project Performance With Workload KPI Dashboard Structure PDF. This layout presents information on Project Budget Overview, Workload Management. It is also available for immediate download and adjustment. So, changes can be made in the color, design, graphics or any other component to create a unique layout.


This slide provides dashboard representing website development progress metrics with project performance status. It provides information regarding latency of product, pageviews by browser, pull requests and cost of cloud services. Showcasing this set of slides titled KPI Dashboard Showcasing Website Management Progress And Performance Status Structure PDF. The topics addressed in these templates are Pageview By Browser, Product, Average Latency. All the content presented in this PPT design is completely editable. Download it and make adjustments in color, background, font etc. as per your unique business setting.


This slide showcases employee absenteeism and overtime status. It provides information such as days of absenteeism, per employee overtime, age wise overtime, past performance, etc. Showcasing this set of slides titled Workforce Absenteeism And Overtime Report Dashboard Structure PDF. The topics addressed in these templates are Workforce Absenteeism, Overtime Report Dashboard. All the content presented in this PPT design is completely editable. Download it and make adjustments in color, background, font etc. as per your unique business setting.


This slide shows KPI dashboard which can be used to track customer service delivery by channel. It includes weekly customer satisfaction levels. Showcasing this set of slides titled Client Support Dashboard To Measure Satisfaction Level Structure PDF. The topics addressed in these templates are Executive, Customer Satisfaction Level, Email. All the content presented in this PPT design is completely editable. Download it and make adjustments in color, background, font etc. as per your unique business setting.


This slide showcases dashboard which can be used by QA managers in tracking defects. It provides details about total production, defective production, production rate, damaged, average cycle duration, test cycle, electrically defective, etc. Boost your pitch with our creative Automated Quality Control In Manufacturing Automated Dashboard For Inspecting Structure PDF. Deliver an awe inspiring pitch that will mesmerize everyone. Using these presentation templates you will surely catch everyones attention. You can browse the ppts collection on our website. We have researchers who are experts at creating the right content for the templates. So you do not have to invest time in any additional work. Just grab the template now and use them.


This slide showcases dashboard that can help organization to track the website traffic after running online brand awareness marketing campaigns. Its key components are new visitors, traffic by source, traffic by lead source, customers wins by lead source and bounce rate.Crafting an eye-catching presentation has never been more straightforward. Let your presentation shine with this tasteful yet straightforward Dashboard To Track Website Traffic After Brand Awareness Campaign Structure PDF template. It offers a minimalistic and classy look that is great for making a statement. The colors have been employed intelligently to add a bit of playfulness while still remaining professional. Construct the ideal Dashboard To Track Website Traffic After Brand Awareness Campaign Structure PDF that effortlessly grabs the attention of your audience Begin now and be certain to wow your customers.


This slide showcases dashboard that can help organization to manage the marketing campaigns in multi brand strategy. Its key elements are lead breakdown, total leads, key conversion metrics etc.If you are looking for a format to display your unique thoughts, then the professionally designed Dashboard To Manage Marketing Campaigns Of Multiple Brands Structure PDF is the one for you. You can use it as a Google Slides template or a PowerPoint template. Incorporate impressive visuals, symbols, images, and other charts. Modify or reorganize the text boxes as you desire. Experiment with shade schemes and font pairings. Alter, share or cooperate with other people on your work. Download Dashboard To Manage Marketing Campaigns Of Multiple Brands Structure PDF and find out how to give a successful presentation. Present a perfect display to your team and make your presentation unforgettable.


The following slide outlines a comprehensive visual representation of customer satisfaction CSAT that can assist companies to measure how happy are customers wit the brand. The KPIs covered are net promoter score NPS, customer effort score CES, product quality, pricing, etc. Retrieve professionally designed Comprehensive Market Research Guide KPI Dashboard To Analyze Customer Satisfaction Structure PDF to effectively convey your message and captivate your listeners. Save time by selecting pre-made slideshows that are appropriate for various topics, from business to educational purposes. These themes come in many different styles, from creative to corporate, and all of them are easily adjustable and can be edited quickly. Access them as PowerPoint templates or as Google Slides themes. You dont have to go on a hunt for the perfect presentation because Slidegeeks got you covered from everywhere.


This slide illustrates the KPI dashboard for workforce diversity providing details regarding headcount by seniority, gender and gender. It also provides information regarding monthly median age by gender and women at senior level forecast. Presenting this PowerPoint presentation, titled Executing Diversity KPI Dashboard To Monitor Workforce Executing Diversity Structure PDF, with topics curated by our researchers after extensive research. This editable presentation is available for immediate download and provides attractive features when used. Download now and captivate your audience. Presenting this Executing Diversity KPI Dashboard To Monitor Workforce Executing Diversity Structure PDF. Our researchers have carefully researched and created these slides with all aspects taken into consideration. This is a completely customizable Executing Diversity KPI Dashboard To Monitor Workforce Executing Diversity Structure PDF that is available for immediate downloading. Download now and make an impact on your audience. Highlight the attractive features available with our PPTs.


This slide shows KPI dashboard for assessing performance of social media platforms. It provides information about followers, likes, clicks, shares, impressions, engaged users, new followers, etc. Retrieve professionally designed Optimizing Social Networks Social Media Platforms Dashboard With Key Metrics Structure PDF to effectively convey your message and captivate your listeners. Save time by selecting pre-made slideshows that are appropriate for various topics, from business to educational purposes. These themes come in many different styles, from creative to corporate, and all of them are easily adjustable and can be edited quickly. Access them as PowerPoint templates or as Google Slides themes. You dont have to go on a hunt for the perfect presentation because Slidegeeks got you covered from everywhere.
Slidegeeks is here to make your presentations a breeze with Data Structure IT Data Structure Performance Tracking Dashboard Diagrams PDF With our easy-to-use and customizable templates, you can focus on delivering your ideas rather than worrying about formatting. With a variety of designs to choose from, youre sure to find one that suits your needs. And with animations and unique photos, illustrations, and fonts, you can make your presentation pop. So whether youre giving a sales pitch or presenting to the board, make sure to check out Slidegeeks first.


This slide includes profit and loss analysis dashboard with cost breakdown KPI. The kpis used herein are revenue, COGS, expenditure and net profit.Pitch your topic with ease and precision using this Monthly Profit And Loss Analysis Reports Dashboard With Cost Breakdown Kpi Structure PDF. This layout presents information on Revenue Expenditure, Net Profit, Total Exprnses. It is also available for immediate download and adjustment. So, changes can be made in the color, design, graphics or any other component to create a unique layout.


This slide represents the price benchmarking comparison report of manufacturing company. It includes information related to gross and profit margin and revenue growth of all organizations along with graph showing benchmark index comparison from industry average. Pitch your topic with ease and precision using this Pricing Benchmarks Analysis Dashboard For Manufacturing Company Structure PDF. This layout presents information on Pricing Benchmarks Analysis, Dashboard For Manufacturing Company. It is also available for immediate download and adjustment. So, changes can be made in the color, design, graphics or any other component to create a unique layout.
SHOW
- 60
- 120
- 180
DISPLAYING: 60 of 239 Item(s)
Page