 AI PPT Maker
 Templates
 PPT Bundles
 Design Services
 Business PPTs
 Business Plan
 Management
 Strategy
 Introduction PPT
 Roadmap
 Self Introduction
 Timelines
 Process
 Marketing
 Agenda
 Technology
 Medical
 Startup Business Plan
 Cyber Security
 Dashboards
 SWOT
SWOT Proposals
 Education
 Pitch Deck
 Digital Marketing
 KPIs
KPIs Project Management
 Product Management
 Artificial Intelligence
 Target Market
 Communication
 Supply Chain
 Google Slides
 Research Services
 One Pagers
 All Categories
Structure analysis PowerPoint Presentation Templates and Google Slides
SHOW
- 60
- 120
- 180
DISPLAYING: 60 of 443 Item(s)
Page


Boost your confidence and team morale with this well-structured structure of a data analysis report framework business ppt powerpoint presentation complete deck. This prefabricated set gives a voice to your presentation because of its well-researched content and graphics. Our experts have added all the components very carefully, thus helping you deliver great presentations with a single click. Not only that, it contains a set of twelve slides that are designed using the right visuals, graphics, etc. Various topics can be discussed, and effective brainstorming sessions can be conducted using the wide variety of slides added in this complete deck. Apart from this, our PPT design contains clear instructions to help you restructure your presentations and create multiple variations. The color, format, design anything can be modified as deemed fit by the user. Not only this, it is available for immediate download. So, grab it now.


Presenting this set of slides with name business impact analysis financial ppt powerpoint presentation professional structure. The topics discussed in these slides are business, management, planning, strategy, marketing. This is a completely editable PowerPoint presentation and is available for immediate download. Download now and impress your audience.


Presenting you an exemplary Proposal For Data Analysis In Research Project Team Structure Of Data Analysis Company One Pager Sample Example Document. Our one-pager comprises all the must-have essentials of an inclusive document. You can edit it with ease, as its layout is completely editable. With such freedom, you can tweak its design and other elements to your requirements. Download this Proposal For Data Analysis In Research Project Team Structure Of Data Analysis Company One Pager Sample Example Document brilliant piece now.


This slide focuses on the data analytics cost structure which covers different phases and costing incurred by each team member. Presenting you an exemplary Statistical Evaluation Of Research Discovery Statistical Analysis Cost Structure One Pager Sample Example Document. Our one pager comprises all the must have essentials of an inclusive document. You can edit it with ease, as its layout is completely editable. With such freedom, you can tweak its design and other elements to your requirements. Download this Statistical Evaluation Of Research Discovery Statistical Analysis Cost Structure One Pager Sample Example Document brilliant piece now.


We present our business organizational chart template structured planning swot analysis PowerPoint Slides.Use our Circle Charts PowerPoint Templates because Our PowerPoint Templates and Slides are effectively colour coded to prioritise your plans They automatically highlight the sequence of events you desire. Download our Ring Charts PowerPoint Templates because Our PowerPoint Templates and Slides are created with admirable insight. Use them and give your group a sense of your logical mind. Download and present our Business PowerPoint Templates because Your ideas provide food for thought. Our PowerPoint Templates and Slides will help you create a dish to tickle the most discerning palate. Present our Flow Charts PowerPoint Templates because Our PowerPoint Templates and Slides are truly out of this world. Even the MIB duo has been keeping tabs on our team. Present our Process and Flows PowerPoint Templates because Our PowerPoint Templates and Slides are a sure bet. Gauranteed to win against all odds. Use these PowerPoint slides for presentations relating to Business, buy, clipart, commerce, concept, conceptual, consumer, customer, cycle, design, development, diagram, direction, guidelines, icon, illustration, know, life, lifecycle, like, manage, management, market, marketing, mix, model, optimize, organization, performance, process, refer, repeat, resource, sales, selling, stages. The prominent colors used in the PowerPoint template are Red, Blue navy, Black. People tell us our business organizational chart template structured planning swot analysis PowerPoint Slides are designed by a team of presentation professionals. PowerPoint presentation experts tell us our conceptual PowerPoint templates and PPT Slides will generate and maintain the level of interest you desire. They will create the impression you want to imprint on your audience. Presenters tell us our business organizational chart template structured planning swot analysis PowerPoint Slides are designed by professionals Use our cycle PowerPoint templates and PPT Slides are aesthetically designed to attract attention. We guarantee that they will grab all the eyeballs you need. Customers tell us our business organizational chart template structured planning swot analysis PowerPoint Slides will make the presenter look like a pro even if they are not computer savvy. People tell us our concept PowerPoint templates and PPT Slides will get their audience's attention. Make them feel up to it with our Business Organizational Chart Template Structured Planning Swot Analysis PowerPoint Slides. Assure them with your words.


We present our business structure diagram pest analysis problem solving PowerPoint Slides.Download and present our Advertising PowerPoint Templates because It will let you Set new benchmarks with our PowerPoint Templates and Slides. They will keep your prospects well above par. Download our Shapes PowerPoint Templates because Our PowerPoint Templates and Slides will bullet point your ideas. See them fall into place one by one. Use our Business PowerPoint Templates because our PowerPoint Templates and Slides are the string of your bow. Fire of your ideas and conquer the podium. Present our Process and Flows PowerPoint Templates because Our PowerPoint Templates and Slides will embellish your thoughts. See them provide the desired motivation to your team. Download our Metaphors-Visual Concepts PowerPoint Templates because Our PowerPoint Templates and Slides ensures Effective communication. They help you put across your views with precision and clarity.Use these PowerPoint slides for presentations relating to Actions, analyze, business, commerce, concept, conceptual, define, design, diagram, direction, guidelines, icon, implement, improve, indicators, integration, key, manage, management, mba, model, optimize, organization, performance, process, resentation, resource, review, selling, solution, solve, system, theoretical, theory, tool. The prominent colors used in the PowerPoint template are Green, Gray, Black. The feedback we get is that our business structure diagram pest analysis problem solving PowerPoint Slides will save the presenter time. The feedback we get is that our conceptual PowerPoint templates and PPT Slides are second to none. Professionals tell us our business structure diagram pest analysis problem solving PowerPoint Slides are readymade to fit into any presentation structure. Professionals tell us our concept PowerPoint templates and PPT Slides are topically designed to provide an attractive backdrop to any subject. Presenters tell us our business structure diagram pest analysis problem solving PowerPoint Slides are effectively colour coded to prioritise your plans They automatically highlight the sequence of events you desire. You can be sure our business PowerPoint templates and PPT Slides are designed to make your presentations professional. Our Business Structure Diagram Pest Analysis Problem Solving PowerPoint Slides will keep u sane. Your thoughts will bolt across the line.


We present our business process flow diagram structured planning swot analysis PowerPoint templates.Use our Marketing PowerPoint Templates because You can Channelise the thoughts of your team with our PowerPoint Templates and Slides. Urge them to focus on the goals you have set. Download and present our Business PowerPoint Templates because Our PowerPoint Templates and Slides will effectively help you save your valuable time. They are readymade to fit into any presentation structure. Present our Shapes PowerPoint Templates because Our PowerPoint Templates and Slides will let you Leave a lasting impression to your audiences. They possess an inherent longstanding recall factor. Present our Circle Charts PowerPoint Templates because Our PowerPoint Templates and Slides are topically designed to provide an attractive backdrop to any subject. Download our Process and Flows PowerPoint Templates because Our PowerPoint Templates and Slides are specially created by a professional team with vast experience. They diligently strive to come up with the right vehicle for your brilliant Ideas. Use these PowerPoint slides for presentations relating to Action, business, chart, circles, clipart, concept, corporate, design, diagram, goals, guide, guidelines, icon, idea, illustration, management, marketing, mba, model, opportunity, organization, performance, plans, process, project, representation, resource, round, strategy, success, swot, theory, tool, vision. The prominent colors used in the PowerPoint template are Yellow, Gray, Black. The feedback we get is that our business process flow diagram structured planning swot analysis PowerPoint templates have awesome images to get your point across. The feedback we get is that our diagram PowerPoint templates and PPT Slides provide you with a vast range of viable options. Select the appropriate ones and just fill in your text. Professionals tell us our business process flow diagram structured planning swot analysis PowerPoint templates will save the presenter time. Professionals tell us our concept PowerPoint templates and PPT Slides have awesome images to get your point across. Presenters tell us our business process flow diagram structured planning swot analysis PowerPoint templates look good visually. You can be sure our design PowerPoint templates and PPT Slides are visually appealing. Create a favourable climate with our Business Process Flow Diagram Structured Planning Swot Analysis PowerPoint Templates. The audience will display their appreciation.


We present our business architecture diagrams structured planning swot analysis PowerPoint Slides.Use our Advertising PowerPoint Templates because colours generate instant reactions in our brains. Download and present our Business PowerPoint Templates because your product has established a foothold in the market. Customers are happy with the value it brings to their lives. Present our Marketing PowerPoint Templates because The marketplace is the merger of your dreams and your ability. Present our Finance PowerPoint Templates because readymade PowerPoint templates can prove best of your knowledge for your slides to show. Present our Shapes PowerPoint Templates because business ethics is an essential element in your growth.Use these PowerPoint slides for presentations relating to Abstract, Action, Analysis, Business, Chart, Clipart, Commerce, Concept, Conceptual, Design, Diagram, Direction, Dry-Erase, Goals, Guide, Icon, Idea, Illustration, Manage, Management, Mba, Model, Opportunity, Organization, Performance, Plan, Process, Project, Representation, Resource, Sketch, Strategy, Strength, Success, Swot. The prominent colors used in the PowerPoint template are Green, Gray, White. PowerPoint presentation experts tell us our business architecture diagrams structured planning swot analysis PowerPoint Slides are Colorful. Professionals tell us our Conceptual PowerPoint templates and PPT Slides will help you be quick off the draw. Just enter your specific text and see your points hit home. People tell us our business architecture diagrams structured planning swot analysis PowerPoint Slides are Clever. We assure you our Clipart PowerPoint templates and PPT Slides are Dazzling. PowerPoint presentation experts tell us our business architecture diagrams structured planning swot analysis PowerPoint Slides are Pretty. Professionals tell us our Commerce PowerPoint templates and PPT Slides will help you be quick off the draw. Just enter your specific text and see your points hit home. Thoughts won't dry up with our Business Architecture Diagrams Structured Planning Swot Analysis PowerPoint Slides. They keep your brain going at it all the time.
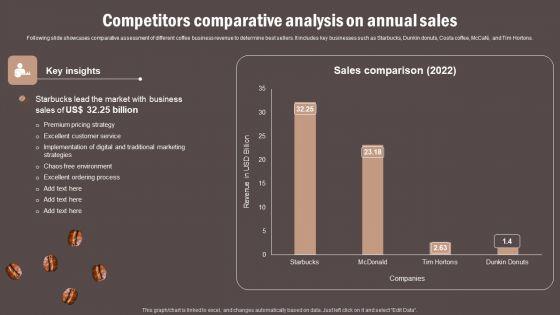
Following slide showcases comparative assessment of different coffee business revenue to determine best sellers. It includes key businesses such as Starbucks, Dunkin donuts, Costa coffee, McCafe, and Tim Hortons. Crafting an eye catching presentation has never been more straightforward. Let your presentation shine with this tasteful yet straightforward Coffee Cafe Company Profile Competitors Comparative Analysis On Annual Sales Structure PDF template. It offers a minimalistic and classy look that is great for making a statement. The colors have been employed intelligently to add a bit of playfulness while still remaining professional. Construct the ideal Coffee Cafe Company Profile Competitors Comparative Analysis On Annual Sales Structure PDF that effortlessly grabs the attention of your audience. Begin now and be certain to wow your customers.


The slide represents a model to highlight the classification of different stakeholders involved in the crisis management and communication. Various categories of stakeholders included are strong, key, dependent and core stakeholders Welcome to our selection of the Key Phase Of Crisis Communication Management Plan Stakeholders Category Analysis Model Structure Themes PDF. These are designed to help you showcase your creativity and bring your sphere to life. Planning and Innovation are essential for any business that is just starting out. This collection contains the designs that you need for your everyday presentations. All of our PowerPoints are 100 percent editable, so you can customize them to suit your needs. This multi purpose template can be used in various situations. Grab these presentation templates today.


Retrieve professionally designed Table Of Contents For Detailed Analysis Of COBOTS Structure PDF to effectively convey your message and captivate your listeners. Save time by selecting pre made slideshows that are appropriate for various topics, from business to educational purposes. These themes come in many different styles, from creative to corporate, and all of them are easily adjustable and can be edited quickly. Access them as PowerPoint templates or as Google Slides themes. You do not have to go on a hunt for the perfect presentation because Slidegeeks got you covered from everywhere.


This slide represents the dashboard for twitter competition analysis providing information regarding published tweets in terms of original, links, pictures, videos etc. It also covers details of tweet likes, retweets, mentions, replies etc. Make sure to capture your audiences attention in your business displays with our gratis customizable Utilizing Twitter For Social Media Dashboard For Twitter Competition Analysis Structure PDF. These are great for business strategies, office conferences, capital raising or task suggestions. If you desire to acquire more customers for your tech business and ensure they stay satisfied, create your own sales presentation with these plain slides.


This slide focuses on the packages offered by call center service providers such as essential, business plus, enterprise, and premium. Presenting you an exemplary Statistical Evaluation Of Research Discovery Statistical Analysis Team Cost Structure One Pager Sample Example Document. Our one pager comprises all the must have essentials of an inclusive document. You can edit it with ease, as its layout is completely editable. With such freedom, you can tweak its design and other elements to your requirements. Download this Statistical Evaluation Of Research Discovery Statistical Analysis Team Cost Structure One Pager Sample Example Document brilliant piece now.
This template illustrates the KPI dashboard for tracking shipment orders. It also includes shipment analysis based on different KPIs such as ongoing delivery, completed delivery, on-time delivery, actual delivery duration, and variance between expected and actual delivery time. Pitch your topic with ease and precision using this Shipping Delivery Tracking Metrics Analysis Dashboard Structure PDF. This layout presents information on Recipient Country, Completed Deliveries, Delivery Duration. It is also available for immediate download and adjustment. So, changes can be made in the color, design, graphics or any other component to create a unique layout.


This slide covers financial impact of new distribution strategies on revenue, gross profit margins, net profit margins and distribution and logistics cost. Company revenues has increased, profit margins have improved and distribution cost has decreased. This modern and well-arranged Maximizing Profit Returns With Right Distribution Source Impact Analysis Of New Distribution Strategies Structure PDF provides lots of creative possibilities. It is very simple to customize and edit with the Powerpoint Software. Just drag and drop your pictures into the shapes. All facets of this template can be edited with Powerpoint no extra software is necessary. Add your own material, put your images in the places assigned for them, adjust the colors, and then you can show your slides to the world, with an animated slide included.


Following slide exhibits estimated mobile ecommerce worldwide sales of six years. Purpose of this slide is to understand changing customer shopping preferences towards ecommerce app. It includes percentage of yearly total sales with key insights. Pitch your topic with ease and precision using this Sales Growth Analysis With Mobile Electronic Commerce Application Structure PDF. This layout presents information on Shown Maximum, Awareness Social Media, Accessibility Internet. It is also available for immediate download and adjustment. So, changes can be made in the color, design, graphics or any other component to create a unique layout.


This slide covers a graphical representation of EV sales in China. It also includes key insights about EV sales in 2020 and 2021, BEV and plug-in hybrid cars. Are you searching for a Global Automobile Market Analysis Electric Vehicle Sales Growth In China Structure PDF that is uncluttered, straightforward, and original. Its easy to edit, and you can change the colors to suit your personal or business branding. For a presentation that expresses how much effort youve put in, this template is ideal With all of its features, including tables, diagrams, statistics, and lists, its perfect for a business plan presentation. Make your ideas more appealing with these professional slides. Download Global Automobile Market Analysis Electric Vehicle Sales Growth In China Structure PDF from Slidegeeks today.


The slide showcases operating profit trend last five financial years along with profitability margin along with the key insights and reasons impacting operating margin. Formulating a presentation can take up a lot of effort and time, so the content and message should always be the primary focus. The visuals of the PowerPoint can enhance the presenters message, so our Insurance Business Financial Analysis Operating Profit And Margin Ppt Styles Structure PDF was created to help save time. Instead of worrying about the design, the presenter can concentrate on the message while our designers work on creating the ideal templates for whatever situation is needed. Slidegeeks has experts for everything from amazing designs to valuable content, we have put everything into Insurance Business Financial Analysis Operating Profit And Margin Ppt Styles Structure PDF.


This slide provides glimpse about leverage ratio analysis for calculating our firms debt level and ability to pay interest on time. It includes quarterly debt to equity ratio, quarterly interest coverage ratio, key insights, etc.This Analyzing Debt Level With Leverage Ratio Analysis Effective Planning For Monetary Structure PDF is perfect for any presentation, be it in front of clients or colleagues. It is a versatile and stylish solution for organizing your meetings. The Analyzing Debt Level With Leverage Ratio Analysis Effective Planning For Monetary Structure PDF features a modern design for your presentation meetings. The adjustable and customizable slides provide unlimited possibilities for acing up your presentation. Slidegeeks has done all the homework before launching the product for you. So, do not wait, grab the presentation templates today.


The slide highlights comparative assessment of key operators worldwide cloud kitchen market. It showcases comparison on the basis of founding date, type, location, employees, valuation, revenue and specialties. Formulating a presentation can take up a lot of effort and time, so the content and message should always be the primary focus. The visuals of the PowerPoint can enhance the presenters message, so our Comparative Analysis Of Major Players In Global Cloud Kitchen Industry Structure PDF was created to help save time. Instead of worrying about the design, the presenter can concentrate on the message while our designers work on creating the ideal templates for whatever situation is needed. Slidegeeks has experts for everything from amazing designs to valuable content, we have put everything into Comparative Analysis Of Major Players In Global Cloud Kitchen Industry Structure PDF.


This slide shows economic survey indicating key priorities of recruiters before hiring employees. It provides information about critical thinking, problem solving, technological acumen, physique, communication, etc. Showcasing this set of slides titled Economic Survey Analysis Highlighting Major Priorities Of Job Skills Structure PDF The topics addressed in these templates are Economic Survey Analysis, Highlighting Major, Priorities Job Skills. All the content presented in this PPT design is completely editable. Download it and make adjustments in color, background, font etc. as per your unique business setting.


This slide includes profit and loss analysis dashboard with cost breakdown KPI. The kpis used herein are revenue, COGS, expenditure and net profit.Pitch your topic with ease and precision using this Monthly Profit And Loss Analysis Reports Dashboard With Cost Breakdown Kpi Structure PDF. This layout presents information on Revenue Expenditure, Net Profit, Total Exprnses. It is also available for immediate download and adjustment. So, changes can be made in the color, design, graphics or any other component to create a unique layout.


This slide represents the price benchmarking comparison report of manufacturing company. It includes information related to gross and profit margin and revenue growth of all organizations along with graph showing benchmark index comparison from industry average. Pitch your topic with ease and precision using this Pricing Benchmarks Analysis Dashboard For Manufacturing Company Structure PDF. This layout presents information on Pricing Benchmarks Analysis, Dashboard For Manufacturing Company. It is also available for immediate download and adjustment. So, changes can be made in the color, design, graphics or any other component to create a unique layout.
This slide covers the key performance indicators for tracking performance of the cloud such as violations break down, sources, rules and severity. Get a simple yet stunning designed Cloud Based Computing Analysis Cloud Performance Tracking Dashboard Structure PDF. It is the best one to establish the tone in your meetings. It is an excellent way to make your presentations highly effective. So, download this PPT today from Slidegeeks and see the positive impacts. Our easy-to-edit Cloud Based Computing Analysis Cloud Performance Tracking Dashboard Structure PDF can be your go-to option for all upcoming conferences and meetings. So, what are you waiting for Grab this template today.


This slide displays the budget analysis report comparing the budget with the actual year to date data. It also helps in making estimations for the remaining year. It includes variance between budgeted and actual gross margin results, service revenue, profit margin, product revenue, payroll cost, etc. Pitch your topic with ease and precision using this Budget Analysis Dashboard With Actual And Forecasted Revenue Comparison Structure PDF. This layout presents information on Payroll Cost, Budget Revenue Components, Product Revenue. It is also available for immediate download and adjustment. So, changes can be made in the color, design, graphics or any other component to create a unique layout.


This slide showcases the medical equipment monthly sales summary analysis chart. It includes elements such as product name, unit price, sales volume, monthly sales of the product and product trend chart. Showcasing this set of slides titled Monthly Sales Analysis Chart For Pharmaceutical Device Structure PDF. The topics addressed in these templates are Monthly Sales Analysis, Pharmaceutical Device. All the content presented in this PPT design is completely editable. Download it and make adjustments in color, background, font etc. as per your unique business setting.


The slide visually provides information regarding the average time customer spent at the checkout counter of retail store. It also provides details regarding waiting timings of competitors. Create an editable Retail Store Operations Analysis Of Average Wait Time At Retail Store Checkout Structure PDF that communicates your idea and engages your audience. Whether youre presenting a business or an educational presentation, pre-designed presentation templates help save time. Retail Store Operations Analysis Of Average Wait Time At Retail Store Checkout Structure PDF is highly customizable and very easy to edit, covering many different styles from creative to business presentations. Slidegeeks has creative team members who have crafted amazing templates. So, go and get them without any delay.


This slide covers a graphical representation of EV sales in the United States and California. It also includes key insights about Californias 2022 Q1 sales in comparison to 2021 Q4, increased fuel costs and large super bowl EV ad, etc. Welcome to our selection of the Electric Vehicle Sales Growth In California And The Us Global Automotive Manufacturing Market Analysis Structure PDF. These are designed to help you showcase your creativity and bring your sphere to life. Planning and Innovation are essential for any business that is just starting out. This collection contains the designs that you need for your everyday presentations. All of our PowerPoints are 100 parcent editable, so you can customize them to suit your needs. This multi-purpose template can be used in various situations. Grab these presentation templates today.


This slide covers a graphical representation of automotive aftermarket size. It also includes key insights such as worldwide automotive part market value in 2021, predicted value in 2027, CAGR, the value of wholesales and distributor, retailer segments, etc. Whether you have daily or monthly meetings, a brilliant presentation is necessary. Auto Industry Trends Automotive Parts Market Growth Global Automotive Manufacturing Market Analysis Structure PDF can be your best option for delivering a presentation. Represent everything in detail using Auto Industry Trends Automotive Parts Market Growth Global Automotive Manufacturing Market Analysis Structure PDF and make yourself stand out in meetings. The template is versatile and follows a structure that will cater to your requirements. All the templates prepared by Slidegeeks are easy to download and edit. Our research experts have taken care of the corporate themes as well. So, give it a try and see the results.


Following slide covers project feasibility financial ratio along with graphical representation. Ratios included are net profit sales, quick ratio, debt equity ratio and gross profit sales. Here you can discover an assortment of the finest PowerPoint and Google Slides templates. With these templates, you can create presentations for a variety of purposes while simultaneously providing your audience with an eye catching visual experience. Download Project Feasibility Financial Ratios Feasibility Analysis Report For Construction Project Structure PDF to deliver an impeccable presentation. These templates will make your job of preparing presentations much quicker, yet still, maintain a high level of quality. Slidegeeks has experienced researchers who prepare these templates and write high quality content for you. Later on, you can personalize the content by editing the Project Feasibility Financial Ratios Feasibility Analysis Report For Construction Project Structure PDF.


The slide shows annual revenue growth of the company with the CAGR for last five financial years from 2019 to 2023 along with key insights.Presenting this PowerPoint presentation, titled Company Revenue 2019 To 2023 Engineering Company Financial Analysis Report Structure PDF, with topics curated by our researchers after extensive research. This editable presentation is available for immediate download and provides attractive features when used. Download now and captivate your audience. Presenting this Company Revenue 2019 To 2023 Engineering Company Financial Analysis Report Structure PDF. Our researchers have carefully researched and created these slides with all aspects taken into consideration. This is a completely customizable Company Revenue 2019 To 2023 Engineering Company Financial Analysis Report Structure PDF that is available for immediate downloading. Download now and make an impact on your audience. Highlight the attractive features available with our PPTs.


The following slide highlights the real revenue growth of the engineering company for a time period of four years. It shows nominal revenue growth and price-adjusted revenue growth to show the revenue in percentage.Formulating a presentation can take up a lot of effort and time, so the content and message should always be the primary focus. The visuals of the PowerPoint can enhance the presenters message, so our Engineering Company Real Revenue Growth Engineering Company Financial Analysis Report Structure PDF was created to help save time. Instead of worrying about the design, the presenter can concentrate on the message while our designers work on creating the ideal templates for whatever situation is needed. Slidegeeks has experts for everything from amazing designs to valuable content, we have put everything into Engineering Company Real Revenue Growth Engineering Company Financial Analysis Report Structure PDF.
SHOW
- 60
- 120
- 180
DISPLAYING: 60 of 443 Item(s)
Page