 AI PPT Maker
 Templates
 PPT Bundles
 Design Services
 Business PPTs
 Business Plan
 Management
 Strategy
 Introduction PPT
 Roadmap
 Self Introduction
 Timelines
 Process
 Marketing
 Agenda
 Technology
 Medical
 Startup Business Plan
 Cyber Security
 Dashboards
 SWOT
SWOT Proposals
 Education
 Pitch Deck
 Digital Marketing
 KPIs
KPIs Project Management
 Product Management
 Artificial Intelligence
 Target Market
 Communication
 Supply Chain
 Google Slides
 Research Services
 One Pagers
 All Categories
Strategy dashboard PowerPoint Presentation Templates and Google Slides
SHOW
- 60
- 120
- 180
DISPLAYING: 60 of 566 Item(s)
Page


Presenting this set of slides with name seo strategies analytics dashboard ppt powerpoint presentation styles inspiration cpb. This is a one stage process. The stages in this process are seo strategies analytics dashboard. This is a completely editable PowerPoint presentation and is available for immediate download. Download now and impress your audience.


This slide shows dashboard which can be used by organizations to measure the results of public relation strategy. It includes metrics such as media coverage rate, social media engagement rate, share of voice and brand mentions. This modern and well arranged Internal Promotion Strategy To Enhance Brand Awareness KPI Dashboard To Track PR Marketing Performance Ideas PDF provides lots of creative possibilities. It is very simple to customize and edit with the Powerpoint Software. Just drag and drop your pictures into the shapes. All facets of this template can be edited with Powerpoint no extra software is necessary. Add your own material, put your images in the places assigned for them, adjust the colors, and then you can show your slides to the world, with an animated slide included.


This template covers the details of price optimization which focuses on number of visitors, customers, revenues, performance by devices, etc. Here you can discover an assortment of the finest PowerPoint and Google Slides templates. With these templates, you can create presentations for a variety of purposes while simultaneously providing your audience with an eye-catching visual experience. Download Strategies To Select Effective Price Optimization Dashboard Graphics PDF to deliver an impeccable presentation. These templates will make your job of preparing presentations much quicker, yet still, maintain a high level of quality. Slidegeeks has experienced researchers who prepare these templates and write high-quality content for you. Later on, you can personalize the content by editing the Strategies To Select Effective Price Optimization Dashboard Graphics PDF.


This template covers the details of price optimization which focuses on number of visitors, customers, revenues, performance by devices, etc.Find highly impressive Price Optimization Dashboard Pricing Strategies For New Product In Market Infographics PDF on Slidegeeks to deliver a meaningful presentation. You can save an ample amount of time using these presentation templates. No need to worry to prepare everything from scratch because Slidegeeks experts have already done a huge research and work for you. You need to download Price Optimization Dashboard Pricing Strategies For New Product In Market Infographics PDF for your upcoming presentation. All the presentation templates are 100precent editable and you can change the color and personalize the content accordingly. Download now.
This slide provides information regarding tracking of essential activities associated to recruitment process and presented in dashboard. Deliver and pitch your topic in the best possible manner with this Staff Recruitment Strategy At Workplace Essential Activities In Recruitment Process Tracking Dashboard Contd Slides PDF. Use them to share invaluable insights on Tracking Dashboard, Recruitment Process and impress your audience. This template can be altered and modified as per your expectations. So, grab it now.


Analyze Ailments On Our Business Cycle Diagram Business Dashboard Combination Chart Strategy Diagram Powerpoint Templates. Bring Out The Thinking Doctor In You. Dock Your Thoughts With Our Business Cycle Diagram Business Dashboard Combination Chart Strategy Diagram Powerpoint Templates. They Will Launch Them Into Orbit.


This slide provides information regarding the dashboard to monitor overall IT performance. The dashboard tracks occupancy rate, net promoter score, avg. first contact resolution rate, etc. Boost your pitch with our creative Deploying Corporate Aligned IT Strategy IT Performance Dashboard To Track Customer Satisfaction Clipart PDF. Deliver an awe inspiring pitch that will mesmerize everyone. Using these presentation templates you will surely catch everyones attention. You can browse the ppts collection on our website. We have researchers who are experts at creating the right content for the templates. So you do not have to invest time in any additional work. Just grab the template now and use them.


This slide provides information regarding dashboard to monitor critical activities related to IT in terms of incident tracker, outage report, IT spend per employee, application trends, etc. Formulating a presentation can take up a lot of effort and time, so the content and message should always be the primary focus. The visuals of the PowerPoint can enhance the presenters message, so our Deploying Corporate Aligned IT Strategy Dashboard To Track Essential Activities Associated With IT Department Structure PDF was created to help save time. Instead of worrying about the design, the presenter can concentrate on the message while our designers work on creating the ideal templates for whatever situation is needed. Slidegeeks has experts for everything from amazing designs to valuable content, we have put everything into Deploying Corporate Aligned IT Strategy Dashboard To Track Essential Activities Associated With IT Department Structure PDF


The purpose of this slide is to delineate a staff retention dashboard through which the human resource HR department can measure the effectiveness of retention strategies. The KPIs are hiring source, location, department, job type, job category etc. Boost your pitch with our creative Effective Strategies For Retaining Healthcare Staff Employee Retention Dashboard For Hr Department Formats PDF. Deliver an awe inspiring pitch that will mesmerize everyone. Using these presentation templates you will surely catch everyones attention. You can browse the ppts collection on our website. We have researchers who are experts at creating the right content for the templates. So you do not have to invest time in any additional work. Just grab the template now and use them.


This slide showcases the KPIs that would help our business organization to evaluate improvements with the new financial strategy implementation. It includes total income, total expenses, accounts receivable, etc. The best PPT templates are a great way to save time, energy, and resources. Slidegeeks have 100 percent editable powerpoint slides making them incredibly versatile. With these quality presentation templates, you can create a captivating and memorable presentation by combining visually appealing slides and effectively communicating your message. Download Adjusting Financial Strategies And Planning KPI Dashboard To Analyze Financial Improvements Inspiration PDF from Slidegeeks and deliver a wonderful presentation.
This slide covers the dashboard that depicts metrics to track company sales performance that focuses on number of sales, cost breakdown, accumulated revenues, incremental sales, etc. Boost your pitch with our creative Implementing Change Management Strategy To Transform Business Processes Dashboard Depicting Kpis To Track Icons PDF. Deliver an awe-inspiring pitch that will mesmerize everyone. Using these presentation templates you will surely catch everyones attention. You can browse the ppts collection on our website. We have researchers who are experts at creating the right content for the templates. So you do not have to invest time in any additional work. Just grab the template now and use them.


This slide present the kpi dashboard to monitor the performance of CPA advertiser. It includes metrics such as sales number, commission, sales amount, CTR, number of clicks, sessions, CTC, advertiser performance report, etc. The Strategies For Implementing CPA Marketing Dashboard To Track CPA Advertiser Performance Report Inspiration PDF is a compilation of the most recent design trends as a series of slides. It is suitable for any subject or industry presentation, containing attractive visuals and photo spots for businesses to clearly express their messages. This template contains a variety of slides for the user to input data, such as structures to contrast two elements, bullet points, and slides for written information. Slidegeeks is prepared to create an impression.


This slide showcases the dashboard to track and monitor performance of CPA marketing campaign. It incorporates metrics such as link clicks, CTR, marketing cost, overall CPA cost, website conversion rate, overall conversion rate, advertising sources, etc. The best PPT templates are a great way to save time, energy, and resources. Slidegeeks have 100 percent editable powerpoint slides making them incredibly versatile. With these quality presentation templates, you can create a captivating and memorable presentation by combining visually appealing slides and effectively communicating your message. Download Strategies For Implementing CPA Marketing Dashboard To Monitor CPA Marketing Campaign Performance Topics PDF from Slidegeeks and deliver a wonderful presentation.


This slide highlights product reposition dashboard which showcases product attributes, advertising awareness, market share, product commitment, repeat purchase and message association. If your project calls for a presentation, then Slidegeeks is your go to partner because we have professionally designed, easy to edit templates that are perfect for any presentation. After downloading, you can easily edit Deploying Revitalization Strategy Enhance Product And Service Sales Reposition Dashboard With Product Slides PDF and make the changes accordingly. You can rearrange slides or fill them with different images. Check out all the handy templates


This slide highlights the product reposition dashboard which showcases market share in regions, emerging markets, after repositioning planned vs actual sales and product revenue by month. Do you have an important presentation coming up Are you looking for something that will make your presentation stand out from the rest Look no further than Deploying Revitalization Strategy Enhance Product And Service Sales Product Reposition Dashboard Highlighting Brochure PDF. With our professional designs, you can trust that your presentation will pop and make delivering it a smooth process. And with Slidegeeks, you can trust that your presentation will be unique and memorable. So why wait Grab Deploying Revitalization Strategy Enhance Product And Service Sales Product Reposition Dashboard Highlighting Brochure PDF today and make your presentation stand out from the rest.
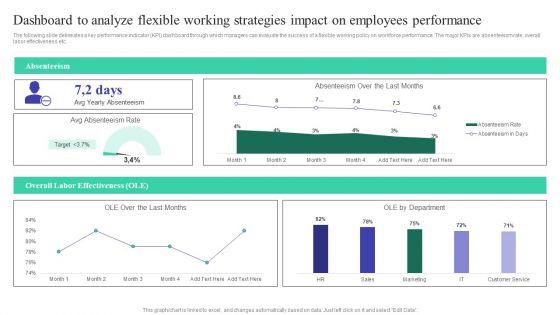
The following slide delineates a key performance indicator KPI dashboard through which managers can evaluate the success of a flexible working policy on workforce performance. The major KPIs are absenteeism rate, overall labor effectiveness etc. If you are looking for a format to display your unique thoughts, then the professionally designed Dashboard To Analyze Flexible Working Strategies Impact On Employees Performance Professional PDF is the one for you. You can use it as a Google Slides template or a PowerPoint template. Incorporate impressive visuals, symbols, images, and other charts. Modify or reorganize the text boxes as you desire. Experiment with shade schemes and font pairings. Alter, share or cooperate with other people on your work. Download Dashboard To Analyze Flexible Working Strategies Impact On Employees Performance Professional PDF and find out how to give a successful presentation. Present a perfect display to your team and make your presentation unforgettable.


The following slide brings forth a dashboard to track important key performance indicators in a project rollout strategy with the purpose of tracking projects in real time with live data. The KPIs are tasks, progress, time, cost and workload. Showcasing this set of slides titled Dashboard To Track Kpis In Project Launch Strategy Pictures PDF. The topics addressed in these templates are Expenses, Project Launch Strategy, Dashboard To Track Kpis. All the content presented in this PPT design is completely editable. Download it and make adjustments in color, background, font etc. as per your unique business setting.


The following slide displays a detailed dashboard to measure website performance of P2E web3 based NFT game. It highlights essential elements such as session frequency, visit frequency, content origin etc. This Business Strategy And Promotional Approach For Multiplayer Oriented Mobile Game Dashboard For Measuring Unique Visitors Topics PDF from Slidegeeks makes it easy to present information on your topic with precision. It provides customization options, so you can make changes to the colors, design, graphics, or any other component to create a unique layout. It is also available for immediate download, so you can begin using it right away. Slidegeeks has done good research to ensure that you have everything you need to make your presentation stand out. Make a name out there for a brilliant performance.


The following slide displays a detailed dashboard to measure website performance of P2E web3 based NFT game. It highlights essential elements such as lead per opportunity, new opportunities, income by in-game purchase Here you can discover an assortment of the finest PowerPoint and Google Slides templates. With these templates, you can create presentations for a variety of purposes while simultaneously providing your audience with an eye catching visual experience. Download Business Strategy And Promotional Approach For Multiplayer Oriented Mobile Game Dashboard For Measuring P2E Web 3 Game Pictures PDF to deliver an impeccable presentation. These templates will make your job of preparing presentations much quicker, yet still, maintain a high level of quality. Slidegeeks has experienced researchers who prepare these templates and write high quality content for you. Later on, you can personalize the content by editing the Business Strategy And Promotional Approach For Multiplayer Oriented Mobile Game Dashboard For Measuring P2E Web 3 Game Pictures PDF.


This slide showcases manufacturing dashboard to track KPIs defined under lean and kaizen process improvement plans. Key performance metrics included here are TEEP, OEE, loading time, production quality, losses by hours, losses by categories etc. Pitch your topic with ease and precision using this Lean Operational Excellence Strategy Manufacturing Dashboard To Check Production System Efficiency Pictures PDF. This layout presents information on Loading, Availability, Performance. It is also available for immediate download and adjustment. So, changes can be made in the color, design, graphics or any other component to create a unique layout.
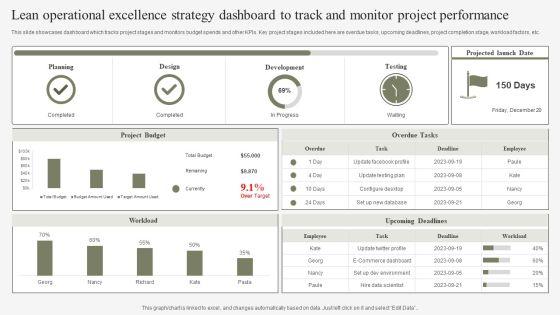
This slide showcases dashboard which tracks project stages and monitors budget spends and other KPIs. Key project stages included here are overdue tasks, upcoming deadlines, project completion stage, workload factors, etc. Pitch your topic with ease and precision using this Lean Operational Excellence Strategy Dashboard To Track And Monitor Project Performance Slides PDF. This layout presents information on Planning, Design, Development. It is also available for immediate download and adjustment. So, changes can be made in the color, design, graphics or any other component to create a unique layout.


This slide represents KPI dashboard showcasing diversity and inclusion strategy which helps in increased employee retention and higher revenue growth. It provides information regarding metrics such as qualified leads, supplier satisfaction, performance and compliance rate and gender diversity. Showcasing this set of slides titled Metric Dashboard Showcasing Diversity And Inclusion Strategy Performance Background PDF. The topics addressed in these templates are Performance, Gender Diversity, Performance. All the content presented in this PPT design is completely editable. Download it and make adjustments in color, background, font etc. as per your unique business setting.


The following slide exhibits dashboard to monitor project statuses and priorities enabling work efficiency. It presents information related to completed tasks, components, etc. Showcasing this set of slides titled Release Management Dashboard For Agile Change Strategy Professional PDF. The topics addressed in these templates are Product Release, Components, Start Date. All the content presented in this PPT design is completely editable. Download it and make adjustments in color, background, font etc. as per your unique business setting.

The following slide exhibits dashboard to track data sets relating to sprint and release management. It presents information related to velocity, task status, etc. Showcasing this set of slides titled Kpi Dashboard To Track Agile Release Management Change Strategy Data Mockup PDF. The topics addressed in these templates are Velocity, Task Status, Incomplete Tasks. All the content presented in this PPT design is completely editable. Download it and make adjustments in color, background, font etc. as per your unique business setting.


Construction Industry KPI Dashboard After Successful Implementation Of Marketing Strategy Sample PDF
This template shows after marketing strategy has been successfully implemented, the construction industry KPI dashboard. The purpose of this slide is to evaluate the construction project. The KPIs such as project in progress, costing of projects, tenure of particular projects , etc. Showcasing this set of slides titled Construction Industry KPI Dashboard After Successful Implementation Of Marketing Strategy Sample PDF. The topics addressed in these templates are Projetcs, Progress Tracking, Costing. All the content presented in this PPT design is completely editable. Download it and make adjustments in color, background, font etc. as per your unique business setting.


This slide depicts a multi channel dashboard for tracking advertising and marketing campaign plan success which provides real time data to track the performance of marketing efforts. The various key performing indicators are cost, conversions and channel performance Showcasing this set of slides titled Advertising And Marketing Campaign Strategy Success Communication Dashboard Inspiration PDF. The topics addressed in these templates are Conversions, Spend, Channel. All the content presented in this PPT design is completely editable. Download it and make adjustments in color, background, font etc. as per your unique business setting.


Mentioned slide outlines a key performance indicator KPI dashboard which will assist managers to showcase the result of customer attrition prevention strategies. The KPIs are risky customers, retention rate, monthly recurring revenue MRR, churn risk by location and income, etc. This Kpi Metrics Dashboard To Measure Success Of Customer Churn Prevention Strategies Ppt PowerPoint Presentation File Model PDF from Slidegeeks makes it easy to present information on your topic with precision. It provides customization options, so you can make changes to the colors, design, graphics, or any other component to create a unique layout. It is also available for immediate download, so you can begin using it right away. Slidegeeks has done good research to ensure that you have everything you need to make your presentation stand out. Make a name out there for a brilliant performance.
Purpose of the following slide is to measure the SEO performance of the organization as it measures the keywords, backlinks, the total number of sessions and average call duration. Welcome to our selection of the Implementing On Site Seo Strategy To Expand Customer Reach Seo Tracking Dashboard Backlinks Formats PDF. These are designed to help you showcase your creativity and bring your sphere to life. Planning and Innovation are essential for any business that is just starting out. This collection contains the designs that you need for your everyday presentations. All of our PowerPoints are 100 percent editable, so you can customize them to suit your needs. This multi purpose template can be used in various situations. Grab these presentation templates today.
Following slide showcases marketing mix progress monitoring dashboard to determine business performance. It includes elements such as clicks, impressions, click through rate, conversion rate, cost per click and monthly overview to Google ads. Showcasing this set of slides titled KPI Dashboard For Tracking Marcom Mix Strategy Progress Ideas PDF. The topics addressed in these templates are Kpi Dashboard, Tracking Marcom, Mix Strategy Progress. All the content presented in this PPT design is completely editable. Download it and make adjustments in color, background, font etc. as per your unique business setting.


This slide portrays key performance dashboard for measuring retail business performance. KPIs covered in the dashboards are average shopping time, shop visitors, average basket spend and customer retention. Boost your pitch with our creative Retail Business Optimization Through Operational Excellence Strategy KPI Dashboard For Retail Business Mockup PDF. Deliver an awe-inspiring pitch that will mesmerize everyone. Using these presentation templates you will surely catch everyones attention. You can browse the ppts collection on our website. We have researchers who are experts at creating the right content for the templates. So you do not have to invest time in any additional work. Just grab the template now and use them.


Mentioned slide illustrates customer satisfaction dashboard. It includes information about net promoter score, customer retention rate and customer effort score. Present like a pro with Retail Business Optimization Through Operational Excellence Strategy Dashboard Measuring Customer Template PDF Create beautiful presentations together with your team, using our easy to use presentation slides. Share your ideas in real time and make changes on the fly by downloading our templates. So whether you are in the office, on the go, or in a remote location, you can stay in sync with your team and present your ideas with confidence. With Slidegeeks presentation got a whole lot easier. Grab these presentations today.


This slide showcases dashboard that can help organization to evaluate the performance of retail outlet after implementing in store promotional campaign. Its key elements are sales revenue, customers, average transaction value, sales by city etc. Do you have an important presentation coming up Are you looking for something that will make your presentation stand out from the rest Look no further than Field Marketing Strategies To Boost Product Sales Dashboard To Track Retail Store Marketing Download PDF. With our professional designs, you can trust that your presentation will pop and make delivering it a smooth process. And with Slidegeeks, you can trust that your presentation will be unique and memorable. So why wait Grab Field Marketing Strategies To Boost Product Sales Dashboard To Track Retail Store Marketing Download PDF today and make your presentation stand out from the rest.


Following dashboard provides a brief overview of progress post implementing drug launch strategy which can be used by medical representatives to monitor the effectiveness. The key performance indicators are units sold, target, revenue, units unsold etc. Showcasing this set of slides titled Dashboard To Track Progress Post Implementing Drug Launch Strategy Slides PDF. The topics addressed in these templates are Planning, Design, Development, Testing, Launch. All the content presented in this PPT design is completely editable. Download it and make adjustments in color, background, font etc. as per your unique business setting.


This slide showcases dashboard that can help organization to track the major information security risks and resolve them in timely manner. Its key components are risk rating breakdown, heat map, action plan and top 5 vulnerabilities. Welcome to our selection of the Developing IT Security Strategy Risk Management Dashboard For Information Security Mockup PDF. These are designed to help you showcase your creativity and bring your sphere to life. Planning and Innovation are essential for any business that is just starting out. This collection contains the designs that you need for your everyday presentations. All of our PowerPoints are 100 percent editable, so you can customize them to suit your needs. This multi-purpose template can be used in various situations. Grab these presentation templates today.


This slide showcases dashboard that can help organization in managing the data security risks. Its key elements are enterprise risk, risk by objectives, data protection finding and overdue actions by status. Slidegeeks has constructed Developing IT Security Strategy Dashboard For Data Security Risk Management Pictures PDF after conducting extensive research and examination. These presentation templates are constantly being generated and modified based on user preferences and critiques from editors. Here, you will find the most attractive templates for a range of purposes while taking into account ratings and remarks from users regarding the content. This is an excellent jumping-off point to explore our content and will give new users an insight into our top-notch PowerPoint Templates.


This slide showcases support service dashboard to track relevant performance metrics. Major KPIs covered are customer satisfaction, average time to resolve problem, cost per support, customer retention, request volume, etc. Presenting this PowerPoint presentation, titled Customer Service Dashboard Strategies To Improve Customer Support Services Sample PDF, with topics curated by our researchers after extensive research. This editable presentation is available for immediate download and provides attractive features when used. Download now and captivate your audience. Presenting this Customer Service Dashboard Strategies To Improve Customer Support Services Sample PDF. Our researchers have carefully researched and created these slides with all aspects taken into consideration. This is a completely customizable Customer Service Dashboard Strategies To Improve Customer Support Services Sample PDF that is available for immediate downloading. Download now and make an impact on your audience. Highlight the attractive features available with our PPTs.


This slide highlights the banking operation strategy dashboard which showcases current account and saving account growth rate, savings account deposits, current account deposits and retail term deposits. Here you can discover an assortment of the finest PowerPoint and Google Slides templates. With these templates, you can create presentations for a variety of purposes while simultaneously providing your audience with an eye catching visual experience. Download Banking Operation Strategy Dashboard Highlighting Deposits And Growth Rate Structure PDF to deliver an impeccable presentation. These templates will make your job of preparing presentations much quicker, yet still, maintain a high level of quality. Slidegeeks has experienced researchers who prepare these templates and write high quality content for you. Later on, you can personalize the content by editing the Banking Operation Strategy Dashboard Highlighting Deposits And Growth Rate Structure PDF.


This slide highlights the banking operation strategy which includes accounts opened and closed, total deposit vs branch goal, accounts by type, expense to budget and referrals by product. Presenting this PowerPoint presentation, titled Banking Operation Strategy Dashboard Highlighting Accounts And Product Referrals Elements PDF, with topics curated by our researchers after extensive research. This editable presentation is available for immediate download and provides attractive features when used. Download now and captivate your audience. Presenting this Banking Operation Strategy Dashboard Highlighting Accounts And Product Referrals Elements PDF. Our researchers have carefully researched and created these slides with all aspects taken into consideration. This is a completely customizable Banking Operation Strategy Dashboard Highlighting Accounts And Product Referrals Elements PDF that is available for immediate downloading. Download now and make an impact on your audience. Highlight the attractive features available with our PPTs.
This slide covers metrics for analysing the results of Twitter retargeting campaigns. It includes KPIs such as click-through rate, impressions, conversion rate, cost, cost per click, etc. Get a simple yet stunning designed Retargeting Strategies To Improve Sales Dashboard For Tracking Twitter Retargeting Campaign Ideas PDF. It is the best one to establish the tone in your meetings. It is an excellent way to make your presentations highly effective. So, download this PPT today from Slidegeeks and see the positive impacts. Our easy-to-edit Retargeting Strategies To Improve Sales Dashboard For Tracking Twitter Retargeting Campaign Ideas PDF can be your go-to option for all upcoming conferences and meetings. So, what are you waiting for Grab this template today.
This slide covers metrics for analyzing the social media retargeting campaign results. It includes KPIs such as user acquisitions, organic installs, inorganic installs, cost, etc. Do you have to make sure that everyone on your team knows about any specific topic I yes, then you should give Retargeting Strategies To Improve Sales Dashboard For Tracking Social Media Retargeting Rules PDF a try. Our experts have put a lot of knowledge and effort into creating this impeccable Retargeting Strategies To Improve Sales Dashboard For Tracking Social Media Retargeting Rules PDF. You can use this template for your upcoming presentations, as the slides are perfect to represent even the tiniest detail. You can download these templates from the Slidegeeks website and these are easy to edit. So grab these today.
This slide covers metrics for analysing the results of Facebook retargeting campaign. It includes KPIs such as ad spend, cost per click, click-through rate, ad reach, post engagement, ad clicks, ad impressions, link clicks, etc. Want to ace your presentation in front of a live audience Our Retargeting Strategies To Improve Sales Dashboard For Tracking Facebook Retargeting Campaign Background PDF can help you do that by engaging all the users towards you.. Slidegeeks experts have put their efforts and expertise into creating these impeccable powerpoint presentations so that you can communicate your ideas clearly. Moreover, all the templates are customizable, and easy-to-edit and downloadable. Use these for both personal and commercial use.


The following slide outlines performance key performance indicator KPI dashboard that can assist marketers to evaluate online and offline real estate promotional techniques performance. The metrics covered are quarterly sales, deals won, expired contracts, revenue, conversion rates, etc. Coming up with a presentation necessitates that the majority of the effort goes into the content and the message you intend to convey. The visuals of a PowerPoint presentation can only be effective if it supplements and supports the story that is being told. Keeping this in mind our experts created KPI Dashboard To Measure Effectiveness Of Real Estate Marketing Strategies Inspiration PDF to reduce the time that goes into designing the presentation. This way, you can concentrate on the message while our designers take care of providing you with the right template for the situation.


The following slide highlights the various key performance indicators of the AIOps, these can be problem quick review, cloud and infrastructure and applications health If you are looking for a format to display your unique thoughts, then the professionally designed Operational Strategy For ML In IT Sector Aiops Dashboard To Monitor IT Operations Diagrams PDF is the one for you. You can use it as a Google Slides template or a PowerPoint template. Incorporate impressive visuals, symbols, images, and other charts. Modify or reorganize the text boxes as you desire. Experiment with shade schemes and font pairings. Alter, share or cooperate with other people on your work. Download Operational Strategy For ML In IT Sector Aiops Dashboard To Monitor IT Operations Diagrams PDF and find out how to give a successful presentation. Present a perfect display to your team and make your presentation unforgettable.


Mentioned slide outlines a key performance indicator KPI dashboard which will assist managers to showcase the result of customer attrition prevention strategies. The KPIs are risky customers, retention rate, monthly recurring revenue MRR, churn risk by location and income, etc. This KPI Metrics Dashboard To Measure Success Of Customer Churn Prevention Strategies Diagrams PDF is perfect for any presentation, be it in front of clients or colleagues. It is a versatile and stylish solution for organizing your meetings. The KPI Metrics Dashboard To Measure Success Of Customer Churn Prevention Strategies Diagrams PDF features a modern design for your presentation meetings. The adjustable and customizable slides provide unlimited possibilities for acing up your presentation. Slidegeeks has done all the homework before launching the product for you. So, do not wait, grab the presentation templates today
This slide covers PPC marketing dashboard to improve efficiency. It involves total spends, number of clicks, cost per conversion, change in conversion rate and cost per thousand impression. Make sure to capture your audiences attention in your business displays with our gratis customizable PPC Marketing KPI Dashboard To Analyse Strategy Efficiency Icons PDF. These are great for business strategies, office conferences, capital raising or task suggestions. If you desire to acquire more customers for your tech business and ensure they stay satisfied, create your own sales presentation with these plain slides.


This slide showcases dashboard that can help organization to track the visitors on landing pages of different brands. Its key elements are forecast purchasers, customer acquisition cost and visitors count by landing pages. From laying roadmaps to briefing everything in detail, our templates are perfect for you. You can set the stage with your presentation slides. All you have to do is download these easy-to-edit and customizable templates. Targeted Market Entry Strategy Dashboard To Track Website Visitors On Brand Landing Guidelines PDF will help you deliver an outstanding performance that everyone would remember and praise you for. Do download this presentation today.


This slide showcases dashboard that can help organization to manage the marketing campaigns in multi brand strategy. Its key elements are lead breakdown, total leads, key conversion metrics etc. Get a simple yet stunning designed Targeted Market Entry Strategy Dashboard To Manage Marketing Campaigns Of Multiple Introduction PDF. It is the best one to establish the tone in your meetings. It is an excellent way to make your presentations highly effective. So, download this PPT today from Slidegeeks and see the positive impacts. Our easy-to-edit Targeted Market Entry Strategy Dashboard To Manage Marketing Campaigns Of Multiple Introduction PDF can be your go-to option for all upcoming conferences and meetings. So, what are you waiting for Grab this template today.


This slide showcases dashboard that can help organization to track the website traffic after running online brand awareness marketing campaigns. Its key components are new visitors, traffic by source, traffic by lead source, customers wins by lead source and bounce rate. Present like a pro with Strategies For Marketing Dashboard To Track Website Traffic After Brand Awareness Graphics PDF Create beautiful presentations together with your team, using our easy-to-use presentation slides. Share your ideas in real-time and make changes on the fly by downloading our templates. So whether youre in the office, on the go, or in a remote location, you can stay in sync with your team and present your ideas with confidence. With Slidegeeks presentation got a whole lot easier. Grab these presentations today.
This slide showcases dashboard that can help organization to track results of online advertisement campaigns. Its key components ad impressions, click through rate, cost per conversion, revenue per click, impressions, new users and sessions. From laying roadmaps to briefing everything in detail, our templates are perfect for you. You can set the stage with your presentation slides. All you have to do is download these easy-to-edit and customizable templates. Strategies For Marketing Dashboard For Tracking Brand Awareness Advertisement Themes PDF will help you deliver an outstanding performance that everyone would remember and praise you for. Do download this presentation today.
SHOW
- 60
- 120
- 180
DISPLAYING: 60 of 566 Item(s)
Page