 AI PPT Maker
 Templates
 PPT Bundles
 Design Services
 Business PPTs
 Business Plan
 Management
 Strategy
 Introduction PPT
 Roadmap
 Self Introduction
 Timelines
 Process
 Marketing
 Agenda
 Technology
 Medical
 Startup Business Plan
 Cyber Security
 Dashboards
 SWOT
SWOT Proposals
 Education
 Pitch Deck
 Digital Marketing
 KPIs
KPIs Project Management
 Product Management
 Artificial Intelligence
 Target Market
 Communication
 Supply Chain
 Google Slides
 Research Services
 One Pagers
 All Categories
Statistics showing PowerPoint Presentation Templates and Google Slides
SHOW
- 60
- 120
- 180
DISPLAYING: 60 of 149 Item(s)
Page


Presenting this set of slides with name magnifying glass with arrow statistical analysis vector icon ppt powerpoint presentation show icon. This is a three stage process. The stages in this process are data icon, status icon, status symbol icon. This is a completely editable PowerPoint presentation and is available for immediate download. Download now and impress your audience.


Presenting this set of slides with name seo statistics technology ppt powerpoint presentation show file formats. This is a six stage process. The stages in this process are business, management, planning, strategy, marketing. This is a completely editable PowerPoint presentation and is available for immediate download. Download now and impress your audience.


We present our templates statistical pie diagram 6 stages show me business plan PowerPoint.Use our Circle Charts PowerPoint Templates because You can Bask in the warmth of our PowerPoint Templates and Slides. Enjoy the heartfelt glowing response of your listeners. Download our Marketing PowerPoint Templates because Our PowerPoint Templates and Slides will Activate the energies of your audience. Get their creative juices flowing with your words. Download our Business PowerPoint Templates because Our PowerPoint Templates and Slides ensures Effective communication. They help you put across your views with precision and clarity. Use our Flow Charts PowerPoint Templates because Our PowerPoint Templates and Slides are truly out of this world. Even the MIB duo has been keeping tabs on our team. Use our Process and Flows PowerPoint Templates because It can be used to Set your controls for the heart of the sun. Our PowerPoint Templates and Slides will be the propellant to get you there.Use these PowerPoint slides for presentations relating to Chart, pie, diagram, slice, icon, market, statistics, sales, economy, green, achievement, corporate,business, sign, render, success, presentation, symbol,circle, graphic, finance,marketing, shape, graph, illustration, piece, division, money, growth, company, progress, profit, information, part, investment, improvement, financial . The prominent colors used in the PowerPoint template are Green, Gray, Black. Maintain growth with our Templates Statistical Pie Diagram 6 Stages Show Me Business Plan PowerPoint. Download without worries with our money back guaranteee.
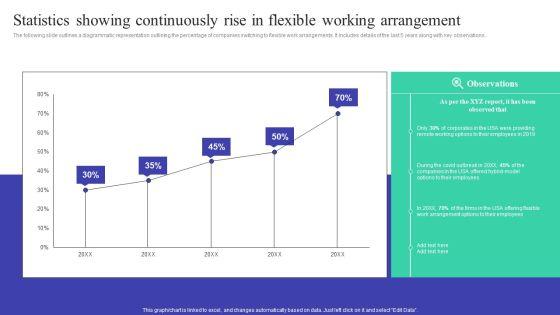
The following slide outlines a diagrammatic representation outlining the percentage of companies switching to flexible work arrangements. It includes details of the last 5 years along with key observations. This Implementing Adaptive Work Arrangements Statistics Showing Continuously Rise In Flexible Working Arrangement Information PDF from Slidegeeks makes it easy to present information on your topic with precision. It provides customization options, so you can make changes to the colors, design, graphics, or any other component to create a unique layout. It is also available for immediate download, so you can begin using it right away. Slidegeeks has done good research to ensure that you have everything you need to make your presentation stand out. Make a name out there for a brilliant performance.


This slide shows various top trends related to future of public relations industry, It includes trends such as digital story telling, social listening, social purpose, big data, etc. This modern and well arranged Online PR Techniques To Boost Brands Online Visibility Statistics Showing Future Trends In PR Industry Ideas PDF provides lots of creative possibilities. It is very simple to customize and edit with the Powerpoint Software. Just drag and drop your pictures into the shapes. All facets of this template can be edited with Powerpoint no extra software is necessary. Add your own material, put your images in the places assigned for them, adjust the colors, and then you can show your slides to the world, with an animated slide included.
This slide showcases affect of efficiently designing logo to make customers easily recognize brand. It showcases information about brand personality, logo design, brand recognition, visual style, brand color, unique value, etc. QDo you have to make sure that everyone on your team knows about any specific topic I yes, then you should give Statistics Showing Impact Of Designing An Effective Logo Ppt PowerPoint Presentation File Icon PDF a try. Our experts have put a lot of knowledge and effort into creating this impeccable Statistics Showing Impact Of Designing An Effective Logo Ppt PowerPoint Presentation File Icon PDF. You can use this template for your upcoming presentations, as the slides are perfect to represent even the tiniest detail. You can download these templates from the Slidegeeks website and these are easy to edit. So grab these today.


This graph or chart is linked to excel, and changes automatically based on data. Just left click on it and select Edit Data. Slidegeeks is one of the best resources for PowerPoint templates. You can download easily and regulate Key Statistics Showing The Impact Of Security Awareness Training Software Elements PDF for your personal presentations from our wonderful collection. A few clicks is all it takes to discover and get the most relevant and appropriate templates. Use our Templates to add a unique zing and appeal to your presentation and meetings. All the slides are easy to edit and you can use them even for advertisement purposes.


The following slide showcases graphical representation of market leader yearly sales. The slide covers detailed information about 4 years annual sales along with compound annual growth rate CAGR. Make sure to capture your audiences attention in your business displays with our gratis customizable Comprehensive Guide To Build Marketing Statistics Showing Annual Sales Of Industry Portrait PDF. These are great for business strategies, office conferences, capital raising or task suggestions. If you desire to acquire more customers for your tech business and ensure they stay satisfied, create your own sales presentation with these plain slides.


This slide presents an statistics reports providing valuable insights of global market based on data collection and analysis. It covers key elements such as forecasted market CAGR, incremental growth, estimated YoY rate, revenue generating market region and key drivers. Do you have to make sure that everyone on your team knows about any specific topic I yes, then you should give Guidebook For Executing Business Market Intelligence Statistics Report Showing Market Graphics PDF a try. Our experts have put a lot of knowledge and effort into creating this impeccable Guidebook For Executing Business Market Intelligence Statistics Report Showing Market Graphics PDF. You can use this template for your upcoming presentations, as the slides are perfect to represent even the tiniest detail. You can download these templates from the Slidegeeks website and these are easy to edit. So grab these today.


This slide shows various top trends related to future of public relations industry, It includes trends such as digital story telling, social listening, social purpose, big data, etc. This Public Relations Guide To Enhance Brand Credibility Statistics Showing Future Trends In PR Industry Ideas PDF from Slidegeeks makes it easy to present information on your topic with precision. It provides customization options, so you can make changes to the colors, design, graphics, or any other component to create a unique layout. It is also available for immediate download, so you can begin using it right away. Slidegeeks has done good research to ensure that you have everything you need to make your presentation stand out. Make a name out there for a brilliant performance.


This modern and well arranged Implementing Cybersecurity Awareness Program To Prevent Attacks Key Statistics Showing The Impact Of Security Clipart PDF provides lots of creative possibilities. It is very simple to customize and edit with the Powerpoint Software. Just drag and drop your pictures into the shapes. All facets of this template can be edited with Powerpoint no extra software is necessary. Add your own material, put your images in the places assigned for them, adjust the colors, and then you can show your slides to the world, with an animated slide included.


This slide shows the financial analysis of current and quick ratio. It can be used by a firm to graphically represent current and quick ratio status. Pitch your topic with ease and precision using this Statistics Showing Comparative Evaluation Of Financial Position Ratios Download PDF. This layout presents information on Current Ratio, Quick Ratio, 2021 To 2023. It is also available for immediate download and adjustment. So, changes can be made in the color, design, graphics or any other component to create a unique layout.


The slide outlines impact of building strong and attractive employee value proposition on business. It provides information about need of compensation premium to recruit workers, categories of compensation premium, annual turnover, attraction savings and turnover cost savings. There are so many reasons you need a Creating Employee Value Proposition Statistics Showing Effectiveness Of Employee Value Ideas PDF. The first reason is you cant spend time making everything from scratch, Thus, Slidegeeks has made presentation templates for you too. You can easily download these templates from our website easily.


Mentioned slide graphically shows impact of strategic training before and after impact of training and development on employees performance. The various points covered in the slide are capacity to adopt new methods, job satisfaction and morale, employee turnover, etc. Pitch your topic with ease and precision using this Statistics Showing Impact Of Conducting Employee Training And Development Plan Brochure PDF. This layout presents information on Strategy Employees, Development, Methods And Techniques. It is also available for immediate download and adjustment. So, changes can be made in the color, design, graphics or any other component to create a unique layout.


The following slide outlines a diagrammatic representation outlining the percentage of companies switching to flexible work arrangements. It includes details of the last 5 years along with key observations. This Statistics Showing Continuously Rise In Flexible Working Arrangement Background PDF from Slidegeeks makes it easy to present information on your topic with precision. It provides customization options, so you can make changes to the colors, design, graphics, or any other component to create a unique layout. It is also available for immediate download, so you can begin using it right away. Slidegeeks has done good research to ensure that you have everything you need to make your presentation stand out. Make a name out there for a brilliant performance.


This template shows the Key statistics illustrating RPA management in various segments. The purpose of this slide to bifurcated on the segments for easy evaluation . It includes major such as company, designation, geography, etc. Showcasing this set of slides titled Key Statistics Showing Robotic Process Automation Solutions Management In Different Segments Pictures PDF. The topics addressed in these templates are Company Type, Designation, Geography. All the content presented in this PPT design is completely editable. Download it and make adjustments in color, background, font etc. as per your unique business setting.


The following slide outlines major statistics highlighting the size and composition of healthcare workforce. Doctors, nurses, midwives, pharmacists, allied health professionals and community health workers are some of the major players involved in the healthcare workforce. Pitch your topic with ease and precision using this Statistics Showing Composition Of Healthcare Employees Themes PDF. This layout presents information on Workers Healthcare, Proportion Community, Health Workers Highest. It is also available for immediate download and adjustment. So, changes can be made in the color, design, graphics or any other component to create a unique layout.


The following slide outlines a comprehensive healthcare dashboard showing various workforce trends. It covers information about doctors and nurses organic growth, shortages of doctors nurses, local vs foreign trained healthcare employees etc. Showcasing this set of slides titled KPI Dashboard Showing Healthcare Employees Statistics Graphics PDF. The topics addressed in these templates are Shortage Doctors, Shortage Nurse, Organic Growth. All the content presented in this PPT design is completely editable. Download it and make adjustments in color, background, font etc. as per your unique business setting.


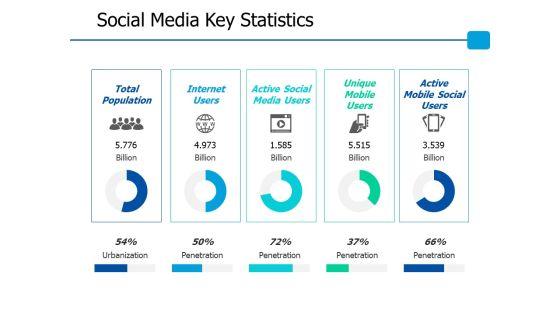
Looking for a predesigned One Page Data Sheet Showing World Population Statistics PDF Document PPT Template Heres the perfect piece for you It has everything that a well-structured one-pager template should have. Besides, it is 100 percent editable, which offers you the cushion to make adjustments according to your preferences. Grab this One Page Data Sheet Showing World Population Statistics PDF Document PPT Template Download now.


Following slide outlines a graphical representation of tactics leveraged by companies after using customer data platform. It covers information about various reasons such as personalized email, addressable advertising, real-time targeting, change social media channels etc. Showcasing this set of slides titled Statistics Showing Customer Information Software Insights Portrait PDF. The topics addressed in these templates are Companies Leveraged, Personalized Marketing, Addressable Advertising. All the content presented in this PPT design is completely editable. Download it and make adjustments in color, background, font etc. as per your unique business setting.


This graph or chart is linked to excel, and changes automatically based on data. Just left click on it and select Edit Data. This modern and well-arranged Prevention Of Information Key Statistics Showing The Impact Of Security Awareness Infographics PDF provides lots of creative possibilities. It is very simple to customize and edit with the Powerpoint Software. Just drag and drop your pictures into the shapes. All facets of this template can be edited with Powerpoint, no extra software is necessary. Add your own material, put your images in the places assigned for them, adjust the colors, and then you can show your slides to the world, with an animated slide included.


Pitch your topic with ease and precision using this Statistics Showing Management Analyst Salary Structure By Different Countries Sample PDF. This layout presents information on Annual Salary, Key Insights, USA Provide, Highest Salary. It is also available for immediate download and adjustment. So, changes can be made in the color, design, graphics or any other component to create a unique layout.
The following slide outlines a diagrammatic representation outlining the percentage of companies switching to flexible work arrangements. It includes details of the last 5 years along with key observations. Presenting this PowerPoint presentation, titled Adopting Flexible Work Policy Statistics Showing Continuously Rise In Flexible Icons PDF, with topics curated by our researchers after extensive research. This editable presentation is available for immediate download and provides attractive features when used. Download now and captivate your audience. Presenting this Adopting Flexible Work Policy Statistics Showing Continuously Rise In Flexible Icons PDF. Our researchers have carefully researched and created these slides with all aspects taken into consideration. This is a completely customizable Adopting Flexible Work Policy Statistics Showing Continuously Rise In Flexible Icons PDF that is available for immediate downloading. Download now and make an impact on your audience. Highlight the attractive features available with our PPTs.


Coming up with a presentation necessitates that the majority of the effort goes into the content and the message you intend to convey. The visuals of a PowerPoint presentation can only be effective if it supplements and supports the story that is being told. Keeping this in mind our experts created Organizing Security Awareness Key Statistics Showing The Impact Of Security Awareness Clipart PDF to reduce the time that goes into designing the presentation. This way, you can concentrate on the message while our designers take care of providing you with the right template for the situation.


Mentioned slide showcases key statistics related to growth rate of cloud based project management industry. Information covered in this slide is related to CAGR, incremental growth, impact on IT industry, growth for the year 2022, etc. Showcasing this set of slides titled Statistics Showing Growth Rate Of Cloud Computing Project Administration Ppt Ideas Aids PDF. The topics addressed in these templates are IT Industry, Growth 2023, Incremental Growth. All the content presented in this PPT design is completely editable. Download it and make adjustments in color, background, font etc. as per your unique business setting.


This slide contains graph which can be used by cosmetic manufacturing organizations to represent difference between annual sales of various products. It includes products such as skin care, hair care, oral care and others. Showcasing this set of slides titled Statistics Showing Annual Comparison Of Multiple Beauty Care Products Ppt Infographics Objects PDF. The topics addressed in these templates are Skin Care, Hair Care, 2022 To 2023. All the content presented in this PPT design is completely editable. Download it and make adjustments in color, background, font etc. as per your unique business setting.


This slide shows the graph which can be used by an organization to show department wise improvement in employee productivity. It covers departments such as marketing, finance, IT, research, sales and HR. Pitch your topic with ease and precision using this Key Statistics Showing Staff Productivity Enhancement In Various Departments Ppt PowerPoint Presentation Slides Portrait PDF. This layout presents information on XXXXXXXXXXXXXXXXXXXXXXXXX. It is also available for immediate download and adjustment. So, changes can be made in the color, design, graphics or any other component to create a unique layout.


Mentioned slide showcase critical statistics that provides complete overview of consumer intelligence survey conducted. As per the survey, companies that uses data collection and analytics tools well, had increased their profits in comparison to those who didnt use. Showcasing this set of slides titled Statistics Showing Consumer Intelligence Insights Ppt PowerPoint Presentation Gallery Information PDF. The topics addressed in these templates are Insurer, Global Customers, Insurance Executives. All the content presented in this PPT design is completely editable. Download it and make adjustments in color, background, font etc. as per your unique business setting.


Mentioned slide showcases key statistics highlighting companys revenue after implementing merchandising strategies. It covers information about free product sample, free shipping, discount and odd pricing. Pitch your topic with ease and precision using this Statistics Showing Revenue Generated From Various Retail Merchandising Plan Background PDF. This layout presents information on Highest Amount, Discount Customers, Revenue Generated. It is also available for immediate download and adjustment. So, changes can be made in the color, design, graphics or any other component to create a unique layout.


Understanding the usage of user made video is a key aspect of vidyard pitch deck, the provided slide displays the increase in sales of professionals, percentage of people who watch videos under 1 minute, total number of video analytics tools used . Deliver an awe inspiring pitch with this creative Vidyard Elevator Funding Key Industry Statistics For Video Marketing Ppt Show Diagrams PDF bundle. Topics like Sales Professionals Agree, Prospect Engagement, Valued Online can be discussed with this completely editable template. It is available for immediate download depending on the needs and requirements of the user.


Deliver an awe inspiring pitch with this creative Key Statistics Showing The Impact Of Security Awareness Training Software Information PDF bundle. Topics like Attacked Phishing, Employees Will, Phishing During can be discussed with this completely editable template. It is available for immediate download depending on the needs and requirements of the user.


This slide exhibits key statistics highlighting overview of managed security service market with expected market growth rate from 2020 to 2030 along with key insights. Pitch your topic with ease and precision using this Statistics Showing Growth Rate Of Managed Cyber Security Solutions Service Market Ppt Show Inspiration PDF. This layout presents information on Statistics Showing Growth, Cyber Security, Solutions Service Market. It is also available for immediate download and adjustment. So, changes can be made in the color, design, graphics or any other component to create a unique layout.


Purpose of this slide is to address the key statistics on location based services LBS market. It provide details about the service awareness, usage and concerns of consumers. Deliver an awe inspiring pitch with this creative LBS Application Elevator Location Based Services Market Statistics Ppt Outline Show PDF bundle. Topics like Location Based, Provide Services, Current Location can be discussed with this completely editable template. It is available for immediate download depending on the needs and requirements of the user.


Following slide highlights success rate of talent assessment practices used by business organizations at the time of recruitment. Skill test, cognitive ability test, integrity test, emotional intelligence test, personality test and job experience are some of key practices followed by organizations.Pitch your topic with ease and precision using this Statistics Showing Success Rate Of Skill Evaluation Practices Topics PDF This layout presents information on Emotional Intelligence, Test Cognitive, Personality Test It is also available for immediate download and adjustment. So, changes can be made in the color, design, graphics or any other component to create a unique layout.


This slides signifies the team coordination and collaboration activities with success rate. It includes office party, icebreaker session, debates and board games for implementing organisation growth. Pitch your topic with ease and precision using this Statistics Showing Success Rate Of Team Collaboration Activities Information PDF This layout presents information on Highest Success, Lowest Success, Team Coordination It is also available for immediate download and adjustment. So, changes can be made in the color, design, graphics or any other component to create a unique layout.
Persuade your audience using this Statistical Data Showing Sales Strategy Framework Icon Clipart PDF. This PPT design covers three stages, thus making it a great tool to use. It also caters to a variety of topics including Statistical Data, Showing Sales Strategy, Framework Icon. Download this PPT design now to present a convincing pitch that not only emphasizes the topic but also showcases your presentation skills.


The following slide displays impact of inbound and outbound marketing activities on companys revenue. It provides information about blogs, social media marketing, search engine optimization SEO, direct mail, telemarketing and trade shows. Pitch your topic with ease and precision using this Statistics Showing Impact Of Inbound And Outbound Marketing Diagrams PDF. This layout presents information on Telemarketing, Social Media, Blogs. It is also available for immediate download and adjustment. So, changes can be made in the color, design, graphics or any other component to create a unique layout.
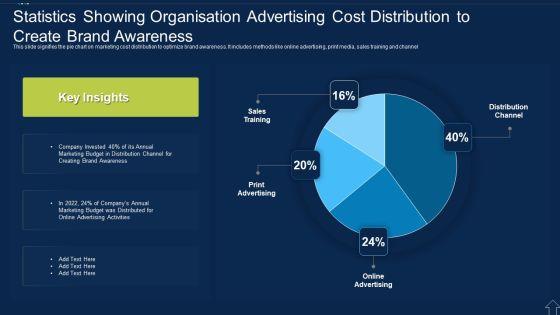
This slide signifies the pie chart on marketing cost distribution to optimize brand awareness. It includes methods like online advertising, print media, sales training and channel.Showcasing this set of slides titled Statistics Showing Organisation Advertising Cost Distribution To Create Brand Awareness Slides PDF The topics addressed in these templates are Creating Brand Awareness, Marketing Budget, Advertising Activities All the content presented in this PPT design is completely editable. Download it and make adjustments in color, background, font etc. as per your unique business setting.


The purpose of this slide is to outline the various statistics of marketing analytics tool. The statistics are related to customer acquisition, customer retention, social media, segmentation, promotion strategy etc. Showcasing this set of slides titled Statistics Showing Impact Of Marketing Analytics Tool Background PDF. The topics addressed in these templates are Marketing, Organizations, Customers. All the content presented in this PPT design is completely editable. Download it and make adjustments in color, background, font etc. as per your unique business setting.


The purpose of this slide is to highlight the results of digital marketing campaign. Information covered in this slide is related to which page have the highest and lowest number of users, bounce rate, average session duration and average time spent on each page. Showcasing this set of slides titled Digital Marketing Campaign Results Showing Key Statistics Rules PDF. The topics addressed in these templates are Digital Marketing Campaign Results Showing Key Statistics. All the content presented in this PPT design is completely editable. Download it and make adjustments in color, background, font etc. as per your unique business setting.


The purpose of this slide is to exhibit key statistics illustrating the top cryptocurrency performance during the Russia-Ukraine crisis. Bitcoin, Ether, Ripple and Biance Coin are some of the major cryptocurrency which are highlighted in this slide. Deliver and pitch your topic in the best possible manner with this russia ukraine statistics showing major cryptocurrency performance during russia ukraine conflict summary pdf. Use them to share invaluable insights on invasion could occur anytime, russia invades ukraine and impress your audience. This template can be altered and modified as per your expectations. So, grab it now.


This slide represents the statistics of reverse proxies used by websites, and it shows that most websites do not use any reverse proxy services, and 17 percent use CDNs. Presenting reverse proxy server it statistics of reverse proxies used by websites ppt show introduction pdf to provide visual cues and insights. Share and navigate important information on one stages that need your due attention. This template can be used to pitch topics like proxy services, content delivery network, security measure. In addtion, this PPT design contains high resolution images, graphics, etc, that are easily editable and available for immediate download.


The purpose of this slide is to showcase major statistics illustrating the customer loyalty program results. The key statistics covered in the slide are extent of consumers loyalty to different brand, customers response to new brands and the various factors for brand loyalty. Pitch your topic with ease and precision using this various statistics showing results of customer brand loyalty program background pdf. This layout presents information on extent of customer loyalty to brands, customers responsiveness to new brands, brand loyalty matters. It is also available for immediate download and adjustment. So, changes can be made in the color, design, graphics or any other component to create a unique layout.
SHOW
- 60
- 120
- 180
DISPLAYING: 60 of 149 Item(s)
Page