 AI PPT Maker
 Templates
 PPT Bundles
 Design Services
 Business PPTs
 Business Plan
 Management
 Strategy
 Introduction PPT
 Roadmap
 Self Introduction
 Timelines
 Process
 Marketing
 Agenda
 Technology
 Medical
 Startup Business Plan
 Cyber Security
 Dashboards
 SWOT
SWOT Proposals
 Education
 Pitch Deck
 Digital Marketing
 KPIs
KPIs Project Management
 Product Management
 Artificial Intelligence
 Target Market
 Communication
 Supply Chain
 Google Slides
 Research Services
 One Pagers
 All Categories
Charts-graphs PowerPoint Presentation Templates and Google Slides
56 Item(s)


Presenting this set of slides with name area chart graph ppt powerpoint presentation diagram templates. The topics discussed in these slides are marketing, business, management, planning, strategy. This is a completely editable PowerPoint presentation and is available for immediate download. Download now and impress your audience.


Presenting this set of slides with name bar chart graph ppt powerpoint presentation outline structure. The topics discussed in these slides are marketing, business, management, planning, strategy. This is a completely editable PowerPoint presentation and is available for immediate download. Download now and impress your audience.


Presenting this set of slides with name area chart graph ppt powerpoint presentation inspiration graphics pictures. The topics discussed in these slides are marketing, business, management, planning, strategy. This is a completely editable PowerPoint presentation and is available for immediate download. Download now and impress your audience.


Presenting this set of slides with name bubble chart graph ppt powerpoint presentation gallery visuals. The topics discussed in these slides are marketing, business, management, planning, strategy. This is a completely editable PowerPoint presentation and is available for immediate download. Download now and impress your audience.


Presenting this set of slides with name area chart graph ppt powerpoint presentation infographic template template. The topics discussed in these slides are marketing, business, management, planning, strategy. This is a completely editable PowerPoint presentation and is available for immediate download. Download now and impress your audience.


Presenting this set of slides with name column chart graph ppt powerpoint presentation show model. The topics discussed in these slides are marketing, business, management, planning, strategy. This is a completely editable PowerPoint presentation and is available for immediate download. Download now and impress your audience.


Presenting this set of slides with name bar chart graph ppt powerpoint presentation ideas show. The topics discussed in these slides are marketing, business, management, planning, strategy. This is a completely editable PowerPoint presentation and is available for immediate download. Download now and impress your audience.


Presenting this set of slides with name line chart graph ppt powerpoint presentation gallery structure. The topics discussed in these slides are marketing, business, management, planning, strategy. This is a completely editable PowerPoint presentation and is available for immediate download. Download now and impress your audience.


Presenting this set of slides with name line chart graph bar ppt powerpoint presentation gallery layout. The topics discussed in these slides are marketing, business, management, planning, strategy. This is a completely editable PowerPoint presentation and is available for immediate download. Download now and impress your audience.


Presenting this set of slides with name area chart graph ppt powerpoint presentation infographics slide download. The topics discussed in these slides are marketing, business, management, planning, strategy. This is a completely editable PowerPoint presentation and is available for immediate download. Download now and impress your audience.


Presenting this set of slides with name gantt chart bar graph ppt powerpoint presentation summary rules. The topics discussed in these slides are marketing, business, management, planning, strategy. This is a completely editable PowerPoint presentation and is available for immediate download. Download now and impress your audience.


Presenting this set of slides with name gantt chart graph ppt powerpoint presentation inspiration examples. The topics discussed in these slides are marketing, business, management, planning, strategy. This is a completely editable PowerPoint presentation and is available for immediate download. Download now and impress your audience


Do the done thing with your thoughts. Uphold custom with our Business Chart And Graph Through laptop PowerPoint Templates PPT Backgrounds For Slides. Be a donor of great ideas. Display your charity on our Computer PowerPoint Templates. Make a donation of your ideas. Our Pie Charts PowerPoint Templates will convey your charitable attitude. Keep away from fallacious arguments. Our Business Chart And Graph Through Laptop PowerPoint Templates Ppt Backgrounds For Slides 0713 will extract the facts.


Doll up your thoughts with our Business Chart Bar Graph PowerPoint Templates PPT Backgrounds For Slides. They will make a pretty picture. They say a dog is man's best friend. Our Marketing PowerPoint Templates come a close second. Establish the dominance of your ideas. Our ArrowsPowerPoint Templates will put them on top. Earn the esteem of your colleagues with our Business Chart Bar Graph PowerPoint Templates Ppt Backgrounds For Slides 0513. Give your thoughts that something special.


We present our Business Chart And Graphs On Computer Tablet PowerPoint Templates PPT Backgrounds For Slides 0113.Download our Computer PowerPoint Templates because Our PowerPoint Templates and Slides are truly out of this world. Even the MIB duo has been keeping tabs on our team. Download our Pie charts PowerPoint Templates because It will get your audience in sync. Download and present our Marketing PowerPoint Templates because Our PowerPoint Templates and Slides will definately Enhance the stature of your presentation. Adorn the beauty of your thoughts with their colourful backgrounds. Download and present our Success PowerPoint Templates because It will Raise the bar of your Thoughts. They are programmed to take you to the next level. Download and present our Business PowerPoint Templates because Our PowerPoint Templates and Slides come in all colours, shades and hues. They help highlight every nuance of your views.Use these PowerPoint slides for presentations relating to computer tablet showing a spreadsheet with charts, computer, business, success, pie charts, marketing. The prominent colors used in the PowerPoint template are Green, Red, Gray. The feedback we get is that our Business Chart And Graphs On Computer Tablet PowerPoint Templates PPT Backgrounds For Slides 0113 are incredible easy to use. PowerPoint presentation experts tell us our charts PowerPoint templates and PPT Slides are readymade to fit into any presentation structure. Presenters tell us our Business Chart And Graphs On Computer Tablet PowerPoint Templates PPT Backgrounds For Slides 0113 effectively help you save your valuable time. PowerPoint presentation experts tell us our a PowerPoint templates and PPT Slides have awesome images to get your point across. The feedback we get is that our Business Chart And Graphs On Computer Tablet PowerPoint Templates PPT Backgrounds For Slides 0113 will make you look like a winner. Use our a PowerPoint templates and PPT Slides provide great value for your money. Be assured of finding the best projection to highlight your words. Enumerate your ideas with our Business Chart And Graphs On Computer Tablet PowerPoint Templates Ppt Backgrounds For Slides 0113. Prioritize them as per your wish.


We present our Pie Chart Graph Dollar Success PowerPoint Templates PPT Backgrounds For Slides 1212.Use our Pie charts PowerPoint Templates because you can Help your viewers automatically emphathise with your thoughts. Download and present our Success PowerPoint Templates because the success of your venture depends on the performance of every team member. Download our Business PowerPoint Templates because it helps you to explain your plans in all earnest to your colleagues and raise the bar for all. Download and present our Finance PowerPoint Templates because let this slide illustrates others piggyback on you to see well over the horizon. Download our Marketing PowerPoint Templates because you have analysed the illness and know the need.Use these PowerPoint slides for presentations relating to Pie charts graph success Dollar, pie charts, success, finance, business, marketing. The prominent colors used in the PowerPoint template are Blue, Green, Red. We assure you our Pie Chart Graph Dollar Success PowerPoint Templates PPT Backgrounds For Slides 1212 are Efficacious. Customers tell us our pie PowerPoint templates and PPT Slides are visually appealing. Customers tell us our Pie Chart Graph Dollar Success PowerPoint Templates PPT Backgrounds For Slides 1212 are Bold. The feedback we get is that our Dollar PowerPoint templates and PPT Slides will make the presenter successul in his career/life. PowerPoint presentation experts tell us our Pie Chart Graph Dollar Success PowerPoint Templates PPT Backgrounds For Slides 1212 will make you look like a winner. PowerPoint presentation experts tell us our success PowerPoint templates and PPT Slides are Delightful. Flood your audience with great slides with our Pie Chart Graph Dollar Success PowerPoint Templates Ppt Backgrounds For Slides 1212. Try us out and see what a difference our templates make.


Pie Chart Graph Dollar Business PowerPoint Templates And PowerPoint Themes 0912-Microsoft Powerpoint Templates and Background with pie chart graph and dollar-Pie chart graph and dollar, business, signs, marketing, money, finance Fashion your plans on our Pie Chart Graph Dollar Business PowerPoint Templates And PowerPoint Themes 0912. They will always keep you in contention.


3d Pie Chart Graph And Dollar PowerPoint Templates And PowerPoint Themes 0912-Microsoft Powerpoint Templates and Background with pie chart graph and dollar-Pie chart graph and dollar, business, signs, marketing, money, finance Connect the dots differently. Be daring with our 3d Pie Chart Graph And Dollar PowerPoint Templates And PowerPoint Themes 0912.


Pie Chart Graph Dollar Marketing PowerPoint Templates And PowerPoint Themes 0812-Microsoft Powerpoint Templates and Background with pie chart graph and dollar Our Pie Chart Graph Dollar Marketing PowerPoint Templates And PowerPoint Themes 0812 have a chrismatic effect. The audience will attest to your brilliance.


Pie Chart Graph Dollar Finance PowerPoint Templates And PowerPoint Themes 0812-Microsoft Powerpoint Templates and Background with pie chart graph and dollar Dosen't matter what the topic. Make it interesting with our Pie Chart Graph Dollar Finance PowerPoint Templates And PowerPoint Themes 0812. You will be at the top of your game.


PowerPoint Designs Chart TimeLine Graphs PPT Backgrounds-These high quality powerpoint pre-designed slides and powerpoint templates have been carefully created by our professional team to help you impress your audience. All slides have been created and are 100% editable in powerpoint. Each and every property of any graphic - color, size, orientation, shading, outline etc. can be modified to help you build an effective powerpoint presentation. Any text can be entered at any point in the powerpoint template or slide. Simply DOWNLOAD, TYPE and PRESENT! Enter any arena with our PowerPoint Designs Chart Timeline Graphs Ppt Backgrounds. You will certainly emerge the champion.


Microsoft PowerPoint Template and Background with set of icons with different types of charts and graphs Step on it with our Charts Graphs Business PowerPoint Templates And PowerPoint Backgrounds 0411. Escalate the process with our Charts Graphs Business PowerPoint Templates And PowerPoint Backgrounds 0411.


Persuade your audience using this Security KPI Dashboard With Various Charts And Graphs Ppt Summary Background Image PDF. This PPT design covers three stages, thus making it a great tool to use. It also caters to a variety of topics including Various Charts, Security KPI Dashboard, Graphs. Download this PPT design now to present a convincing pitch that not only emphasizes the topic but also showcases your presentation skills.


Pitch your topic with ease and precision using this use pareto chart graph software for quality administration structure pdf. This layout presents information on use pareto chart graph software for quality administration. It is also available for immediate download and adjustment. So, changes can be made in the color, design, graphics or any other component to create a unique layout.
Presenting sales performance report with charts and graphs ppt powerpoint presentation icon master slide pdf to dispense important information. This template comprises three stages. It also presents valuable insights into the topics including sales performance report with charts and graphs. This is a completely customizable PowerPoint theme that can be put to use immediately. So, download it and address the topic impactfully.


Presenting business sales analysis charts and graphs ppt powerpoint presentation file deck pdf to dispense important information. This template comprises three stages. It also presents valuable insights into the topics including business sales analysis charts and graphs. This is a completely customizable PowerPoint theme that can be put to use immediately. So, download it and address the topic impactfully.


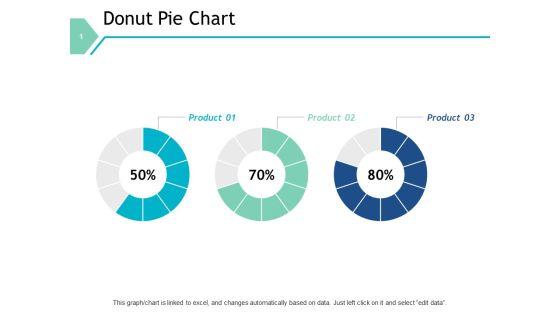
Pitch your topic with ease and precision using this market competitiveness donut chart sales graph ppt powerpoint presentation file visual aids pdf. This layout presents information on market competitiveness donut chart sales graph. It is also available for immediate download and adjustment. So, changes can be made in the color, design, graphics or any other component to create a unique layout.


Presenting this set of slides with name charts and graphs for business analytics ppt powerpoint presentation file background designs pdf. The topics discussed in these slide is charts and graphs for business analytics. This is a completely editable PowerPoint presentation and is available for immediate download. Download now and impress your audience.


Showcasing this set of slides titled Breakdown By Area In Pie Chart And Graph Introduction PDF. The topics addressed in these templates are Break Down, Area Pie, Chart Graph. All the content presented in this PPT design is completely editable. Download it and make adjustments in color, background, font etc. as per your unique business setting.
56 Item(s)